1. Introduction
With the vigorous development of the unmanned aerial vehicles (UAVs) industry, the types of UAVs have also become more diverse [Reference Tedeschi, Nuaimi, Awad and Natalizio1]. In the low-altitude domain, when the Reynolds number is less than 105, the aerodynamic efficiency of fixed-wing and rotary-wing aerial vehicles decreases rapidly as the size of the aircraft decreases and the flight speed decreases [Reference Shahzad, Tian, Young and Lai2]. Flapping-wing flying robots (FWFRs), which imitate birds in nature by flapping wings to realize flight, have the characteristics of high aerodynamic efficiency, high maneuverability, low noise, and high concealment. However, most FWFRs are small in size [Reference Phan, Park and Floreano3–Reference Singh, Zuber, Hamidon, Mazlan, Basri and Ahmad5] with weak wind resistance, poor endurance, limited mission payload, and flight range. In addition, with the rise of bionic research on soaring [Reference Kim and Perez6, Reference Reddy, J.W., Celani, Sejnowski and Vergassola7], formation [Reference Abujabal, Fareh, Sinan, Baziyad and Bettayeb8, Reference Bui and Phung9], and bird claws [Reference Shin, Phan, Daley, Ijspeert and Floreano10–Reference Wu, Bai and O’Sullivan13], prototypes that mimic large wingspan birds such as eagles or albatrosses have received increasing attention.
Flapping wings are the main airloads source for FWFRs. Due to the use of lightweight elastic materials such as carbon fiber in flapping wings, the wing structure undergoes dynamic deformation under the action of aerodynamic force during flapping, which in turn causes a series of complex changes in the flow field. Moreover, since flapping wings have a certain mass, aerodynamic loads, inertial loads, and structural elasticity are coupled with each other during flapping, and all of them have an inescapable impact on the flapping performance of FWFRs. Compared to small FWFRs, large flapping-wing flying robots (LFWFRs) have a higher proportion of wing mass, and the wing deformation is more obvious. The aerodynamic analysis methods that ignore wing inertial loads or assume wings as rigid bodies are no longer applicable [Reference Taha, Hajj and Nayfeh14]. Therefore, it is necessary to design an aerodynamic analysis method that considers the flexibility deformation of LFWFRs wings.
The flexibility of flapping wings is inevitable in FWFRs design due to material limitations. Therefore, impressive results have been found to evaluate the impact of flexibility. For the case with incoming flow [Reference Heathcote and Gursul15] (Reynolds numbers ranging from 9000 to 27,000), a certain degree of chordwise flexibility can improve thrust coefficient and propulsion efficiency. Furthermore, the water tunnel experiments [Reference Heathcote, Wang and Gursul16] show that introducing a certain degree of spanwise flexibility is beneficial for propulsion. It is worth noting that the range of Strouhal numbers that benefit from spanwise flexibility overlaps with the range of Strouhal numbers found in nature (0.2–0.4).
The method of combining the experimental collection of flapping wing deformation data with numerical simulation is a hybrid experimental numerical method [Reference Tay, de Baar, Percin, Deng and Oudheusden17, Reference Yang, Song, Yang, Xue, Pei and Lang18]. Compared with pure experiments or pure numerical simulations (fluid–structure coupling), this method has two main advantages: first, it can obtain all flow field information; second, there is no need to model the structure of flapping wings. The calculation results obtained by this method agree with the experimental results. This method has high measurement accuracy, which could greatly improve the overall calculation accuracy. However, the deformation data collected in experiments could only be applied in specific flight conditions and cannot be used directly for aerodynamic analysis under different flight parameters.
Apart from the flexibility, unlike fixed-wing and rotary-wing flight modes, the flapping-wing flight mode will cause periodic plunging oscillations in the wings, which means significant inertial force fluctuations because of the wing weight. The prediction of aerodynamic theory often ignores the influence of inertial loads. However, due to the inertial loads of flapping wing flight, the choice of kinematics is limited to the range of high lift and low aerodynamic efficiency. Since the power saved by improving aerodynamic efficiency is smaller than the power added by inertial loads with the reduction in angle of attack (AOA), natural flying organisms generally adopt the flight mode with a high AOA [Reference Usherwood19]. The unsteady strip theory is used to calculate the inertial force of biomimetic flapping wings [Reference Phan, Truong and Park20]. Their method is to make many slices along the spanwise of the flapping wing and then treat each slice as a two-dimensional airfoil with uniform mass distribution, without considering the different mass distribution properties of the flapping wing membrane and carbon rod. Furthermore, ref. [Reference Phan and Park21] studies the effect of wing inertia on power and AOA based on the beetles’ three-dimensional free hovering flight wing kinematics data. The research results indicate that although the beetles fly in a high AOA with low aerodynamic efficiency, they can effectively reduce the expenditure of inertial power.
In summary, the flexibility and inertial force of flapping wings have a significant impact on the performance of FWFRs. Currently, experimental and numerical simulation methods are mainly used to study this. However, the deformation data collected from experiments can only be applied to specific working conditions and cannot be directly applied to load analysis under different flight parameters. The numerical simulation takes too much time to calculate the aerodynamic and inertial loads, which cannot be used in real-time position and attitude control.
To address the aforementioned issues, this paper establishes a three-dimensional aeroelastic model of flexible wings for flapping wing aircraft with large wingspan (wingspan ≥ 1.8 m) by coupling the finite element method and finite state aerodynamic model. This model considers the interaction between aerodynamic loads, inertial loads, and wing structure elasticity during the flapping process of large wingspan flapping wings, which could quickly calculate the instantaneous aerodynamic loads and inertial loads of flapping wings under different flight conditions. The main contributions of this paper can be summarized in the following three aspects:
-
1. A highly efficient flexible flapping wing load calculation method has been designed. Compared with commonly used fluid–structure coupling methods, this method has a faster calculation speed and considers both aerodynamic loads and inertial loads for flapping wings. Enabling load calculation on flight control, which could be used to guide the rapid iterative upgrade and control law design of LFWFRs;
-
2. A LFWFR experimental platform was designed to address the coupling of aerodynamic loads, inertial loads, and structural elasticity during flexible flapping wing motion. The platform can be used in vacuum and wind tunnel environments and could collect three-axis force and torque data. The decoupling of inertial and aerodynamic loads can be achieved by combining flapping wing vacuum experiments and wind tunnel experiments;
-
3. Vacuum experiments and simulations verified the correctness of using the equivalent weight skeleton method instead of the wings with membrane for structural modeling. This method can effectively reduce the difficulty of modeling flapping-wing structures.
The rest of the paper is organized as follows. Section 2 introduces the structure of LFWFR HIT-Hawk. Section 3 establishes the aeroelastic model for LFWFR wings. In Section 4, we introduce the experiment system design. In Section 5, the results of experiments and simulations have been discussed. Finally, a conclusion is drawn in Section 6.
2. Problem formulation
2.1. Structural analysis
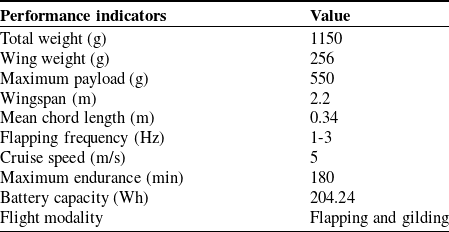
Birds in nature have complex wing structures that enable them to make complex maneuvers during takeoff, hunting, and evasion of predators. However, due to material and structural design limitations, the current FWFR wings do not have the same degree of freedom as birds. At present, the FWFRs with high flight efficiency still mainly use single-degree-of-freedom flapping wings, such as the Dovelike FWFR [Reference Yang, Wang and Song22], which set the Guinness World Record for single-charge flight endurance of FWFR in 185 minutes. The LFWFR studied in this paper is based on our research on the high-efficiency LFWFR platform HIT-Hawk. The main performance parameters are shown in Table I.
HIT-Hawk main specification.

HIT-Hawk adopted a modular approach in the overall mechanical design, as shown in Figure 1. It is mainly divided into four parts: fuselage module, transmission module, tail module, and wing module. The body is cut from a carbon fiber board and used to connect various modules. The transmission module converts the rotation of the brushless direct current motor (BLDC) into reciprocating flapping of wings through a two-stage gear reducer. The flapping wing is connected to the fuselage through a ball head, providing the main lift and thrust for flight. There are two servos on the tail to control the attitude of HIT-Hawk.
The structural design diagram of HIT-Hawk.

The wings are composed of carbon fiber composite rods and lightweight membrane materials, which are glued to the skeleton. The mass of the unloaded HIT-Hawk is 1150 g, while the mass of the wings is 256 g, accounting for 22.26% of the total weight of HIT-Hawk. The wing/body mass ratio for avian is a range of 10–20%. The 22.26% wing/body mass ratio is near the large flapping-wing avians like eagles or albatrosses. Reference [Reference Sibilski, Loroch, Buler and Zyluk23] pointed out that ignoring the inertia force of flapping wings may lead to different or even completely incorrect results in dynamics and control problems, which is particularly evident for LFWFRs. Therefore, the influence of inertial force cannot be ignored when calculating loads. Considering the coupling of aerodynamic, inertial, and elastic forces during flapping, it is necessary to establish structural dynamic equations for LFWFR wings.
2.2. Modeling
The large flexible deformation and high proportion of flapping wing mass of LFWFRs result in a strong coupling relationship between wing aerodynamic loads and structural deformation. Therefore, in the aerodynamic calculation of flexible flapping wings, the flexible deformation of the flapping wings needs to be considered, and correspondingly, the influence of aerodynamic loads also needs to be taken into account in the deformation calculation of flexible flapping wings. To this end, we calculate the aerodynamic loads and structural deformations of flexible flapping wings based on finite state aerodynamic models and equivalent wing structure dynamic models and exchange data between aerodynamic and structural nodes through radial basis functions (RBF) [Reference Yang, Song, Yang, Xue, Pei and Lang18]. Finally, we use the Newmark method to solve the dynamic equations. The model framework is shown in Figure 2.
Aeroelastic dynamics model framework.

The flapping equation of the wings is derived from the spatial crank connecting rod mechanism model of the transmission module [Reference Zhong and Xu24], and the flapping equation obtained through third-order Fourier fitting is:
 \begin{equation} \beta =a_{0}+\sum _{i=1}^{3}\left(a_{i}\cos \left(\frac{i\cdot f}{2}t\right)+b_{i}\sin \left(\frac{i\cdot f}{2}t\right)\right) \end{equation}
where
 $\beta$
is the flapping angle (rad),
 $f$
is the flapping frequency,
 $a_{0}=0.2362 , a_{1}=-0.3818 , b_{1}=0.00686 , a_{2}=0.03003 , b_{2}=-0.001706 , a_{3}=-0.003558 , b_{3}= 0.0002689$
. When
 $t=0$
, the flapping wing is at the highest position.
3. Aeroelastic model
3.1. Aerodynamic model
The aerodynamic model established in this section is based on the two-dimensional finite state airloads theory derived by Peters et al. [Reference Peters, Hsieh and Torrero25]. This theory is based on the assumption of incompressible potential flow, which can be coupled with any unsteady wake model to calculate the aerodynamic loads of thin airfoils under large rigid motions and small deformations. The incompressible potential flow assumption applies to the situation of low-speed flow, high Reynolds number, and no flow separation. The flight velocity of LFWFRs is much lower than 100 m/s (0.3 times the speed of sound). The Reynolds numbers Re > 106 and AOA < 20°, which are not prone to flow separation. Thus, the two-dimensional finite state airloads theory is suitable for LFWFRs aerodynamic analysis. Compared with the computational fluid dynamics (CFD) method, the calculation speed of this method is much faster. Using the same computer, the CFD method often takes more than 10 h to complete the calculation of one flapping cycle, while this method takes less than 1 s. Furthermore, this method can be coupled with the structural dynamics equations and multi-body dynamics equations, which is applicable to the design of control laws for LFWFRs.
A thin airfoil wing of arbitrary shape undergoing unsteady motion in two-dimensional space is considered. A Cartesian coordinate system is established as shown in Figure 3. The origin of the coordinate system is defined at the midpoint of the chord length of the airfoil. The air velocity in the
 $x$
positive direction is
 $u_{0}$
, the air velocity in the
 $y$
positive direction is
 $v_{0}$
, and the velocity gradient of the overall rotation of the coordinate system is
 $v_{1}$
. If counterclockwise is defined as positive, then the vertical velocity of the airfoil at the horizontal
 $x$
axis can be expressed as
 $v_{0}+v_{1}x/b$
, where
 $b$
is the half chord length of the airfoil. The rigid motion of the airfoil is characterized by
 $u_{0} , v_{0}$
, and
 $v_{1}$
. The deformation is represented by the mid-curve deformation function
 $h(x,t)$
(positive down). The deformation of the airfoil is much smaller than the motion in the coordinate system so that
 $h\ll b , \partial h/\partial x\ll 1$
and
 $\partial h/\partial t\ll u_{0}$
. Then the nonpenetration condition of the thin airfoil can be written as [Reference Peters, Hsieh and Torrero25]:
 \begin{equation} w=\overline{v}+\lambda =u_{0}\partial h/\partial x+\partial h/\partial t+v_{0}+v_{1}x/b \end{equation}
where
 $w$
is the total induced flow,
 $\lambda$
is the induced flow from the trailed circulation, and
 $\overline{v}$
is the induced flow from bound circulation.
Two-dimensional airfoil flapping diagram within a flapping cycle (leftwing).

Let
 $\varphi =\arccos (x/b)$
, Glauert expansions are used for
 $h$
:
 \begin{equation} h=\sum _{n=0}^{N_{aero}}h_{n}\cos \left(n\varphi \right) \end{equation}
where
 $N_{aero}$
is the order of Glauert expansion. In this paper, we set
 $N_{aero}=6$
. The expansion parameter
 $h_{n}$
can be calculated by:
 \begin{equation} \boldsymbol{h}_{\boldsymbol{n}}=\boldsymbol{T}_{\boldsymbol{g}}\cdot \boldsymbol{h}_{\boldsymbol{\varphi }} \end{equation}
 \begin{equation} \boldsymbol{T}_{\boldsymbol{g}}=\left[\begin{array}{c@{\quad}c@{\quad}c@{\quad}l} 1 & 1 & 1 & \cdots \\ \cos \left(\varphi _{1}\right) & \cos \left(\varphi _{2}\right) & \cos \left(\varphi _{3}\right) & \cdots \\ \cos \left(2\varphi _{1}\right) & \cos \left(2\varphi _{2}\right) & \cos \left(2\varphi _{3}\right) & \cdots \\ \vdots & \vdots & \vdots & \ddots \end{array}\right] \end{equation}
where
 $\boldsymbol{T}_{\boldsymbol{g}}$
is a
 $(N_{aero}+1)\times N_{\textit{guass}}$
matrix.
 $\boldsymbol{h}_{\boldsymbol{\varphi }}$
is the deformation of each Gauss point. The position of each Gauss point is defined by Gauss–Chebyshev Quadrature Formula. The number of Guass point
 $N_{\textit{gauss}}$
in each airfoil is 7. The pressure distribution
 ${\unicode[Arial]{x0394}} P$
in each Guass point can be expanded as [Reference Peters, Hsieh and Torrero25]:
 \begin{equation} {\unicode[Arial]{x0394}} P\left(\varphi \right)=2\rho \left[\frac{\tau _{s}}{\sin \varphi }-\frac{\tau _{0}\cos \varphi }{\sin \varphi }+\sum _{n=1}^{\infty }\tau _{n}\sin \left(n\varphi \right)\right] \end{equation}
For forward flight two-dimensional airfoil,
 $\tau _{s}=\tau _{0}$
.
 $\rho$
is the air density. The expansion terms are written as [Reference Stanford, Beran and Kobayashi26]:
 \begin{equation} \begin{aligned} \boldsymbol{\tau }_{\boldsymbol{n}}&=u_{0}\left(\boldsymbol{v}_{\boldsymbol{n}}-\boldsymbol{\lambda }_{\boldsymbol{0}}\right)+\left(b\boldsymbol{W}_{\boldsymbol{aero}}\cdot \dot{\boldsymbol{v}}_{\boldsymbol{n}}/2\right)\\ &\quad+\left(u_{0}^{2}\boldsymbol{I}_{\boldsymbol{n}}/b+\dot{u}_{0}\boldsymbol{W}_{\boldsymbol{aero}}/2\right)\cdot \boldsymbol{K}_{\boldsymbol{aero}}\cdot \boldsymbol{h}_{\boldsymbol{n}}\\ &\quad +u_{0}\left(\boldsymbol{I}_{\boldsymbol{n}}+\boldsymbol{W}_{\boldsymbol{aero}}\cdot \boldsymbol{K}_{\boldsymbol{aero}}/2\right)\cdot \dot{\boldsymbol{h}}_{\boldsymbol{n}}+b\boldsymbol{W}_{\boldsymbol{aero}}\cdot \ddot{\boldsymbol{h}}_{\boldsymbol{n}}/2 \end{aligned} \end{equation}
where the vectors
 $\boldsymbol{v}_{\boldsymbol{n}}=\{\begin{array}{l@{\quad}l@{\quad}l@{\quad}l@{\quad}l} v_{0} & v_{1} & 0 & \ldots & 0 \end{array}\}^{T}$
and
 $\boldsymbol{\lambda }_{\boldsymbol{0}}=\{\begin{array}{l@{\quad}l@{\quad}l@{\quad}l@{\quad}l} \lambda _{0} & 0 & 0 & \ldots & 0 \end{array}\}^{T}$
.
 $\boldsymbol{I}_{\boldsymbol{n}}$
is the identity matrix.
 $\boldsymbol{W}_{\boldsymbol{aero}}$
and
 $\boldsymbol{K}_{\boldsymbol{aero}}$
could be obtained from ref. [Reference Stanford, Beran and Kobayashi26]. Similarly, Eq. (6) could also be put in matrix form:
 \begin{equation} \boldsymbol{\unicode{x1D6E5} }\boldsymbol{P}=2\rho \boldsymbol{P}_{\boldsymbol{g}}\cdot \boldsymbol{\tau }_{\boldsymbol{n}} \end{equation}
 \begin{equation} \boldsymbol{P}_{\boldsymbol{g}}=\left[\begin{array}{l@{\quad}l@{\quad}l@{\quad}l}\displaystyle \frac{1-\cos \left(\varphi _{1}\right)}{\sin \left(\varphi _{1}\right)} & \sin \left(\varphi _{1}\right) & \sin \left(2\varphi _{1}\right) & \cdots \\ \\ \displaystyle\frac{1-\cos \left(\varphi _{2}\right)}{\sin \left(\varphi _{2}\right)} & \sin \left(\varphi _{2}\right) & \sin \left(2\varphi _{2}\right) & \cdots \\ \\ \displaystyle\frac{1-\cos \left(\varphi _{3}\right)}{\sin \left(\varphi _{3}\right)} & \sin \left(\varphi _{3}\right) & \sin \left(2\varphi _{3}\right) & \cdots \\ \vdots & \vdots & \vdots & \ddots \end{array}\right] \end{equation}
The aerodynamic loads along the x and y axes in the airfoil coordinate system are as follows:
 \begin{equation} \begin{aligned} F_{x}&=\int _{-b}^{b}{\Delta} P\left(\frac{\partial h}{\partial x}\right)\,\text{d}x-2\pi b\rho \left(v_{0}+\dot{h}_{0}-\lambda _{0}+u_{0}\sum _{n=1,3,5}^{\infty }nh_{n}/b\right)^{2}\\ F_{y}&=\int _{-b}^{b}{\Delta} P\,\text{d}x \end{aligned} \end{equation}
To solve the above equation, the first term of Glauert expansion of the induced flow
 $\lambda _{0}$
(i.e., the uniform inflow) should be obtained. Based on the extended least squares method,
 $\lambda _{0}$
can be calculated by the weighted sum of inflow states:
 \begin{equation} \lambda _{0}\approx \frac{1}{2}\sum _{n=1}^{N}b_{n}\lambda _{n} \end{equation}
The calculation method of
 $b_{n}$
and
 $\lambda _{n}$
can be referred to ref. [Reference Peters, Arunamoorthyt and Cao27].
 $N$
is the number of inflow states. It should be noted that the aerodynamic loads obtained by the above method is two-dimensional. For a three-dimensional flapping wing, the aerodynamic load of the whole wing can be obtained by the blade element theory along the spanwise direction. This theory ignores the spanwise flow, which only applies to high aspect ratio (AR) wings (AR>5 is better [Reference Li, Yu, Lin and Li28]).
3.2. Structural model
The finite element method is one of the most commonly used methods for calculating structural deformation, which is widely used in the flexible deformation calculation for various FWFRs [Reference Si, Hao, Guo, Tong and Bing29]. As mentioned in ref. [Reference Xue, Song, Song, Yang, Xu and Wu30], only the skeleton bears the air loads as long as there is no prestress on the membrane. Thus, it is feasible to establish the flapping-wing structural model that only considers the skeleton and distributes the mass of membrane on the skeleton to approximate the inertial effects of membrane. This model is established through beam elements in commercial finite element software Abaqus. The epoxy carbon fiber material used for the skeleton is anisotropic, and the material parameters can be obtained in ref. [Reference Liu, Liu and Ding31]. The global mass matrix and global stiffness matrix of the wing can be obtained from this finite element model.
The global damping matrix is determined by the Rayleigh damping method, which is simple, convenient, and widely used in structural dynamic analysis. The Rayleigh damping assumption assumes that the damping matrix of a structure is a combination of the mass matrix and stiffness matrix:
 \begin{equation} \boldsymbol{C}=a\boldsymbol{M}+b\boldsymbol{K} \end{equation}
In (12),
 $a$
and
 $b$
are the proportional coefficients, which can be determined by the natural frequencies and damping ratio. The natural frequency can be obtained from the Abaqus structural model, and the damping ratio can be determined from the loss factor of the material. For HIT-Hawk, the values of
 $a$
and
 $b$
are 0.037 and 0.0005, respectively.
The motion equation of each structural node on the wing of a LFWFR can be simplified as:
 \begin{equation} \boldsymbol{M}\cdot \ddot{\boldsymbol{h}}\boldsymbol{=}\boldsymbol{C}\cdot \dot{\boldsymbol{q}}\boldsymbol{+}\boldsymbol{K}\cdot \boldsymbol{q}\boldsymbol{+}\boldsymbol{F}_{aero} \end{equation}
where
 $\boldsymbol{h}$
is the displacement function of the node,
 $\boldsymbol{q}$
is the structural deformation of the wing node,
 $\boldsymbol{M}$
is the global mass matrix of the wing,
 $\boldsymbol{K}$
is the global stiffness matrix, and
 $\boldsymbol{C}$
is the global damping matrix. Let the rigid displacement of the wing node be
 $\boldsymbol{\zeta }$
. We can get:
 \begin{equation} \boldsymbol{\zeta }\boldsymbol{=}\boldsymbol{q}\boldsymbol{+}\boldsymbol{h} \end{equation}
For wing movements with known flapping equations, the rigid flapping motion of the wings can be used to characterize
 $\boldsymbol{\zeta }$
. Considering that there is no aerodynamic load in a vacuum environment,
 $\boldsymbol{F}_{\boldsymbol{aero}}$
can be ignored, substituting Eq. (14) into Eq. (13) yields:
 \begin{equation} \boldsymbol{M}\cdot \ddot{\boldsymbol{q}}\boldsymbol{+}\boldsymbol{K}\cdot \boldsymbol{q}\boldsymbol{+}\boldsymbol{C}\cdot \dot{\boldsymbol{q}}\boldsymbol{=}\boldsymbol{M}\cdot \ddot{\boldsymbol{\zeta }} \end{equation}
Equation (15) can be solved using numerical analysis methods such as mode superposition method or the Newmark method. Here, the Newmark method is chosen as the average constant acceleration method, assuming that the acceleration at each time step is continuous, and its value is the average acceleration at the beginning and end of the time step (
 $\gamma =0.5 , \beta =0.25$
). When the time step
 ${\unicode[Arial]{x0394}} t$
is less than 0.001s, the calculation is convergent. The deformation
 $\boldsymbol{q}_{\boldsymbol{t}\boldsymbol{+}\boldsymbol{\Delta}\boldsymbol{t}}$
amount and its velocity
 $\dot{\boldsymbol{q}}_{\boldsymbol{t}\boldsymbol{+}\boldsymbol{\Delta }\boldsymbol{t}}$
at
 $t+\Delta t$
can be calculated using the following two equations:
 \begin{equation} \boldsymbol{q}_{\boldsymbol{t}\boldsymbol{+}\boldsymbol{\Delta }\boldsymbol{t}}=\boldsymbol{q}{\boldsymbol{t}}+\Delta t\dot{\boldsymbol{q}}_{\boldsymbol{t}}+\left(\frac{1}{2}-\beta \right)\left(\Delta t\right)^{2}\ddot{\boldsymbol{q}}_{\boldsymbol{t}}+\beta \left(\Delta t\right)^{2}\ddot{\boldsymbol{q}}_{\boldsymbol{t}\boldsymbol{+}\boldsymbol{\varDelta }\boldsymbol{t}} \end{equation}
 \begin{equation} \dot{\boldsymbol{q}}_{\boldsymbol{t}\boldsymbol{+}\boldsymbol{\varDelta }\boldsymbol{t}}=\dot{\boldsymbol{q}}_{\boldsymbol{t}}+\left(1-\gamma \right)\Delta t\ddot{\boldsymbol{q}}_{\boldsymbol{t}}+\gamma \Delta t\ddot{\boldsymbol{q}}_{\boldsymbol{t}\boldsymbol{+}\boldsymbol{\varDelta }\boldsymbol{t}} \end{equation}
In
 $t+{\unicode[Arial]{x0394}} t$
:
 \begin{equation} \boldsymbol{M}\cdot \ddot{\boldsymbol{q}}_{\boldsymbol{t}\boldsymbol{+}\boldsymbol{\varDelta }\boldsymbol{t}}+\boldsymbol{C}\cdot \dot{\boldsymbol{q}}_{\boldsymbol{t}\boldsymbol{+}\boldsymbol{\varDelta }\boldsymbol{t}}+\boldsymbol{K}\cdot \boldsymbol{q}_{\boldsymbol{t}\boldsymbol{+}\boldsymbol{\varDelta }\boldsymbol{t}}=\boldsymbol{F}_{\boldsymbol{t}\boldsymbol{+}\boldsymbol{\varDelta }\boldsymbol{t}} \end{equation}
Combine Eq. (14), Eq. (15), and Eq. (16), we can get:
 \begin{equation} \hat{\boldsymbol{M}}\cdot \ddot{\boldsymbol{q}}_{\boldsymbol{t}\boldsymbol{+}\boldsymbol{\varDelta }\boldsymbol{t}}\boldsymbol{=}\hat{\boldsymbol{F}}_{\boldsymbol{t}\boldsymbol{+}\boldsymbol{\varDelta }\boldsymbol{t}} \end{equation}
where
 \begin{equation} \hat{\boldsymbol{M}}=\boldsymbol{M}+\gamma \Delta t\boldsymbol{C}+\beta \left(\Delta t\right)^{2}\boldsymbol{K} \end{equation}
 \begin{equation} \begin{aligned} \hat{\boldsymbol{F}}_{\boldsymbol{t}\boldsymbol{+}\boldsymbol{\varDelta }\boldsymbol{t}}&=\boldsymbol{M}\cdot \ddot{\boldsymbol{\zeta }}_{\boldsymbol{t}\boldsymbol{+}\boldsymbol{\varDelta }\boldsymbol{t}}-\boldsymbol{K}\cdot \boldsymbol{q}_{\boldsymbol{t}}-\left(\boldsymbol{C}+\Delta t\boldsymbol{K}\right)\cdot \dot{\boldsymbol{q}}_{\boldsymbol{t}}\\ &\quad -\left(\left(1-\gamma \right)\Delta t\boldsymbol{C}\left(\frac{1}{2}-\beta \right)\left(\Delta t\right)^{2}\boldsymbol{K}\right)\cdot \ddot{\boldsymbol{q}}_{\boldsymbol{t}} \end{aligned} \end{equation}
Therefore, as we set the deformation, deformation speed, and acceleration at the initial time, the deformation can be iteratively solved by Eq. (17). For calculation with aerodynamic loads, we just need to add
 $\boldsymbol{F}_{\boldsymbol{aero}}$
in Eq. (13). Since the discretization methods of aerodynamic and structural mesh are different, a corresponding conversion algorithm is needed to realize the data exchange between aerodynamic and structural mesh. In this paper, we choose a polynomial interpolation method based on RBFs.
4. Experimental system design
In order to collect data from various sensors in the experimental system and control the rotational speed of the BLDC, the signal acquisition and motion control system is specifically designed. In this system, we choose the USB6343 acquisition card from National Instruments Company as the sensor data acquisition device. This acquisition card can convert analog voltage signals into digital signals directly for PC processing and storage. The sampling accuracy is 16 bits, with a maximum sampling frequency of 250 kS/s. Besides, an acquisition platform based on LabVIEW is developed. To control the motion of BLDC, a control circuit based on the STM32 chip is also designed. On the one hand, STM32 receives control signals from the PC and controls the rotational speed of BLDC. On the other hand, it is also used to perform preprocessing before transmitting feedback signals to the PC. The signal acquisition and motion control block diagram of the experimental platform is shown in Figure 4. The six-dimensional force sensor is M3816BH from Sunrise Instruments. The hall sensor SS451A is used to measure the flapping frequency, and the flapping angle is measured by an AFB-MR1A magnetic encoder angle sensor module. The installation position of each sensor is shown in Figure 5.
Signal acquisition and motion control block diagram of experimental platform.

Experimental system and flapping wing.

The experiment involved a total of six pairs of flapping wings, as shown in Figure 5. The wings numbered NR do not contain wing ribs on the inner side, and the wings numbered R contain three wing ribs on the inner side. Number 1 means a wing skeleton without membrane and adhesive, while number 2 is an equivalent wing skeleton with added adhesive and weight blocks. Its mass and centroid position are consistent with the complete wing, which the number is 3. The cross section of the test section of the wind tunnel is 6 × 3.6 m, and the blockage ratio is less than 1.58%. Thus, we consider that the tunnel wall effects on the measurements are negligible. Currently, we use the C++ programming language to write the algorithms in Visual Studio on the PC. The CPU is Intel(R) Core(TM) i7-6700 CPU @ 3.40 GHz, and the Memory Module is 24 GB DDR4 2400 MHz. This method takes 0.807 s to complete the calculation of one flapping cycle, which is longer than the time of one flapping cycle (0.33–0.5 s). The calculation efficiency will be optimized in our future work to realize "real-time" calculation.
Experimental and simulation curves of NR wings under vacuum.

5. Results analysis and verification
5.1. Case 1: vacuum condition
There is no fluid in a vacuum environment, which can effectively eliminate the influence of aerodynamic loads during the LFWFR flapping process. Because there was no incoming flow, the flapping wing was placed horizontally on the test bench. The experimental data and simulation calculation curves collected during 2 Hz flapping are shown in Figs. 6 and 7. From the experimental curve, it can be seen that when the wing flaps up to the highest position, due to the release of elastic potential energy inside the wing, the force curve in the lift direction oscillates significantly when it reaches the highest value, while there is basically no oscillation when it flaps down to the lowest point. This is because the range of wing flapping angle changes is −6° to 37°. When the wing is at the lowest point, it is close to the horizontal position, and the inertial force component along the lift direction is relatively large, while the influence of elastic force is relatively small. While at the highest point, the component of inertial force along the lift direction is relatively small, and the influence of elastic force increases. This is also clearly reflected in the simulation, indicating that the structural model established in Section 3 has high accuracy. Simultaneously comparing the curves Exp.NR-2 and Exp.NR-3, we can observe that the variation curve of the equivalent skeleton lift direction is consistent with the complete wing, while Exp.R-2 and Exp.R-3 also basically overlap, and both experimental and simulation results prove that using an equivalent wing skeleton can replace a complete wing to complete structural modeling. This method can effectively avoid the problem of difficult modeling of membrane materials and has high accuracy.
Experimental and simulation curves of R wings under vacuum.

5.2. Case 2: wind tunnel condition
LFWFRs are limited by their larger wingspan, making it difficult to find suitable indoor testing sites. Additionally, there are too many uncontrollable factors in outdoor environments, making wind tunnel experiments an ideal choice. In order to demonstrate the cyclic variations of aerodynamic and inertial forces during flapping motion better, specific operating conditions (inflow velocity of 5 m/s, AOA of 10°, flapping frequency of 2 Hz) were selected for comparison. The results are shown in Figs. 8 and 9.
Lift curve for R-3 in one flapping cycle.

Thrust curve for R-3 in one flapping cycle.

Compared to the vacuum experiment, it can be seen that the elastic deformation of the wings is suppressed due to the influence of aerodynamic loads. The amplitude of inertial force curve in wind tunnel experiment along the direction of lift is much smaller than in vacuum experiment. In Figure 8, the experimental curve “Exp” and the calculated curve “Cal. Total” are in good agreement. In Figure 9, the experimental curve “Exp” and the calculated curve “Cal. Total” are approximate in the downstroke. While in the upstroke, the peak of the experimental curve is nearly 66% smaller than the calculated curve, and the trough is nearly 33% smaller than the calculated curve (absolute value). The asymmetry of the actual prototype may be the cause of this error, resulting in a difference in the difficulty of twisting the wings up and down. However, the structural wings model is symmetrical in simulation. This error will affect the calculation of LFWFRs’ flight speed and attitude for real-time control applications, which require the experimental data to compensate.
5.3. Case 3: different flight parameters
Cases 1 and 2 focus on the changes during the flapping cycle of the prototype. Here, the flight speed, flapping frequency, and AOA, which have a significant impact on flapping flight, were analyzed and verified by comparing the average lift and average thrust obtained from multiple measurements. The results are shown in Figure 10. With the variation of flapping frequency, AOA, and velocity, the average lift and thrust obtained from the calculations maintained the same trend as those obtained from the experiments. The NR-3 wing has higher average lift and thrust than the R-3 wing, and the simulation results are basically consistent with the experimental results, effectively proving the accuracy of the modeling method proposed in this paper.
Mean lift and thrust in different flight condition.

6. Conclusion
This paper establishes a three-dimensional aeroelastic model of flexible wings for LFWFRs by coupling finite element method and state-space airloads theory. This model considers the interaction between aerodynamic loads, inertial loads, and wing structure elasticity during the flapping process of large wingspan flapping wings and can quickly calculate the instantaneous aerodynamic loads and inertial loads of flapping wing systems under different flight conditions. In addition, to verify the correctness of the model, a flapping wing experimental platform was designed that can be applied to both vacuum and wind tunnel environments. The decoupling of inertial and aerodynamic loads was studied by combining flapping wing vacuum experiments and wind tunnel experiments. The vacuum experiment verified the correctness of using the equivalent weight skeleton method to replace whole wings for structural modeling, which can effectively reduce the difficulty of modeling flapping wing structures.
In the future, we will explore the applicable boundaries (wingspan, flapping frequency, inflow, etc.) of this aeroelastic model. Besides, we will take this model into the multi-body dynamic equation to complete the derivation of the overall dynamic equation and guide the design of the LFWFRs.
Author contribution
All authors contributed to the study’s conception and design. The research concept was from Xu Wenfu and Xu Hui. Material preparation, data collection, and analysis were performed by Xu Hui and Pan Erzhen. Xu Hui wrote the first draft of the manuscript, and all authors commented on previous versions. All authors read and approved the final manuscript.
Financial support
This work is supported by the National Natural Science Foundation of China under Grant No. 62233001, and Shenzhen excellent scientific and technological innovation talent training project under Grant No. RCJC20200714114436040.
Competing interests
The authors declare no conflicts of interest exist.
Ethical approval
Not applicable.