

Missing data (often referred to as missingness) is commonplace in clinical research, where participants may miss appointments, refuse certain tasks, drop out of or die during the course of longitudinal studies. Statistical techniques do not enable the analysis of data in which there are missing cases, consequently different approaches for dealing with the issue of missing values have evolved. Traditionally, the most commonly used approaches for dealing with missing values are deletion or single imputation. Deletion techniques exclude the missing data from analyses, thus statistical analysis is conducted only on complete sets of observed scores. While this may appear to be the most pragmatic approach, ignoring missing data is known to be problematic and has been criticised by methodologists as being one of the most dubious approaches to analysis (Wilkinson & American Psychological Task Force on Statistical Inference, Reference Wilkinson1999). Imputation techniques involve substituting the missing value with an estimated value. Single imputation techniques provide estimates based on the observed scores of the variable for which the data is missing. The most commonly used single imputation techniques are mean imputation and regression imputation. (Stochastic regression can also be used; however, this is rarely employed in clinical research, and is not addressed in this paper.) Mean imputation involves substituting the mean of the observed scores of a given variable for the missing value. Alternatively, where it is possible to conduct a regression analysis, a missing value can be estimated based on a regression equation for the variable.
It has been argued for some time that deletion and single imputation techniques fail to adequately address the impact missing data may have on analysis, with the primary concern being that such approaches do not account for the increased variance that may occur had the actual score(s) been obtained (Allison, Reference Allison2002; Enders, Reference Enders2010; Graham, Reference Graham2012; Schafer & Graham, Reference Schafer and Graham2002; Schafer & Olsen, Reference Schafer and Olsen1998). An additional consequence of deletion techniques is the reduction of statistical power that occurs from the reduction in sample size (Graham, Reference Graham2009; McKnight, McKnight, Sidani, & Figueredo, Reference McKnight, McKnight, Sidani and Figueredo2007). Therefore missing data has the potential to introduce bias and reduce the integrity of results. With the emergence of increasingly powerful statistical software, it is increasingly easy to employ more sophisticated missing data techniques that better compensate for the problems associated with traditional missing data approaches. Two of the more sophisticated approaches are multiple imputation (MI) and maximum likelihood (ML) (Allison, Reference Allison2002; Baraldi & Enders, Reference Baraldi and Enders2010; Sinharay, Stern, & Russell, Reference Sinharay, Stern and Russell2001). This report focuses on MI, as it has been suggested that this is the most generalisable and flexible missing data technique. MI is robust to breaches of the assumption of normality, is impacted less by the nature of the missing data than other approaches, and performs relatively well even in small samples (Graham, Reference Graham2012; Graham & Schafer, Reference Graham, Schafer and Hoyle1999; Jelicic, Phelps, & Lerner, Reference Jelicic, Phelps and Lerner2010; McKnight et al., Reference McKnight, McKnight, Sidani and Figueredo2007; Sinharay et al., Reference Sinharay, Stern and Russell2001).
Despite repeated recommendations for employing newer missing data techniques such as MI, these approaches are rarely used in clinical/psychological research (Enders, Reference Enders2010; Jelicic, Phelps, & Lerner, Reference Jelicic, Phelps and Lerner2009; Roth, Reference Roth1994; Schafer & Graham, Reference Schafer and Graham2002). This is possibly due to a lack of awareness of such approaches, and because the literature regarding these newer approaches can appear daunting for non-statisticians. Furthermore, the detrimental effect that missing data has on analysis is also often underestimated by researchers, thus methods that ameliorate the impact of missing data are not considered necessary. With this in mind, the aim of this report is to offer a conceptual demonstration of how deletion, single imputation and MI compare in estimating missing data when applied in clinical research, in order to demonstrate the impact missing data can have. First, to clarify the effect of missing data on analysis, a description of the nature of missing data, and the limitations of various approaches in addressing missing data, are provided.
Why Does Missing Data Matter?
In order to understand why missing data can bias results, it is necessary to briefly explain the nature of missingness itself. The underlying premise of missing data theory is that missingness is often not random in nature. Rubin (Reference Rubin1976) proposed that there are three types of missing data. First, data can be missing completely at random (MCAR). MCAR occurs in instances where missing data is not related to the scores on the variable in question, and is also not related to scores on any other variables under analysis. The second category proposed by Rubin is missing at random (MAR). Missing data in this category is not related to scores on the variable with the missing data; however, there may be systematic missingness in relation to another variable also being measured. For example, if assessing cognitive function during the acute phase following traumatic brain injury (TBI), it may be that individuals who also experienced orthopaedic injuries when the TBI was sustained would be less likely to complete a design-learning task, due to restricted mobility. In this case, missingness is systematic on one variable (presence of orthopaedic injury/polytrauma) but not on the variable being measured (design-learning), and is therefore MAR. Finally, missing values can be said to be missing not at random (MNAR). This occurs when the missing values are directly related to values of the variable in question. For example, if only participants who are experiencing high levels of depression refuse to complete a questionnaire assessing depression, high scores will be systematically missing on the variable with the missing data.
Missing data therefore has the potential to influence analysis in a number of ways. Clearly, where there is a relatively large amount of missing data and only the complete cases are analysed, the sample size may be seriously reduced. This results in a loss of power, leading to increased risk of Type II errors, whereby meaningful differences are missed (McKnight et al., Reference McKnight, McKnight, Sidani and Figueredo2007). An equally pressing concern, long recognised by statisticians but often unrecognised by clinical researchers, is that traditional techniques (deletion, single imputation) are based on an assumption that missing data occurs randomly, or is MCAR. However, data is often not MCAR, especially in the clinical setting where often there are one or more variables that have the potential to influence which scores are missing. As such, missingness is typically either MAR and MNAR, and therefore bias can occur (Graham, Reference Graham2009). A further limitation of both deletion and mean and regression imputation is that they only utilise the variance of the observed data set. These methods assume that missing data will fall within the variance range of the existing data set. This is concerning, as the missing data is likely to introduce greater variability and, as such, ignoring missing data may reduce variance. This attenuates differences where scores are being compared, increasing the likelihood of a Type I error occurring; identifying a significant effect when one is not present (Schafer & Olsen, Reference Schafer and Olsen1998). Alternatively, where correlational analysis is conducted, if mean imputation is used the strength of association becomes weaker, whereas employing regression imputation will strengthen the association, again increasing the risk of misinterpretation of results (Baraldi & Enders, Reference Baraldi and Enders2010; Schafer & Olsen, Reference Schafer and Olsen1998). In short, traditional approaches to replacing missing values are based on the frequently erroneous assumption that data is MCAR; increasing the risk of bias and errors in interpretation. Furthermore, the use of traditional techniques such as deletion and single imputation may lead to loss of power, and/or increased risk of Type I or Type II errors.
A Conceptual Explanation of Multiple Imputation (MI)
A brief conceptual description of the processes involved in MI is provided below. For more detailed explanations see Enders (Reference Enders2010), Graham (Reference Graham2012), Schafer (Reference Schafer1999) and/or Sinharay et al. (Reference Sinharay, Stern and Russell2001).
Three separate phases occur in MI; imputation, analysis and pooling. The imputation phase involves the creation of multiple data sets where missing scores are replaced by scores obtained from regression equations that are computed from the variable in question and other related variables, as selected by the researcher. Generally, all variables that will be used in the final analysis, and any variable expected to interact with the variables under investigation, should be included in the MI (Enders, Reference Enders2010). Indeed, including additional auxiliary variables (those which may interact with the outcome variable, but may not be of relevance to the research question) is recommended and does not mean that such variables need to be used in later analysis (Enders, Reference Enders2010). Several algorithms are available for use when conducting the imputation phase; however, data augmentation is the most commonly used as it assumes multivariate normality (Enders, Reference Enders2010; Graham, Reference Graham2009), and is the focus of the following description.
The imputation phase involves two steps; the imputation step (I-step) and posterior step (P-step). In the I-step one or more regression equations (based on observed scores of selected variables) are calculated to estimate missing values. To increase variability, an error term derived from the regression is added to each imputed score. From this set of scores, the P-step calculates new means and co-variances, and again a residual error term is added. The data set obtained in the P-step can then be used to create another imputed set of scores. In order to ensure that each imputed data set is independent, a large number of iterations (I-steps and P-steps) are run before the next imputed data set is selected for use in the analysis phase. Because each data set is based on different regression equations, and generates a different set of parameter estimates, the amount of variance is increased. Thus, MI techniques better account for the impact of unknown variance in the missing data than if a single imputation technique were to be employed. Parenthetically, by comparing the variability of parameters between each of the data sets, the researcher can also estimate the relative impact of the missing data – greater variation between data sets indicating a greater impact of missingness (McKnight et al., Reference McKnight, McKnight, Sidani and Figueredo2007). It should also be noted that the number of imputed data sets needed will vary depending on the amount and nature of the missing data, and predicted effect size (Graham, Olchowski, & Gilreath, Reference Graham, Olchowski and Gilreath2007; Graham & Schafer, Reference Graham, Schafer and Hoyle1999)
When the required number of imputed data sets have been created, the analysis phase is performed, in which the desired analysis is conducted on each data set separately. In other words, whatever analysis had been planned (regression, analysis of variance (ANOVA)) can be conducted separately on each of the multiple data sets. Finally, in the pooling phase, the results obtained for each imputed data set during the analysis phase are combined to obtain a single value reflective of all data sets. For example, means and standard errors could be calculated for each imputed data set during the analysis phase, and then combined to create a pooled mean and standard error, which can then be reported in the final analysis. The process of pooling varies in complexity, depending on the statistic being calculated. In some situations, such as pooling means, the formula for pooling results is the same as for any other data. However, in other situations the process is more complicated; for example, pooling standard errors employs a formula in which the variance between and within each imputed data set is taken into account (for further detail on method of reporting MI results and formulae for pooling, see Enders, Reference Enders2010).
Despite the conceptual nature of the above description, it may appear that MI is a complicated process. However, these steps are automated in many statistical software packages, and therefore MI can be conducted with relative ease. Nevertheless, it should be noted that popular statistical programs vary in capacity to perform the various stages of MI. For example, while SPSS conducts the imputation and analysis phases automatically, it currently doesn't always pool test statistics (for example, if F-tests are performed). Where the test statistic is not calculated, it is possible to create syntax or calculate manually (Enders, Reference Enders2010; Howell, Reference Howell2012; Schafer & Olsen, Reference Schafer and Olsen1998), although clearly this is not ideal and it is hoped that forthcoming versions will soon be more user-friendly. SAS does pool test statistics routinely, and there are also a number of MI-specific programs, such as NORM, which also have better functionality.
It is also important to have some understanding of the processes involved in MI, as the researcher may need to modify the default settings in some software. Of particular importance are decisions regarding the number of iterations allowed to run between each data set selected for analysis, and the total number of imputed data sets that should be obtained. For example, in SPSS (version 21) the default number of iterations when choosing the custom setting is 10, whereas it is likely that many more iterations may be necessary, with current recommendations suggesting that 100–200 iterations are typically required (Baraldi & Enders, Reference Baraldi and Enders2010; Graham & Schafer, Reference Graham, Schafer and Hoyle1999). Furthermore, in SPSS the default number of imputations is 5, and while some authors suggest that this is acceptable (Sinharay et al., Reference Sinharay, Stern and Russell2001), others suggest that 10–20 imputations are required, although this is dependent on the amount of missing data and predicted effect size (Enders, Reference Enders2010; Graham et al., Reference Graham, Olchowski and Gilreath2007; Graham & Schafer, Reference Graham, Schafer and Hoyle1999).
The Current Study
Baraldi and Enders (Reference Baraldi and Enders2010) offer a coherent and insightful demonstration that clearly illustrates traditional and newer techniques and their effect. The current study replicates this approach, but rather than create a simulated data set, the data reported here has been extracted from an existing clinical research project investigating cognitive and psychosocial function following traumatic brain injury (TBI). In order to demonstrate the application of missing data approaches within the clinical research setting, a small number of complete cases were randomly selected from the data set. Parameter estimates (means and standard deviation/error) were calculated, and then some scores were excluded to create a hypothetical missing data set. The means and standard deviations obtained by deletion, mean imputation, regression imputation and MI were then compared to the known mean and standard deviation of the complete data set in order in order to determine the relative efficacy of each approach.
Description of Data Set
Data was obtained from the Neurotrauma Register; a population study investigating cognitive and psychosocial recovery following TBI (ethics approval obtained). Individuals with TBI presenting at the Royal Hobart Hospital, Tasmania from 2003 to 2007 were invited to participate in the Register. A total of 1227 (m = 798, f = 429) individuals consented and underwent a battery of psychosocial and neuropsychological assessments at admission, with follow-up assessments at 3, 6 and 12 months, and annually up to 5 years post injury. For the purpose of the current study, a random draw of 20 participants was selected (m = 11, f = 9), and scores obtained at the initial assessment were used. The injury and demographic variables of the sample are shown in Table 1.
Injury and Demographic Characteristics of Participants (n = 20)

*Premorbid full-scale IQ was estimated using the National Adult Reading Test (NART).
Materials
Two cognitive measures were selected from the assessment battery. The Controlled Oral Word Association Task (COWAT; Benton & Hamsher, Reference Benton and Hamsher1989) requires participants to list as many words as possible, starting with a particular letter, within 60 s. Three trials, using the letters ‘F’, ‘A’ and ‘S’ were used for all participants, with the total number of words across all three conditions being used in analysis. Coughlan's Information Processing Speed Task (IP Speed; Coughlan & Hollows, Reference Coughlan and Hollows1985) is a measure of processing speed, in which the participant identifies the second highest number in each row of five numbers over a set of 105 rows of numbers. The total number of lines in which the correct number is crossed out was the score used in the current analysis.
Procedure
From the 20 selected cases, participants who had attended between June 2005 and June 2006 had their scores on the COWAT deleted, thereby simulating a data set in which some data was missing due to a hypothetical data entry error. As such, the simulated missing data set can be said to have data missing at random (MAR), as the likelihood of any given score being missing is not directly related to the variable being measured. Deletion, mean and regression imputation, and MI were then conducted.
Results
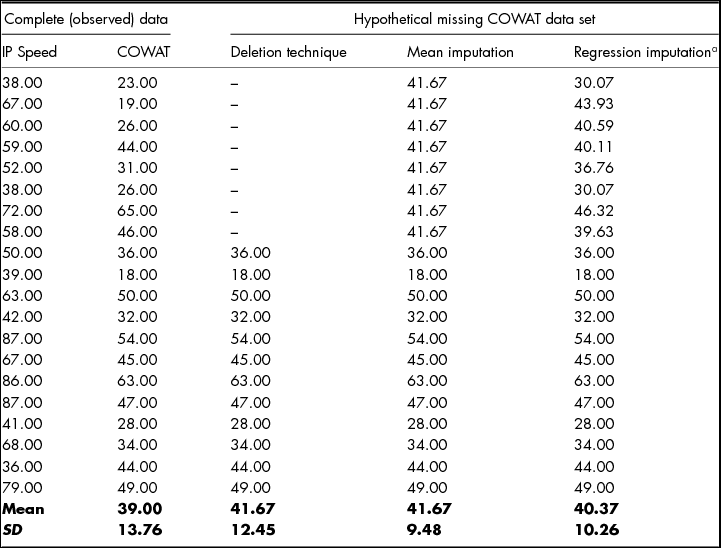
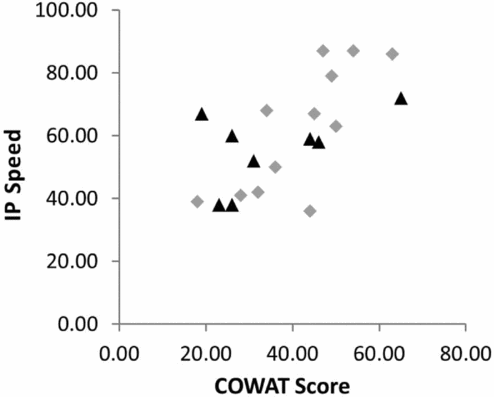
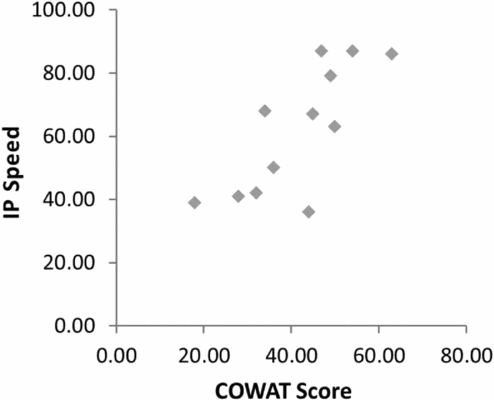
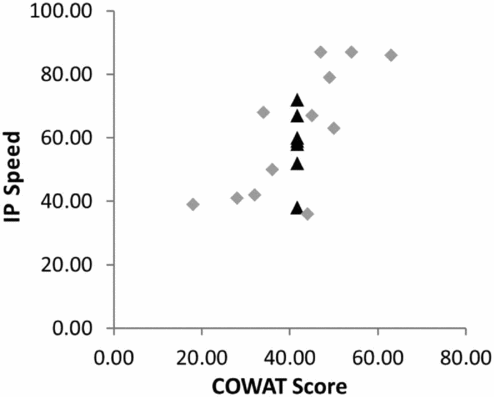
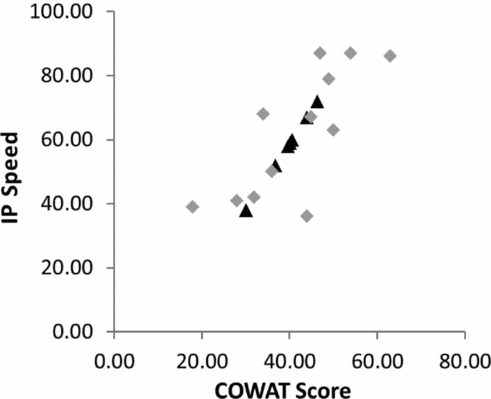
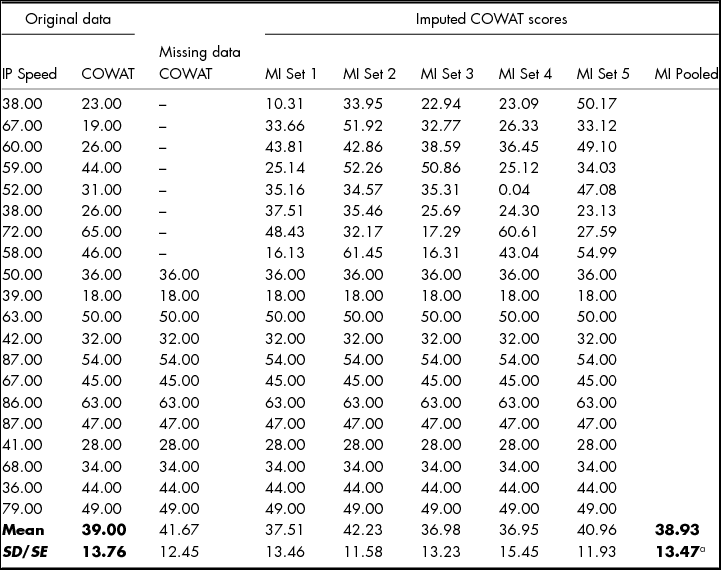
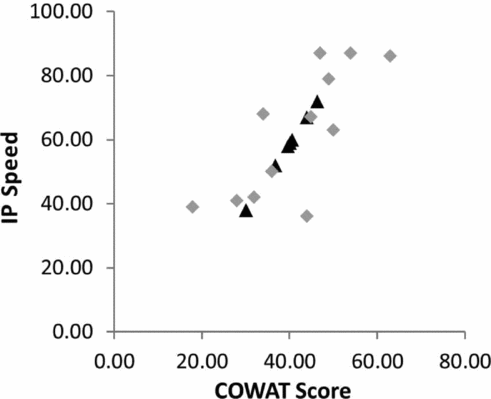
SPSS (version 21) was used for all analyses. Means and standard deviations were calculated for the complete set, and then COWAT scores for individuals assessed between June 2005 and June 2006 were excluded, resulting in a total of 8 out of the 20 scores being deleted. Standard approaches to missing data (deletion, and mean and regression imputation) were conducted, and the means and standard deviations obtained using each approach were compared to the known values of the full data set (Table 2). Scatterplots for the complete data set (Figure 1), the deletion data set (Figure 2), mean imputation (Figure 3) and regression imputation (Figure 4) are also provided to enhance illustration.
Means and Standard Deviations Obtained Using Deletion, Mean and Regression Imputation Techniques for Hypothetical Missing Data Set, Compared to Complete Data Set

a Regression imputation equation: Ŷ = 11.989 + 0.478 (IPSpeed).
Scatterplot of observed data set. ▴ Denotes observed data point deleted to create missing data set.
Scatterplot of the hypothetical data set cases with missing values removed using the deletion technique.
Scatterplot of the hypothetical data set missing values replaced by mean imputation. ▴ Denotes mean imputed data point.
Scatterplot of the hypothetical data set missing values replaced by regression imputation. ▴ Denotes regression imputed data point.
When the deletion technique was used, there was a slight increase in the mean and reduction in variance, as compared to the known parameters (Table 2). The mean obtained from the deletion data set was then used for the mean imputation approach. Unsurprisingly, this resulted in the mean remaining the same as for the deletion technique, with a further decrease in variance (Table 2). A bivariate regression analysis was conducted using the IP Speed scores and the COWAT scores from the hypothetical missing data set (Table 2), with the resulting regression equation being used to imputate the missing COWAT values (see footnote Table 2). The regression imputation mean was closer to the true mean than either the deletion or mean imputation technique. However, while the variance was slightly more accurate than variance obtained by mean imputation, it was not as close to the observed SD as when the deletion technique was employed.
MI was then conducted, using IP Speed and COWAT scores in the missing data set. Although it has been recommended that at least 20 imputations be used in most situations (Graham et al., Reference Graham, Olchowski and Gilreath2007), for the purpose of demonstration a total of five imputations were performed (Table 3). In order to increase independence of each imputation, the number of iterations between each imputation was increased from the SPSS default setting of 10 to 200, consistent with Baraldi and Enders’ demonstration (Reference Baraldi and Enders2010). As is evident in Table 3, each imputation generates different values for a given missing score, thus creating differing means and standard errors (SE). The mean and standard error are pooled for the final analysis. When comparing the pooled mean and standard error to the complete data set, it is apparent that MI has yielded both a mean and variance very similar to the known parameter estimates, and is closer on both measures than the deletion or single imputation techniques.
Comparison of Means and Standard Deviations (SDs) for Complete Data Set, and Hypothetical Missing Data Sets Employing Multiple Imputation Techniques
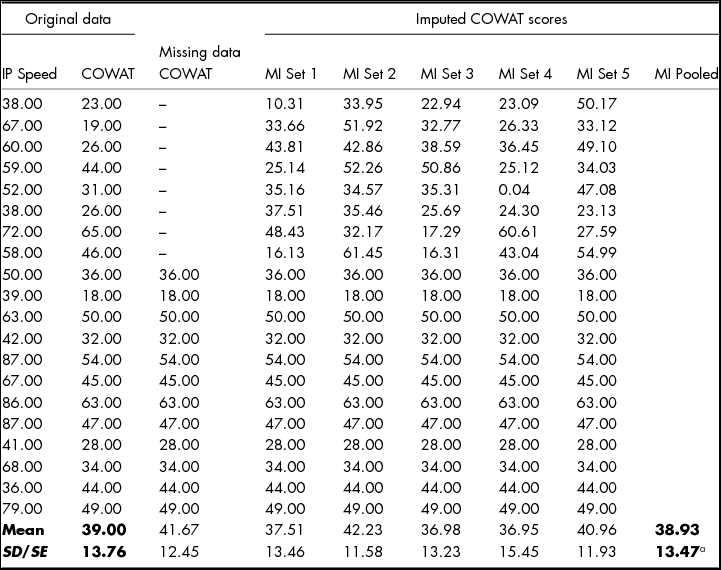
aAs SPSS does not pool SE this was calculated manually using the formula provided in Baraldi & Enders (Reference Baraldi and Enders2010).
Discussion
In the current study, a random sample of 20 cases was drawn from a clinical research study to compare the means and variance obtained from a complete data set to an identical data set, except with missing values. As demonstrated, MI yielded parameter estimates closer to the known estimates than any of the traditional missing data approaches. Each of the deletion and single imputation procedures was limited in its capacity to reflect the complete sample parameters, yielding means and/or variance estimates that were markedly different to the original data set. In contrast, MI was found to provide both a mean and standard error that was close to identical to the known values, and therefore outperformed the deletion or single imputation approaches.
This finding provides similar results to Baraldi and Enders (Reference Baraldi and Enders2010), who used a hypothetical data set to compare missing data techniques. Indeed, when considering the traditional approaches, in both studies the regression imputation yielded the closest mean, and deletion yielded the closest standard deviation when compared to the complete data sets. An advantage of the current study was that the parameter estimates obtained by each missing data technique were able to be compared to the known parameters of a complete data set which has been obtained in the clinical setting, thus indicating that missing data techniques such as MI can be applied in this context.
While the above results indicate that MI is an effective method for addressing missing data, it must be acknowledged that the problems associated with missing data cannot be entirely ameliorated by any missing data techniques. MI and other new missing data procedures are useful for data that is MCAR or MAR; however, they are less reliable when data is MNAR. Unfortunately, although there are methods to determine if data is MCAR (see Enders, Reference Enders2010), it is not possible to determine whether data is MAR and MNAR, and to date there is no effective technique for addressing data that is MNAR (Enders, Reference Enders2010; Graham, Reference Graham2012). Nevertheless, MI has been found to work relatively well in the MNAR setting (Enders, Reference Enders2011), and may remain a better alternative than traditional approaches, or even techniques specifically designed to deal with data that is MNAR, as techniques designed for MNAR data rely on untestable and stringent assumptions (Enders, Reference Enders2010; McKnight et al., Reference McKnight, McKnight, Sidani and Figueredo2007; Schafer & Graham, Reference Schafer and Graham2002). However, where there are strong violations of the MAR assumption, use of MI or other modern techniques may be questionable.
It should also be noted that even where missingness is MCAR or MAR, MI may not be the most appropriate approach. McKnight and colleagues (Reference McKnight, McKnight, Sidani and Figueredo2007) state that small sample sizes may reduce the reliability of MI; however, others have suggested that this likely to be a reflection of the inherent limitations of small samples, rather than inefficiency of MI per se (Graham, Reference Graham2009; Graham & Schafer, Reference Graham, Schafer and Hoyle1999). Using standard MI in some longitudinal designs and with multilevel data may also be problematic, requiring either the use of an MI algorithm other than data augmentation, or the use of a technique other than MI (Enders, Reference Enders2010, Reference Enders2011; Graham, Reference Graham2012).
A further limitation is that statistical packages still vary in terms of ease of use, especially in relation to pooling parameters and test statistics. Given recent advances, and increased use of modern missing data approaches, it is likely that techniques such as MI will become better integrated into many software packages in the near future. Nevertheless, it is important to be aware of the capacity of a given program with regard to MI prior to commencing analysis.
An issue not often addressed in the literature to date is the proportion of data missing from a data set that can be reliably replaced when employing missing data techniques such as MI. McKnight et al. (Reference McKnight, McKnight, Sidani and Figueredo2007) observe that any such guideline would be arbitrary, and would also depend on the nature of the research. However, it may be advantageous to clarify whether there is a proportion of missingness at which the efficacy of MI is reduced, and whether there are any considerations specific to applying MI in the clinical research setting, as have been observed for other statistical techniques (Proust-Lima, Dartigues, & Jacqmin-Gadda, Reference Proust-Lima, Dartigues and Jacqmin-Gadda2011). Furthermore, given that clinical researchers may have little experience with such techniques, some provisional guidelines may foster confidence and encourage greater utilisation of these approaches.
It is hoped that by providing this comparison of the various missing data techniques, the benefit of utilising MI in the clinical setting is apparent. It should also be clear that regardless of whether missing data is actively dealt with, it is important to have a sound understanding of the nature and impact of missing data. Ideally, while modern missing data approaches can address missingness on a post hoc basis, it is suggested that consideration should be given to the possible factors that may contribute to missing data prior to commencement of research. Any factors that are likely to influence missingness can then be measured, allowing more rigorous analysis. That being said, Graham (Reference Graham2012) states that while it is useful to include and understand the key causes of missing data, it is not necessary to include all variables contributing to missing data for MI to be effective. Finally, whilst beyond the scope of this paper, it should be noted that understanding the nature of missing data can also allow more effective research, both in terms of analysis and in creating cost-effective studies by utilising a planned missingness design (for further explanation, see Enders, Reference Enders2010 and Graham, Reference Graham2012).
In conclusion, the nature and detrimental impact of missing data, and the associated limitations of traditional methods of dealing with missingness, are often not fully appreciated. The above findings indicate that modern missing data approaches, such as MI, outperform traditional approaches by re-introducing the variance that was likely to have occurred should missing scores have been obtained. This minimises the amount of bias caused by missing data, and increases the power to detect meaningful effects. MI and other approaches are now readily available in many statistical software programs, and are relatively fast and straightforward to use. While some additional effort may be required to learn new techniques such as MI, it is suggested that the long-term benefits make learning these techniques worthwhile, and it is hoped that approaches such as MI will be conducted routinely in the clinical research setting.
Financial Support
This research received no specific grant from any funding agency, commercial or not-for-profit sectors.
Declaration of Interest
M.J.S. reports honoraria from Eli Lilly (Australia) Pty Ltd and grants from Novotech Pty Ltd, outside the submitted work.