A now extensive body of research has shown that children's production accuracy depends on statistical patterns in the child's native language (Edwards, Beckman & Munson, Reference Edwards, Beckman and Munson2004; Messer, Reference Messer1967; Munson, Reference Munson2001; Storkel, Reference Storkel2001; Zamuner, Gerken & Hammond, Reference Zamuner, Gerken and Hammond2004). Consider phonotactic probability, or the frequency of a sound sequence within a language. Studies of nonword repetition detail how phonotactic probabilities can predict production accuracy. For example, Munson (Reference Munson2001) asked two groups of children (younger group mean age=3 ; 10, older group=8 ; 4) to produce a series of CVCCVC nonsense words in which the probabilities of the word-medial two-consonant sequences varied (hereafter sequences).Footnote 1 Both groups were faster, more accurate and less variable in their productions of sequences like /st/ that occur frequently in English compared with their productions of sequences like /fp/ that occur infrequently or not at all. More generally, the findings reflect a positive correlation between phonotactic frequency and production accuracy. Note that in this article we treat phonotactics as gradient in nature as per work by Coleman & Pierrehumbert (Reference Coleman and Pierrehumbert1997), Bailey & Hahn (Reference Bailey and Hahn2001) and others. For evidence that phonotactics also behave categorically, see Coetzee (Reference Coetzee2008) and Kenstowicz (Reference Kenstowicz1994).
Why might child speech accuracy reflect phonotactic probabilities? Seeking an explanation for these effects, Edwards et al. (Reference Edwards, Beckman and Munson2004) examined the relationship between children's accuracy and the size of their lexicons. The authors asked children (N=104, age range=3 ; 2–8 ; 10) to produce a set of nonwords containing target phonotactic sequences of varying probabilities. Edwards et al. also collected several measures of the children's vocabulary development. In addition to finding that sequences with higher phonotactic probabilities were produced more accurately than sequences with lower probabilities, the authors found that vocabulary size correlated with production accuracy, and when age and measures of intelligence were held constant, children with larger vocabularies were more accurate in their productions than children with smaller vocabularies. The authors concluded that the correlation between speech accuracy and lexicon size can be explained if phonotactic probabilities (and phonological knowledge, in general, cf. Pierrehumbert, Reference Pierrehumbert, Bod, Hay and Jannedy2003; Hoff, Core & Bridges, Reference Hoff, Core and Bridges2008) are the result of generalizations made over the words in the lexicon; that is, generalizations made over lexical types.
Despite the widespread opinion that phonotactics are probabilistic, and Edwards et al.'s evidence that these probabilities can be learned as generalizations over lexical types, there are many questions that remain unanswered. In particular, little has been said about the number of distinct encounters with a word, or lexical tokens, that children or adults must experience in order to demonstrate phonotactic effects on production accuracy. One noteworthy quality of lexical tokens is that they may be produced by multiple talkers, allowing a child to store multiple unique talker-tokens of a word (Goldinger, Reference Goldinger1998).
Recently, researchers have started to compare the relative influences of lexical types and lexical tokens on phonotactic learning. This work harnesses the connection between phonotactic probabilities and child speech accuracy by using experimentally defined, artificial probabilities to modulate speech accuracy. During an initial familiarization phase, children are exposed to some phonotactic sequences more than others, creating phonotactic frequencies within the experiment. In a subsequent test phase, children produce the target sequences in a nonword repetition task. What effect might the experimental frequency manipulation have? Past research shows that high English frequency sequences are produced more accurately by children learning English, so this paradigm makes a similar assumption: Experimentally high frequency sequences should be produced more accurately than baseline or experimentally low frequency sequences. The effect of experimental frequency on children's production accuracy can then be used to assess the effectiveness of the familiarization statistics.
For example, Richtsmeier, Gerken, Goffman & Hogan (Reference Richtsmeier, Gerken, Goffman and Hogan2009) familiarized four-year-olds with CVCCVC nonwords (e.g. /mæstəm/ and /mæfpəm/), but varied the words' experimental frequency – children heard ten tokens of half of the words and one token of the other words. Following familiarization, children were asked to produce all of the words in a nonword repetition task. Children were faster and more accurate for a word they heard ten times during familiarization, but only if they heard ten different talkers producing that word; if children heard the same talker produce the word (ten identical acoustic tokens), experimental frequency did not affect speed or accuracy. In other words, the variability inherent to different talker-tokens appeared to facilitate children's speech accuracy. The findings show how lexical tokens, and talker-tokens in particular, can create frequency effects within an experiment. However, the data may not necessarily relate to the connection between phonotactic probabilities and child speech accuracy. The authors familiarized and tested children with the same words, so children may not have learned anything about the words' internal structure. The study therefore did not distinguish between lexical learning and phonotactic learning.
In a follow-up study, Richtsmeier, Gerken & Ohala (Reference Richtsmeier, Gerken, Ohala, Chandlee, Franchini, Lord and Rheiner2009) familiarized children with one set of words and then tested their production accuracy on a related word set. In the first experiment, experimental frequency was a manipulation of whether children were familiarized with either ten or one talker-tokens of the familiarization words (e.g. /mæstəm/ and /mæfpəm/). During the test, children were asked to produce unfamiliar words with the same medial sequences (/neIstən/ and /neIfpən/). The experimental frequency manipulation had no effect, however, suggesting lexical tokens do not allow for phonotactic learning.
In the second experiment, the number of familiarization words varied. Children heard either three different words containing a target sequence (e.g. /sʌfpət/, /lofpən/ and /gIfpək/) or just one word (e.g. /mæfpəm/) while each word was spoken by four different talkers. This time, children were more accurate when producing low English frequency sequences – like /fp/ in /neIfpən/ – when they were familiarized with three words containing those sequences. No change in accuracy was seen for high English frequency sequences, which the authors attribute to a ceiling effect. To sum up, children in the second experiment were more accurate when producing sequences that were supported by multiple lexical types as compared with sequences with weaker token support. More broadly, the results for the low English frequency sequences match the pattern we see with respect to ambient language phonotactics.
Richtsmeier, Gerken & Ohala's (Reference Richtsmeier, Gerken, Ohala, Chandlee, Franchini, Lord and Rheiner2009) results provide a plausible explanation for the connection between phonotactic probabilities and child speech accuracy (e.g. Edwards et al., Reference Edwards, Beckman and Munson2004). As children store words, they are able to generalize about the words' internal structures and apply that knowledge in unfamiliar situations, such as the production of novel words. This is essentially the proposal made by Edwards et al. (Reference Edwards, Beckman and Munson2004). These findings further suggest that type frequency is the primary ambient-language factor responsible for changes in accuracy because, in the first experiment, no effect of token frequency was found.
The results do not rule out a role for lexical tokens, however, particularly in combination with the variability in multiple talker-tokens, or talker variability. The type frequency manipulation used by Richtsmeier, Gerken & Ohala (Reference Richtsmeier, Gerken, Ohala, Chandlee, Franchini, Lord and Rheiner2009) was accompanied by talker variability for each word, and that may have facilitated the generalization effect in their second experiment. Such a claim has some support, including the effect of familiarization with ten talkers versus one talker (Richtsmeier, Gerken, Goffman & Hogan, Reference Richtsmeier, Gerken, Goffman and Hogan2009). Additionally, studies of infant word learning suggest that familiarization with phonetically variable tokens of a word can result in robust word learning (variable talkers in Houston (Reference Houston2000) and variable affective qualities in Singh (Reference Singh2008) ). Consistent with the idea that multiple tokens are important for learning, Pierrehumbert (Reference Pierrehumbert, Bod, Hay and Jannedy2003) proposes that phonetically diverse word exemplars facilitate the formation of abstract word representations, which in turn facilitate the formation of phonological representations such as phonotactic probabilities. In sum, to gain a better understanding of the relationship between child speech accuracy and native language statistics, a comprehensive comparison of lexical types and lexical tokens is needed.
To this end, we conducted a series of three experiments to contrast the effects of lexical types and tokens in phonotactic learning. Four-year-old children were familiarized with word-medial consonant sequences whose probabilities were manipulated via experimental frequency. Children were then tested in a nonword repetition task where they produced new words containing the same medial sequences.
Across the experiments, types and tokens were manipulated systematically as a function of their experimental frequency. We operationalized types as the names of make-believe animals sharing a word-medial consonant sequence. We operationalized tokens as talker-specific productions of a word, or talker-tokens.
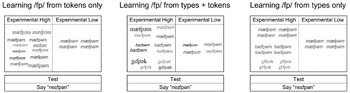
Experimental frequency in the first experiment emphasized talker variability and was a manipulation of talker-tokens only: children heard either four or twelve talker-tokens of the target sequences in single words. In the second experiment, experimental frequency included word-types and word-tokens: children were familiarized with either one or three words containing a target sequence, but all words were spoken by four different talkers. Finally, experimental frequency in the third experiment was exclusively a manipulation of type frequency: children were familiarized with either one or three words containing a target sequence, but each word was spoken by a single talker. A visual representation of these manipulations, as applied to the sequence /fp/, is given in Figure 1.
A graphical representation of the experimental frequency conditions across the three experiments. Words are presented in phonetic form. Differences in font, shade and size represent different talker-tokens. ExpHi and ExpLo refer to experimental frequency conditions within each experiment. The conditions are illustrated for the /fp/ sequence but are indicative of the conditions for all sequences under investigation.

To the extent possible, we held other frequencies constant. For example, setting aside talkers, the total number of familiarization tokens was held constant across experiments. The total number of familiarization talkers was also similar across experiments. Where differences among the experiments exist, they are noted and evaluated for their potential impact on the results. Factors which we were unable to control are covered in the ‘General discussion’.
EXPERIMENT 1
METHOD
Participants
Twenty-one children between the ages of 4 ; 0 and 4 ; 3 (M=4 ; 1.6) participated in Experiment 1. Children for all three experiments were recruited using a database of local birth announcements and adoptions in the Tucson metropolitan area. All children were reported to be native English speakers and had minimal exposure to other languages. Excluded from the study were children who were reported to have had a personal or family history of early intervention services, ear infections in the month prior to their participation, congenital hearing loss, congenital language delay, or speech or language therapy. Five participants were removed from the analysis because they did not complete the experiment, and one child was removed due to experimenter error. The remaining sixteen participants (eight girls) were included in the analysis. Note that although this experiment and Experiment 2 are highly similar to the experiments described by Richtsmeier, Gerken & Ohala (Reference Richtsmeier, Gerken, Ohala, Chandlee, Franchini, Lord and Rheiner2009), new words were created for this study, and the subject population is also new. Also note that we did not collect measures of articulatory ability, phonological memory or lexicon size for the participants in any of our experiments. It is therefore an interesting and open question whether performance in this type of experiment varies with one of those normative measures.
Materials
In this experiment, participants were familiarized with one set of words (familiarization words) and tested on a different but related set of words (test words). The familiarization and test word sets shared word-medial consonant sequences. Although the words are described in detail below, it should be kept in mind that the sequences that those words contain are the targets. Using consonant sequences as the learning targets allowed for comparisons with the results obtained by Munson (Reference Munson2001), Edwards et al. (Reference Edwards, Beckman and Munson2004), Richtsmeier, Gerken, Goffman & Hogan (Reference Richtsmeier, Gerken, Goffman and Hogan2009) and Richtsmeier, Gerken & Ohala (Reference Richtsmeier, Gerken, Ohala, Chandlee, Franchini, Lord and Rheiner2009). In fact, the sequences used in the studies presented here are a subset of the consonant sequences used by Munson (Reference Munson2001).
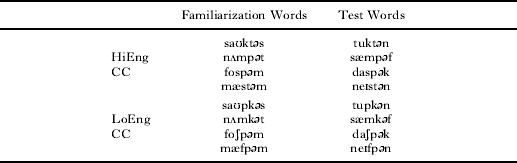
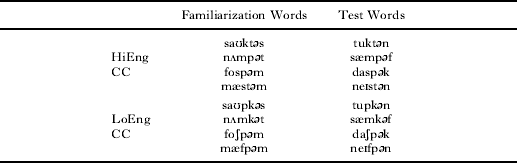
Eight pairs of CVCCVC nonsense words were created for the experiment and are given in Table 1. One member of the pair was assigned to the familiarization word set, the other member was assigned to the test word set. The familiarization words introduced the sequences; the test words were used in the production task to determine if children learned anything about the sequences during the familiarization. Nonsense words were used to ensure that the effects of the familiarization could be examined without the influence of factors such as word frequency, familiarity or imageability.
Familiarization and test words used in Experiment 1
English frequency
As shown in Table 1, the eight target sequences varied according to their frequency in English. The high English frequency sequences (HiEng) were /kt/, /mp/, /sp/ and /st/; the low English frequency sequences (LoEng) were /pk/, /mk/, /ʃp/ and /fp/. Words with HiEng and LoEng sequences were matched such that the same word frame was used for both a HiEng and a LoEng sequence. For example, the frame /mæ əm/ was combined with the HiEng sequence /st/ and the LoEng sequence /fp/ to create the words /mæstəm/ and /mæfpəm/.
The online Phonotactic Probability Calculator (Vitevitch & Luce, Reference Vitevitch and Luce2004) was used to determine the phonotactic probabilities of the sequences. Biphone probabilities, such as of two-consonant sequences, were the quotient of the log10 of the total number of words in the language that contain the biphone over the log10 of the total number of words in the database. The biphone probabilities of the sequences used in this experiment are given in Table 2. The Phonotactic Probability Calculator calculates phonotactics with respect to word boundaries, but not syllable structure or stress. Therefore, the probabilities in Table 2 are the likelihood of the sequence appearing somewhere in the middle of a word. For example, /st/ is the most frequent sequence and has a probability of 0·0232 of occurring word-medially, whereas /ʃp/ and /fp/ never occurred in the corpus and have probabilities of 0·0. Although /ʃp/ and /fp/ do not occur within English words, previous research has shown that children's accuracy for these sequences is similar to their accuracy for /pk/ and /mk/ (Richtsmeier, Gerken, Goffman & Hogan, Reference Richtsmeier, Gerken, Goffman and Hogan2009).
Biphone probabilities for the eight sequences used in Experiment 1

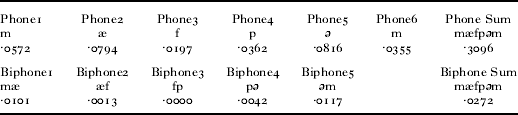
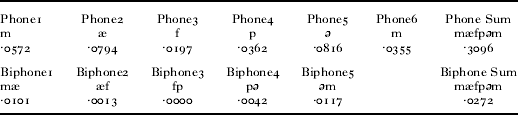
Additionally, the partial- and whole-word phonotactics of the familiarization and test words were calculated. As an example, the individual phone and biphone probabilities for the familiarization word /mæfpəm/ are given in Table 3. Phone1–Phone6 correspond to the phonotactic probability scores for the six component phonemes; Biphone1–Biphone5 correspond to the scores for the five component biphones. ‘Phone sum’ and ‘Biphone sum’ are the sums of these scores over the entire word. We balanced scores across the familiarization and test word sets to ensure that the two lists had equivalent partial- and whole-word phonotactics. ANOVAs were conducted with the phones, biphones and sums as dependent variables; set and English frequency as factors. The analyses uncovered no effects of set (all Fs<1·5), nor any significant interactions of set and English frequency (all Fs<1). Thus, the familiarization and test words were well balanced for their phonotactic properties.
Individual phone and biphone scores, as well the phone and biphone sums, for the familiarization word /mæfpəm/
It should be noted that the English frequency factor was not of primary interest. The English frequency factor was included largely as a control and as a way to compare the results to previous studies. The central research question was how children's production accuracy would be affected by the experimental frequency factor, which is discussed next.
Experimental frequency – tokens only
In addition to manipulating the frequency of sequences as they occurred in English, the frequency that children heard them in the experiment was also manipulated, referred to hereafter as experimental frequency. During the familiarization phase of Experiment 1, children heard the high experimental frequency sequences (ExpHi) in a familiarization word spoken by twelve different talkers. Children heard the low experimental frequency sequences (ExpLo) in a familiarization word spoken by just four talkers (cf. Figure 1). Only the experimental frequencies of the familiarization words were manipulated, not the test words. Consequently, the target consonant sequences' frequencies also varied during the familiarization but not during the test. Children only heard one familiarization word per sequence, so experimental frequency in Experiment 1 is essentially a manipulation of talker variability, or a ‘tokens only’ manipulation.
All familiarization words (for all three experiments) were recorded by twelve women, all native speakers of American English with a Western United States accent. The use of a single gender follows from the finding that infants have greater difficulty recognizing known words spoken by talkers of a different gender than by talkers of the same gender (Houston, Reference Houston2000). The recordings were made in a sound attenuated booth using an Andrea anti-noise USB NC-7100 microphone. Recordings were made directly to an Apple iMac computer using Sound Studio software (www.freeverse.com/soundstudio/). Talkers were asked to produce several tokens of each word carefully and to provide clear cues for the component phones, particularly the two phones forming the medial sequence. For example, talkers were asked to release the first stop of the /pk/ sequence and aspirate the second stop of the /sp/ and /st/ sequences. Phonetically, stops following fricatives, as in the sequences [st] and [sp], are often unaspirated and therefore indistinguishable from voiced stops. We required talkers to produce aspirated stops following fricatives – although this is somewhat unnatural for English – to ensure maximum clarity for the component phones of the target sequences. The words were produced with stress on the first syllable, or trochaic stress. From these recordings, a single production of each word from each of the twelve speakers was chosen to serve as a familiarization token. The selected productions were extracted with 100 ms of silence on either side, and were normalized for root-mean-square amplitudes.
Experimental frequency status was assigned across two presentation lists. In each list, four words, or sequences, were assigned to the ExpHi condition (i.e. twelve talker-tokens were presented during the familiarization) and the other four were assigned to ExpLo (four talker-tokens were presented during familiarization). For List 1, the words /saʊktəs/, /nʌmpət/, /saʊpkəs/ and /nʌmkət/ were ExpHi; the words /fospəm/, /mæstəm/, /foʃpəm/ and /mæfpəm/ were ExpLo. The assignment was then reversed for List 2. For example, /saʊktəs/ was ExpHi in List 1 and ExpLo in List 2. A table showing the assignment of words to experimental frequency conditions and word-to-talker associations is given in the Appendix.
The words in each list were then split into two familiarization blocks with four words, that is, four target sequences, in each block. We used two blocks as a precautionary measure against straining children's attention spans and to split up presentation of words with the same frame, such as /saʊktəs/ and /saʊpkəs/. Familiarization blocking was balanced by reversing the order of the familiarization blocks to create two additional lists. Familiarization words presented in the first block in one list were presented in the second block in the reversed list. For example, in List 1A /saʊktəs/ was associated with twelve talkers and appeared in the first block, whereas /fospəm/ was associated with just four talkers and appeared in the second block. This list was reversed to create List 1B, in which /fospəm/ (still spoken by four talkers) appeared in the first block and /saʊktəs/ (still spoken by twelve talkers) appeared in the second block. Each child was presented with one of the four lists. The Appendix provides lists 1A and 2B.
Test words
The test words contained the same sequences present in the familiarization words. They were recorded at the same time as the familiarization words and using the same recording procedure; however, they were produced by a thirteenth talker. Productions of the test words from the thirteenth talker were also used for Experiments 2 and 3.
Neighborhood density
Phonotactic probability is highly correlated with neighborhood density, but the two factors have dissociable effects in various psycholinguistic tasks (Vitevitch & Luce, Reference Vitevitch and Luce1998; Bailey & Hahn, Reference Bailey and Hahn2001). Because the latter was of interest here, it was important to establish that neighborhood density did not vary across the familiarization and test sets or with respect to the English frequency factor.
Neighborhoods for the familiarization and test words were calculated using the Washington University Neighborhood Database (http://128.252.27.56/Neighborhood/Home.asp). None of the familiarization or test words had lexical neighbors with the exception of /nʌmpəs/, which has the neighbors ‘compass’ and ‘rumpus’. These neighbors are relatively low frequency (13 and 1 occurrences per million, respectively), so we did not anticipate that they would influence perception of /nʌmpəs/ compared with other familiarization words. As such, neighborhood density was equated across conditions and was not expected to affect the results.
Additionally, each familiarization word within a familiarization block began with a unique consonant–vowel sequence. That is, unique CV sequences were chosen for the onsets of the four words presented together. The purpose was to avoid online neighborhood effects (cf. Magnuson, Tanenhaus, Aslin & Dahan, Reference Magnuson, Tanenhaus, Aslin and Dahan2003) and provide maximal perceptual distinctiveness within the familiarization.
Procedure
Participants were brought in for a single experimental session. The experiment took place in a quiet, 10′×10′ room. Children sat at a child-sized table with the computer screen approximately 2′ away and with speakers on either side. Speaker volume was set to a comfortable level that was the same for all participants. Presentation of the experiment was controlled by Superlab 4.0 software (www.superlab.com) running on an Apple Macintosh G4. The experimenter sat next to the child and controlled the pace of the experiment from the laptop.
Before the experiment started, the experimenter explained to the child that he or she would play a game involving a series of ‘funny’ or ‘make-believe’ animals: Both the familiarization and test words were accompanied by a hand-drawn picture of a colorful make-believe animal (Ohala, Reference Ohala1999). In this and the following experiments, each familiarization and test word was associated with a unique animal.
The experiment itself comprised two blocks of ‘familiarization followed by testing’, or two experimental blocks. Each experimental block began with a familiarization, during which children were asked to ‘watch and listen’ to the familiarization words. Familiarization tokens for two ExpHi and two ExpLo words (corresponding to four of the eight total sequences) were presented in a random order determined by the Superlab software. Following the familiarization, children completed a test in which they were instructed to ‘say the next set of animal names back’. During testing, the four test words that contained the same sequences as the familiarization words were presented. Children produced these test words four times each in a random order over four test blocks, which ended the experimental block. No emphasis was placed on speed, but results from previous studies that used a similar procedure suggest that children generally repeat the words immediately (e.g. Richtsmeier, Gerken, Goffman & Hogan, Reference Richtsmeier, Gerken, Goffman and Hogan2009).
The experimenter proceeded through the experiment only when the child indicated her/his readiness. The child's parent or parents were in the experiment room or an adjacent room. They did not help the child with the experiment but occasionally interceded to encourage the child if she/he became unhappy or distracted. If at any time the child became overly uncomfortable or indicated an unwillingness to continue, the experiment stopped. When the experiment ended, the child received a small gift.
Each familiarization phase contained four familiarization words. Two of the four were presented twelve times (ExpHi) and two were presented four times (ExpLo), in a random order, for a total of thrity-two familiarization tokens per block. These presentation frequencies are matched to those of the second and third experiments.
ANALYSIS
Each child produced a maximum of four tokens of each sequence (i.e. each test word), once each for the four test blocks. An accuracy score was calculated for each production. The children's productions were transcribed and a score was tallied based on whether their production of the target sequence was entirely accurate (a score of ‘2’ for each consonant), whether one or more consonants was produced in error (a score of ‘1’ for each consonant in error, e.g. a distortion or a substitution), or whether a consonant was omitted (a score of ‘0’ for each omitted consonant). The maximum score for a correctly produced sequence was ‘4’.
A second transcriber independently transcribed all of the data, and discrepancies between the two transcription sets were eliminated in a second pass during which both transcribers listened to discrepant words. If they then agreed on a transcription, it was entered into the accuracy analysis so that 100% of the analyzed data was transcribed identically by two transcribers. If the transcribers were unable to agree on a transcription, the word was removed from the analysis. Less than 2% of the data was removed in this way with no more than three words removed per participant. Approximately 4% of the data was removed because children did not make a production or attempted the production twice.
Following previous research (cf. Richtsmeier, Gerken, Goffman & Hogan, Reference Richtsmeier, Gerken, Goffman and Hogan2009), we also collected measures of the latency from the offset of the target word to the onset of the child's production. For this and the following experiments, however, analyses of production latencies resulted in null results for all main effects and interactions. Because the measure was summarily uninformative, we do not report it here. See work by Munson, Swenson & Manthei (Reference Munson, Swenson and Manthei2005) for further discussion of child production latencies.
RESULTS AND DISCUSSION
The results were collapsed across repetitions, words and sequences to create a unique datapoint for each of the four conditions (HiEng+ExpHi, HiEng+ExpLo, LoEng+ExpHi, LoEng+ExpLo) for each participant. Following the results presented by Richtsmeier, Gerken & Ohala (Reference Richtsmeier, Gerken, Ohala, Chandlee, Franchini, Lord and Rheiner2009), we anticipated a ceiling effect for the high frequency sequences and a skewed distribution of accuracy scores. We also note that accuracy was scored on an ordinal scale (0–4; cf. Agresti (Reference Agresti2007) for relevance to the choice of statistical test), and we expected children's scores to be related across trials. The data therefore violate several assumptions of the General Linear Model, including ANOVA. Taking these concerns into account, we analyzed the data using a multilevel multinomial logistic regression (cf. Snujders & Bosker, Reference Snujders and Bosker1999) using Mplus software, version 5.2 (www.statmodel.com/).
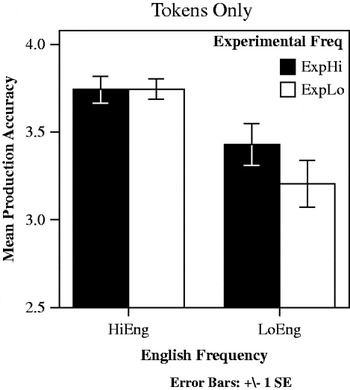
English frequency and experimental frequency (modeled as binary variables), and their interaction (modeled as a continuous variable to allow the model to converge) predicted accuracy, with slopes allowed to randomly vary across participants. Thresholds, similar to intercepts, for accuracy also varied randomly across participants. Results for the accuracy analysis (M=3·53, SD=0·46) indicated that English frequency significantly predicted accuracy (β=2·03, p<0·001); HiEng words were produced more accurately than LoEng words. Experimental frequency was not significant (β=0·69, p>0·05), and there was not a significant interaction (β=0·20, p>0·05).Footnote 2 The English frequency effect held for the individual data from fourteen of the sixteen participants, indicating that this result was generally true of the population. Figure 2 provides graphs of the results.
Bar graphs of the accuracy results from Experiment 1 – tokens only familiarization. On the ordinate is the mean production accuracy for the medial consonant sequences, with a score of ‘4’ being accurate production of both consonants. The bars are shaded according to experimental frequency. Black bars represent the average accuracy for the ExpHi sequences; white bars represent the ExpLo sequences. Bars are grouped by English Frequency. Results for the HiEng sequences are on the left; results for the LoEng sequences are on the right.

Corroborating numerous past studies (Beckman & Edwards, Reference Beckman, Edwards, Broe and Pierrehumbert1999; Edwards et al., Reference Edwards, Beckman and Munson2004; Munson, Reference Munson2001; Zamuner et al., Reference Zamuner, Gerken and Hammond2004), children in Experiment 1 produced consonant sequences with high phonotactic probabilities more accurately than sequences with low probabilities. However, children's productions were not significantly influenced by a manipulation of experimental frequency. That is, children were not more accurate for having heard sequences in a related word spoken by twelve different talkers. Richtsmeier, Gerken & Ohala (Reference Richtsmeier, Gerken, Ohala, Chandlee, Franchini, Lord and Rheiner2009) also found a null effect of token variability using a different word set, so the present null result is consistent with prior research and the possibility that children were unable to learn the sequences from token frequency alone.
To test whether token frequency combined with type frequency or type frequency alone would allow children to generalize the target sequences, two additional experiments were conducted in which experimental frequency varied the number of familiarization words containing a target sequence. In Experiment 2, this type frequency manipulation was combined with token variability, and each familiarization word was heard spoken by four different talkers.
EXPERIMENT 2
METHOD
Participants
Twenty-one children between 4 ; 0 and 4 ; 3 (M=4 ; 1·3) were recruited with the same database used for Experiment 1. All children were native English speakers, had minimal exposure to other languages and were reported by their parents to have normal speech, language and hearing development. Five children were removed from the analysis because they did not complete the experiment or did not follow instructions. Results from the remaining sixteen participants (nine girls) are reported below.
Materials
As in Experiment 1, the targets were word-medial consonant sequences in CVCCVC nonsense words. The words varied according to the same two factors, English frequency and experimental frequency. English frequency was again a manipulation of the ambient language frequency of the medial sequence; experimental frequency was again a manipulation of the number of times that a sequence occurred in the familiarization. However, type frequency, in the form of two new words per sequence, or three total words per sequence, was added to the ExpHi condition of the experimental frequency factor. The ExpLo familiarization words and the test words were identical to the words used in Experiment 1.
Familiarization words
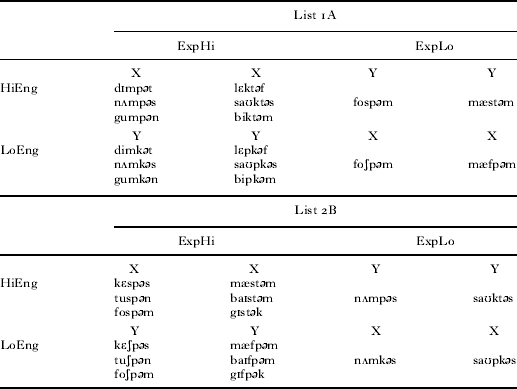
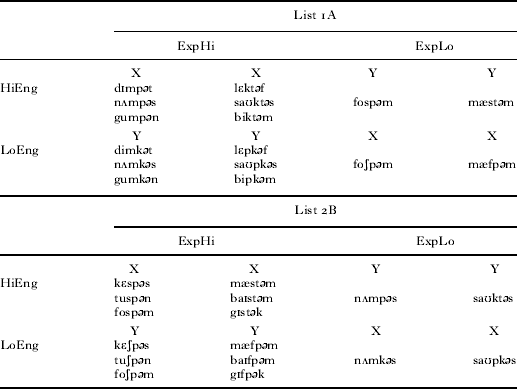
The familiarization word lists are given in Table 4. All three words for each sequence appeared in the ExpHi condition; just one word per sequence was used for the ExpLo condition (cf. the words from Experiment 1, Figure 1).
Familiarization words used in Experiments 2 and 3. Words in columns labeled X were presented in Block 1; words in columns labeled Y were presented in Block 2. Only Lists 1A and 2B are shown, but Lists 1B and 2A can be determined simply by flipping the Xs and Ys. Sequences were distributed across lists and blocks identically to Experiment 1
English frequency
The same eight consonant sequences from Experiment 1 were the learning targets. These sequences varied according to their English frequency, with half of the sequences occurring frequently in English and half occurring infrequently.
To ensure that the medial sequences comprised the most important differences between words, the Experiment 2 words were also balanced for their individual phones and biphones, as well as for their phone and biphone sums (cf. Table 3). The Phonotactic Probability Calculator (Vitevitch & Luce, Reference Vitevitch and Luce2004) was again used to tabulate the phone and biphone scores for each set (ExpLo, ExpHi and test). Scores for the ExpLo words containing a given sequence (e.g. /mæfpəm/ containing /fp/) were matched with the mean scores for the ExpHi words (e.g. means for /baIfpəm/, /gIfpək/ and /mæfpəm/), and with scores for the test words (e.g. /neIfpən/). Across multiple ANOVAs, no significant effects of the set variable were found (all Fs<1) for any score, nor was there any significant set×English frequency interaction (all Fs<1). The results confirm that the word sets were balanced with respect to English phonotactics.
Experimental frequency – types and tokens
ExpHi sequences were heard in three words, each spoken by four talkers. ExpLo sequences were only heard in a single word, also spoken by four talkers. Two lists were created: sequences were assigned to ExpHi in one word list and to ExpLo in a second list. Half of the participants heard a sequence as ExpHi and the other half heard it as ExpLo. The two word lists were split into two familiarization blocks, with two ExpHi and two ExpLo words in each block. The order of the blocks was reversed to create two new lists so that the sequences /kt/, /mp/, /ʃp/ and /fp/ were heard in Block 1 for one list and in Block 2 for the other list. Each child was presented one of the four lists.
As in Experiment 1, a different talker was used for each token of the familiarization words. Eight of the twelve talkers from Experiment 1 were used; four talkers were assigned to each familiarization word, and each talker was associated with four of the eight familiarization words in a block. This was fewer than the twelve talkers associated with the ExpHi words in Experiment 1, but allowed us to equate the total number of familiarization talkers in Experiments 2 and 3. See Figure 1 and the Appendix for a comparison of talker assignment across experiments.
Neighborhood density
Neighborhoods for the word sets were calculated in the same way as for Experiment 1 and with the same results. No words had neighborhoods except for /nʌmpəs/. Note, too, that all words within a familiarization block began with a unique CV sequence.
Test words
The same test words used in Experiment 1 were used here (cf. Table 1).
Procedure
The procedure was the same as in Experiment 1. In terms of presentation statistics, children heard a total of thirty-two familiarization tokens per block (two ExpHi sequences×three words×four talker-tokens=twenty-four tokens, two ExpLo sequences×one word×four talker-tokens=eight tokens), which is equivalent to the presentation token count in Experiment 1. During the test phase, four repetitions of each test word were collected across four randomized test blocks, which also matched Experiment 1.
ANALYSIS
Accuracy on the two medial consonants was again used as the dependent measure. Transcriptions were made by two data coders working independently. Inconsistencies between the transcribers were either resolved by consensus or were removed from the analysis. Less than 2% of the data was removed due to a lack of agreement, and never more than three words were removed per participant. Approximately 6% of the data was removed because children did not attempt to produce the word or attempted the production twice.
RESULTS AND DISCUSSION
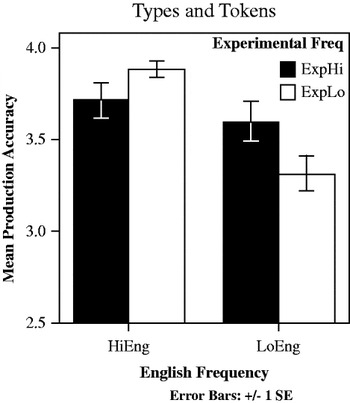
As in Experiment 1, a multinomial multilevel logistic regression was used for the analysis of children's production accuracy (M=3·63, SD=0·42). English frequency and experimental frequency predicted accuracy as binary variables, and their interaction predicted accuracy as a continuous variable. Thresholds for the outcome and all slopes were allowed to randomly vary across individuals. As expected, English frequency significantly predicted accuracy (β=2·79, p<0·001), resulting from greater accuracy scores for HiEng words compared with LoEng words. The effect held for fourteen of sixteen participants. There was a main effect of experimental frequency (β=1·49, p<0·05), but the English frequency×experimental frequency interaction was also significant (β=−1·77, p<0·01). Probing this interaction revealed a positive effect for experimental frequency for LoEng sequences (β=1·49, p<0·05), but not for HiEng sequences (β=−0·28, p>0·05). The significant effect of experimental frequency for LoEng sequences held for the individual data from eleven of the sixteen participants. In other words, accuracy was significantly higher for LoEng sequences when they appeared in three familiarization words, each spoken by multiple talkers.Footnote 3Figure 3 presents a graph of the results.
Accuracy results from Experiment 2 – types and tokens familiarization. The bars are shaded according to experimental frequency and grouped by English frequency.

As expected, children were again more accurate when producing consonant sequences with high phonotactic probabilities (HiEng>LoEng). Unlike Experiment 1, however, children's productions in Experiment 2 were also influenced by experimental frequency. Specifically, children were more accurate at producing the LoEng sequences when they were familiarized with three words containing those sequences (LoEng+ExpHi>LoEng+ExpLo).
The results suggest that children were able to learn LoEng sequences during the perceptual familiarization and generalize them to the production of new words. Thus, the LoEng sequences provide evidence that type frequency facilitates phonotactic generalization. The fact that experimental frequency was not significant for the HiEng sequences is most readily attributable to the anticipated ceiling effect, so it remains to be seen whether similar facilitation of type frequency for HiEng sequences would be found under differing conditions (e.g. with younger children).
The results from Experiments 1 and 2 parallel the results from Richtsmeier, Gerken & Ohala (Reference Richtsmeier, Gerken, Ohala, Chandlee, Franchini, Lord and Rheiner2009) and suggest that token variability does not facilitate phonotactic learning without the presence of multiple word-types. To determine whether type frequency alone would allow children to make a productive generalization, we conducted a third experiment in which type frequency was manipulated without token variability.
EXPERIMENT 3
METHOD
Participants
Twenty children aged 4 ; 0 to 4 ; 3 (M=4 ; 0·27) were recruited with the same database used for the previous experiments. All children were native English speakers, had minimal exposure to other languages and were reported by their parents to have normal speech, language and hearing development. Four children were removed from the analysis due to inattention to the directions or for not completing the experiment. The results reported below are for the remaining sixteen participants (eight girls).
Materials
The words used for Experiment 3 were identical to those used in Experiment 2.
Experimental frequency – types only
Just like Experiment 2, ExpHi sequences in Experiment 3 occurred in three familiarization words, ExpLo sequences appeared in just one word. Unlike Experiment 2, the same talker-token was used for each of the four presentations of the familiarization words. That is, children heard each word produced by only one talker. To achieve this, a subset of the talker-tokens recorded for Experiment 2 was used for the Experiment 3 words: from the four different talker-tokens used in Experiment 2, a single talker-token was chosen and repeated four times. Another way to think of the manipulation is that Experiment 2 contained intra-word talker variability and Experiment 3 did not (cf. Figure 1).
Within a familiarization block, participants heard eight words (identical to Experiment 2), each spoken by a different talker, or eight total talkers. Thus, the total number of talkers appearing in Experiment 3, or talker variability, was equated to Experiment 2 and slightly less than the twelve talkers heard in Experiment 1. Note, however, that this meant ExpLo words were only produced by a single talker, compared with the four talkers that produced ExpLo words in Experiments 1 and 2.
Procedure
The procedure for Experiment 3 was identical to that used for the previous experiments. The presentation statistics were also identical to the other experiments: Children heard a total of thirty-two familiarization tokens per block (two ExpHi sequences×three words×four tokens=twenty-four tokens, two ExpLo sequences×one word×four tokens=eight tokens). The test phase was also matched to the previous experiments.
ANALYSIS
As before, two coders transcribed and scored each production independently, then worked together to eliminate inconsistencies. Disagreements accounted for less than 2% of the total data, and never more than three words were removed due to disagreement per participant. Approximately 5% of the data was removed because children attempted a production twice or did not attempt it at all.
RESULTS AND DISCUSSION
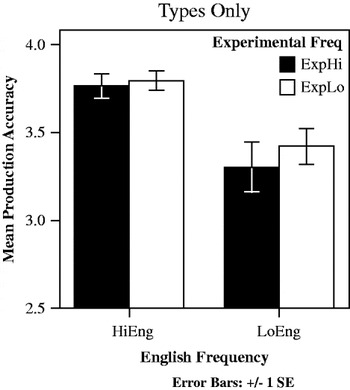
For the accuracy analysis (M=3·57, SD=0·44), averages for each subject for each of the four conditions were again entered into a multinomial multilevel logistic regression with English frequency, experimental frequency and their interaction as factors. English frequency significantly predicted accuracy (β=1·67, p<0·001). HiEng sequences were produced more accurately than LoEng sequences, and High English frequency multiplied the odds of a one-unit increase by e 1·45 4·26. The effect held for all sixteen participants. Experimental frequency (β=−0·28, p>0·05) and the English frequency×experimental frequency interaction (β=0·58, p>0·05) were not significant.Footnote 4 A graph of the results is given in Figure 4.
Accuracy results from Experiment 3 – types only familiarization. The bars are shaded according to experimental frequency and grouped by English frequency.

As expected, children were more accurate when producing HiEng versus LoEng sequences. However, children's productions in Experiment 3 were not significantly affected by experimental frequency. That is, children's production accuracy was not influenced by the manipulation of type frequency when each word was produced by a single talker. This result occurred even though the total number of talkers appearing in the familiarization was constant across Experiments 2 and 3.
Experiments 2 and 3 also differed in the number of words that a given talker produced within an experimental block (four of eight words in Experiment 2 and one of eight words in Experiment 3). It is difficult at present to determine how much this difference matters. In their types and tokens experiment, Richtsmeier, Gerken & Ohala (Reference Richtsmeier, Gerken, Ohala, Chandlee, Franchini, Lord and Rheiner2009) familiarized participants with stimuli in which each talker produced eight of eight words. The study yielded the same results as Experiment 2, presumably because both experiments included familiarization with multiple word-types spoken by multiple talkers. Thus, although Experiments 2 and 3 differed by how many words a given talker produced, we believe that the difference between Experiments 2 and 3 is best explained by the number of talkers producing each word, or within-word talker variability. See the Appendix for a table of the talker-tokens used in each experiment.
GENERAL DISCUSSION
The results from all three experiments combine to provide a picture of how word-types and word-tokens can come together to support phonotactic learning. In Experiment 1, children heard multiple talker-tokens of a single word for each sequence, but no generalization was found. In Experiment 3, children heard multiple words for each sequence and a single talker produced each word, but no generalization was found. Only in Experiment 2, where children heard sequences in multiple words spoken by multiple talkers, did they generalize the sequence to productions of new words. It appears, then, that the combination of talker variability and type frequency in Experiment 2 was most capable of supporting a productive phonotactic generalization. It is worth noting that there is not an explicit statistical test across experiments, so future research replicating these results will help to confirm our interpretation. However, Experiments 1 and 2 were highly similar to the experiments presented by Richtsmeier, Gerken & Ohala (Reference Richtsmeier, Gerken, Ohala, Chandlee, Franchini, Lord and Rheiner2009), who found equivalent effects of ‘tokens only’ and ‘types and tokens’ manipulations, suggesting that the cross-experiment results are robust.
With respect to child speech development, the results provide a new perspective on the correlation between production accuracy and phonotactic probabilities observed in previous research (Beckman & Edwards, Reference Beckman, Edwards, Broe and Pierrehumbert1999; Edwards et al., Reference Edwards, Beckman and Munson2004; Munson, Reference Munson2001). Generally, these studies show that children are most accurate when producing high probability phonotactic sequences. Additionally, Edwards et al. (Reference Edwards, Beckman and Munson2004) found that accuracy for the target phonotactic sequences also correlated with the size of the children's lexicons, and children with larger lexicons were generally more accurate than their age-matched peers. The authors suggest that the correlation between production accuracy and phonotactic probabilities, as well as the correlation between accuracy and lexicon size, follow from a model of phonology in which phonological structure is learned across related words. More specifically, children learn phonotactic sequences such as word-medial consonant sequences from multiple related words. Consequently, children with larger lexicons have more robust representations of those sequences.
The present results allow us to expand upon this proposal: using an artificial lexicon that contained both frequent and infrequent sequences, we created experiment-specific phonotactic probabilities. In Experiment 2, children produced the experimentally frequent sequences more accurately, at least for low English frequency sequences, when they were familiarized with multiple words containing those sequences spoken by multiple talkers. This trend held for eleven of the sixteen children in the experiment (about 70% of participants). Experiment 2 thereby simulates the phonotactic frequency effects previously shown for English and verifies the connection between words and phonotactic probabilities that Edwards et al. predicted.
The results from Experiment 2 also reveal how phonotactic generalizations are dependent on particular lexical statistics. That is, the ‘words’ that children used to learn phonological structure consisted of word-tokens (i.e. tokens with talker variability) and word-types (i.e. multiple words that share a phonotactic sequence). In other words, the correlations between production accuracy and phonotactic probabilities and between production accuracy and lexicon size that Edwards et al. observed are very likely the result of learning from both word-types and word-tokens.
The findings can also be interpreted as a natural consequence of the kinds of perceptual learning seen in the infant literature. For example, Jusczyk, Luce & Charles-Luce (Reference Jusczyk, Luce and Charles-Luce1994) showed that infants have learned language-specific phonotactic probabilities before their first birthday. The present results suggest that perceptual learning is not isolated to infants, but continues to be relevant as children begin to speak. This claim is also indirectly supported by work done by Boysson-Bardies and colleagues (e.g. Boysson-Bardies, Hallé, Sagart & Durand, Reference Boysson-Bardies, Hallé, Sagart and Durand1989), who showed a clear influence of ambient language patterns in babbling and children's first words. Given that perceptual learning affects speech production, it may be that perceptual targets represent an important component to speech and motor planning (Guenther, Reference Guenther2006). For discussion of how this type of experiment also relates to articulatory practice, see Richtsmeier, Gerken, Goffman & Hogan (Reference Richtsmeier, Gerken, Goffman and Hogan2009) and Richtsmeier, Gerken & Ohala (Reference Richtsmeier, Gerken, Ohala, Chandlee, Franchini, Lord and Rheiner2009).
From a theoretical perspective, what does it mean for children to be sensitive to both word-types and word-tokens? At present, we know of no theory or model of learning specific enough to account for the findings. The results are relevant to the general properties of several kinds of models, however. For example, exemplar models posit that words in the lexicon are collections of ‘episodic’ exemplars (Goldinger, Reference Goldinger1998), essentially word-tokens. Generally, these models do not refer to abstract entities such as word-types and therefore imply that lexical types are unnecessary for learning. Given that the total familiarization token count was equivalent across all three experiments (cf. the descriptions of each experiment's presentation statistics), and that phonetic variability was closely matched – twelve talkers in Experiment 1 and eight talkers in Experiments 2 and 3 – exemplar models seem to predict that the results should have been the same across all three experiments. The obtained results are to the contrary, particularly the difference between Experiments 1 and 2, suggesting that word-tokens are insufficient to explain the data. Thus, we argue that word types are both psychologically real and necessary for phonotactic learning.
Another class of models learn from purely abstract representations. These models learn from a lexicon composed of symbolic phonological features (e.g. Albright, Reference Albright2009) and do not refer to or predict a contribution of word-tokens to phonological learning. The difference in results between Experiments 2 and 3 and the apparent efficacy of intra-word talker variability suggest that this view is also incomplete, and that word-tokens do play a vital role in phonotactic learning.
A third perspective is that both word-types and word-tokens are necessary for phonotactic learning. We consider the most detailed picture of this type of learning to be the one proposed by Pierrehumbert (Reference Pierrehumbert, Bod, Hay and Jannedy2003). We follow her in arguing that phonotactic generalizations are abstractions over words and that abstract words are ‘abstractions over phonetic space’ (p. 179). Additionally, we hypothesize that high-level abstractions are dependent on lower-level abstractions, at least early on in development. In a sense, learning from talker-tokens is similar to learning from word-types: for each level of analysis, variability helps to signal invariance. At the phonetic level, talker variability signals an invariant word shape. At the phonological level, varying words signal an invariant phonotactic sequence. Additional discussion of the relevance of these types of experiments to learning models can be found in Richtsmeier (Reference Richtsmeier2008).
Two caveats are worth mentioning with respect to our conclusions. First, we acknowledge that we view the null effects of experimental frequency in Experiments 1 and 3 as evidence of limited learning from tokens and types in isolation, but interpreting null effects is always tenuous. Thus, we admit that future research is necessary to validate the present findings.
Second, various compromises were made in terms of equating frequencies across the experiments. For example, as a result of our effort to equate the total number of talkers heard during familiarization (twelve talkers in Experiment 1, eight talkers in Experiments 2 and 3), we were unable to balance the number of talkers producing single words or the total number of times a particular talker was heard. Furthermore, to hold the total number of presentation tokens constant across the experiments, we were unable to balance the total number of familiarization words across experiments (four words in Experiment 1, eight words in Experiments 2 and 3). We also note that talker-to-word associations were identical for all participants, which leaves open the unlikely possibility that the results reflect the particular talker-tokens that were used. However, to the best of our knowledge, none of these concerns correspond to an alternative explanation of the findings. They reflect imperfect experiments and compel us to future research, but they do not change our interpretation of the results.
Finally, we mention two potentially related areas of research. First, there is a wide body of evidence showing that knowledge of phonotactics influences word learning, not just the reverse (as was studied here). Work by Storkel and her colleagues (e.g. Storkel, Reference Storkel2001) has consistently shown that children are better able to learn words composed of high probability phonotactic sequences. From the perspective of infants, computational work by Adriaans & Kager (Reference Adriaans and Kager2010) suggests that infants may also use knowledge of phonotactics to discover words (see also experimental work by Saffran & Thiessen, Reference Saffran and Thiessen2003). We are not advocating a position whereby children learn the internal structures of words only after learning words, a viewpoint that is often attributed to Ferguson & Farwell (Reference Ferguson and Farwell1975). Rather, we follow Hoff et al. (Reference Hoff, Core and Bridges2008) in suggesting that word-to-phonotactic learning, such as that seen here, may occur in parallel to phonotactic-to-word learning, or that word-to-phonotactic learning may strengthen existing representations, particularly with respect to production.
Second, the present results are not meant as a complete explanation of performance in nonword repetition tasks (i.e. imitation tasks involving nonwords). For example, Gathercole (Reference Gathercole2006) claims that working memory, and the phonological loop in particular, explains why children become increasingly less accurate for words of greater length. Other work shows that children improve in the task as a result of articulatory practice, suggesting that motor learning influences nonword repetition performance (Sasisekaran, Smith, Sadagopan & Weber-Fox, Reference Sasisekaran, Smith, Sadagopan and Weber-Fox2009). Generally, nonword repetition tasks tap a variety of abilities including working memory, articulatory practice, perceptual acuity and lexicon size. We are open to the possibility that any of these factors might have varied across our participants, but we note that these factors were held constant with respect to the critical variable, experimental frequency, because each child participated in both the high and low experimental frequency conditions (ExpHi and ExpLo) of each experiment.
Therefore, we believe frequency manipulation effects within each experiment best explain the experimental frequency effects (or lack thereof). With respect to working memory, we propose that the children in our experiments learned about the representations that could be held in working memory, and the combination of lexical types and tokens from Experiment 2 resulted in the most robust learning of those representations. Future work may improve our understanding of how representations are formed and then manipulated in memory, as well as how learning from types and tokens relates to other abilities tapped in a nonword repetition task.
APPENDIX
The distribution of talker-tokens and word-types across experiments. Moving through the columns from right to left, the columns provide the talker-token assignments for each experiment, the words (by list) that those talkers were producing, the combination of English frequency and experimental frequency (Exper Freq) that the words correspond to, and then the experimental block. T1 through T12 represent the twelve different talkers who produced the familiarization words