


Introduction
The Sea of okhotsk, which is located at the Southern edge of the Sea-ice-covered region of the northern hemisphere, is Significantly affected by the interaction between the atmosphere and ocean (Reference InoueInoue and others, 2003; Reference Ohshima, Watanabe and NihashiOhshima and others, 2003). the thickness of Sea ice in the region is needed to Study Such interaction and associated processes Since the heat flux from Sea ice <0.4m thick is 10–100 times greater than that of the thicker ice types (Reference MaykutMaykut, 1978).
We previously Studied the backscattering characteristics of Sea ice and developed thickness-monitoring algorithms using Synthetic aperture radar (sar) on board japanese earth resources Satellite-1 (jers-1), european remote-sensing Satellite-1 (ers-1) (Reference Wakabayashi and NishioWakabayashi and nishio, 1996) and radarsat (Reference K., Nishio and WakabayashiNakamura and others, 2000, Reference Nakamura, Wakabayashi, Nishio and Uratsuka2002). in our recent work, we used multi-polarization Sar data acquired using the polarimetric and interferometric Sar (pi-sar) on board a gulfstream ii aircraft for the Sea of okhotsk. wakabayashi and others (2004) investigated the l-band polarimetric characteristics of Sea ice and found that the vv-to-hh backscattering ratio can be used to estimate ice thickness. nakamura and others (2005) extended the investigation to dual-frequency (l- and x-bands) Sar data. the ice thickness was estimated from pi-sar data using the experimental relationship between ice thickness and the backscattering ratio. with the launch of advanced Sar (asar) on board envisat, we now have dual-polarized Sar Satellite data. using polarization data from asar, we made use of the results of the Study of wakabayashi and others to develop an algorithm to estimate Sea-ice thickness. we also plan to apply Such an algorithm to multi-polarization Sar data taken by the advanced land observing Satellite (alos) and radarsat-2 on a routine basis in the near future. our ultimate objective is to develop an algorithm for retrieving ice thickness based on the different Surface-scattering characteristics of ice from different thicknesses.
The algorithm reported in this paper is based on the observed dependence of the backscattering ratio on ice Surface Salinity which in turn provides thickness information. the algorithm has been tested only on undeformed first-year ice and may not be applicable for other ice types. we validated the technique using near-coincident measurements of thickness from Ship and other methods and those inferred from envisat and pi-sar backscatters.
Test Sites
The test Sites (see fig. 1) for this Study were located in the Southern Sea of okhotsk and lake Saroma in northeast hokkaido, which are usually covered by Sea ice during winter. lake Saroma is a Salt-water lake connected to the Sea of okhotsk by two channels. its ice cover is Similar to the Sea ice in the Sea of okhotsk in terms of Salinity and Structure (Reference Nakamura, Wakabayashi, Nishio and UratsukaNakamura and others, 2002).
Test Site locations in the Sea of Okhotsk. (a) Test Site and Ship track. (b) Sea-ice concentration map on 9 February 2004 derived from the Advanced Microwave Scanning Radiometer for the Earth Observing System (AMsR-E) using the Bootstrap algorithm. The AMsR-E data were provided by the Us National Snow and Ice Data Center.
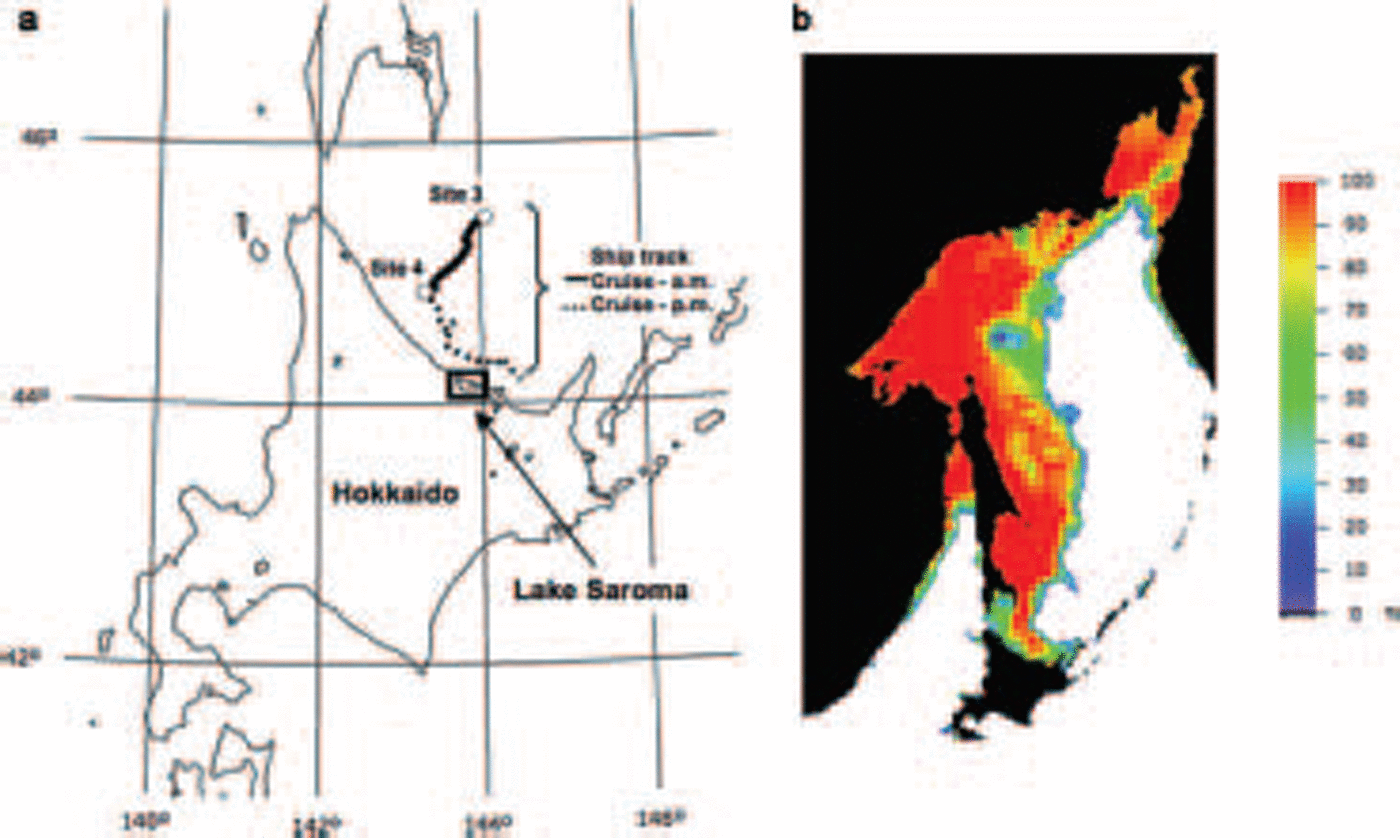
The physical properties of the Sea ice in the Sea of okhotsk were investigated from aboard an ice patrol vessel, the soya, operated by the japan coast guard. Since the Sea ice in the Sea of okhotsk drifts fairly quickly, it is very difficult to obtain time-series ground-truth data for a particular geo-location. therefore, to complement the ice-surface Salinity and thickness measurements, we carried out more detailed in Situ measurements in lake Saroma.
Data Acquisition
SAR data
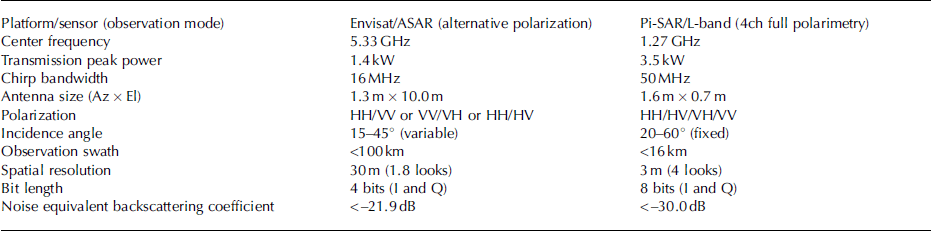
The european Space agency (esa) launched the c-band asar on board the envisat Satellite in 2002. the asar provides either like-polarization (hh and vv) or cross-polarization (hh and hv, or vv and vh) data depending on its polarization mode. it images one of Seven Swaths located over a range of incidence angles (15–45˚). near-simultaneous hh and vv images were acquired over our test Sites for the Standard Swath (swath no. is5: 66 km wide). we also acquired aircraft data from the pi-sar which was jointly developed by the japan aerospace exploration agency (jaxa) and the national institute of information and communications technology (NICT). this Sensor is capable of obtaining dual-frequency (x-and l-band) and multi-polarization data (Reference KobayashiKobayashi and others, 2000). the characteristics of asar and pi-sar are Summarized in table 1.
Characteristics of ASAR and Pi-SAR
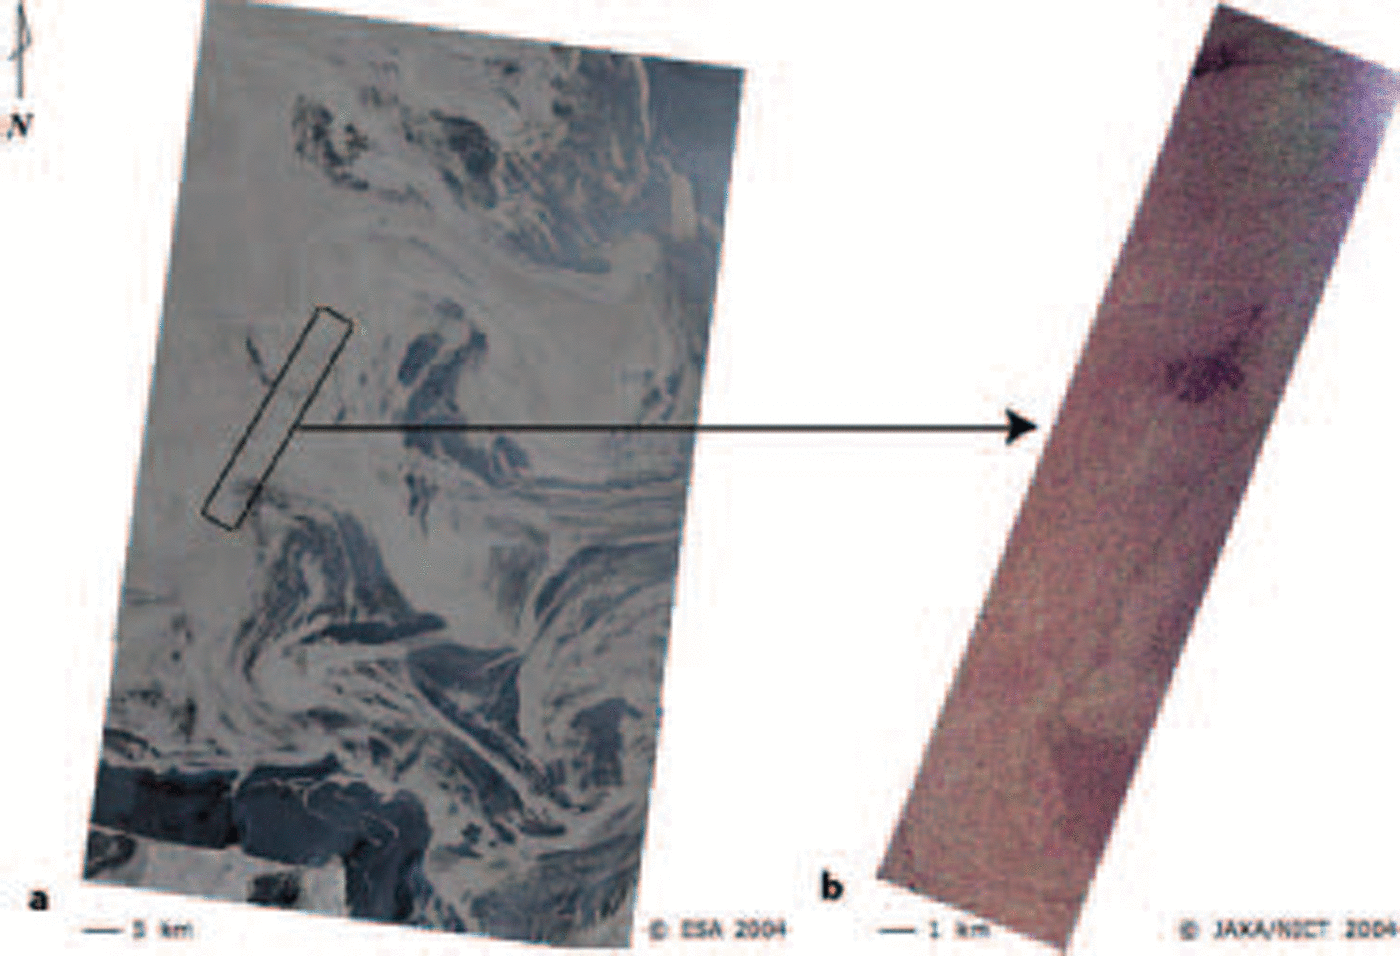
The envisat and pi-sar observations over our test Sites that were used in this Study were taken at 0929 and 1108 h japan Standard time (jst) on 9 february 2004. to enable us to compare the asar data with the ground-truth data, we applied a moving average filter with a window Size of 5 by 5 to the asar data. these Smoothed data were converted to backscattering coefficients using the absolute calibration coefficients provided by the esa for the asar data. a Similar procedure was used for the pi-SAR/l-band data and using the calibration coefficients provided by jaxa. the geometric registration accuracy in the transformation of the Sar images was within a pixel. examples of acquired images are Shown in figure 2. figure 2a Shows a red–green– blue (rgb) composite image of envisat as a color composite of hh, (hh+vv)/2 and vv polarizations, and figure 2b Shows that of pi-sar as a color composite of hh, hv and vv polarizations.
Examples of SAR images acquired for Sea of Okhotsk. (a) Envisat/ASAR composite image acquired for VV and HH polarization; HH, (HH+VV)/2 and VV were assigned to RGB. (b) Pi-SAR/L-band SAR composite image acquired for HH, HV and VV polarizations; HH, HV and VV were assigned to RGB.
Ground-truth data
We acquired ground-truth data in the Sea of okhotsk and lake Saroma Synchronously with the envisat and pi-sar observations. the Sea of okhotsk measurements were made offshore of mombetsu, and the lake Saroma measurements were made in the eastern part of the lake. Since the details are described elsewhere (Reference Nakamura, Wakabayashi, Naoki, Nishio, Moriyama and UratsukaNakamura and others, 2005), we describe only aspects of the Sea-ice thickness measurements relevant to this paper.
The Sea of okhotsk measurements were conducted on the soya from 5 to 14 february 2004. the vessel’s position was recorded using a global positioning System (GPs) receiver, and its track for 9 february is Shown in figure 1. the track length was 68.1 km for the whole day, 28.1 km of which was for the morning measurements. on the morning run (solid line), Sea-ice thickness measurements were made along a track that closely matched those of the envisat and pi-sar. camcorder images taken on board the soya and also camcorder images taken on board the gulfstream ii confirmed that the vessel’s track was through undeformed ice. camcorder Shots were taken of the vertical Sides of the ice fragments after the ice was broken up by the bow of the vessel (Reference shimodaShimoda and others, 1997). we identified these fragments and measured their thickness by analyzing the camcorder images and using a gage in the images as a reference (Reference Toyota, Ukita, Ohshima, Wakatsuchi and MuramotoToyota and others, 1999). figure 3 Shows the distribution of the thicknesses. the mean ice thicknesses (number of Samples) were 59.0 cm (645) for data acquired during the whole day and 59.2 cm (310) for data taken in the morning only.
Frequency distributions of ice thicknesses in Sea of Okhotsk.

There were also two anchored observation points (sites 3 and 4; fig. 1). ground-truth observations were conducted at these points in the morning on 9 february, when Sky conditions were clear. we estimated that ice movement during the <1 hour interval between the ground-truth and Sar observations was negligible. the Snow properties were obtained by Snow-pit work. we measured the ice Surface Salinity after melting ice fragments taken from the top 3 cm layer of the ice Surface using an ice auger. in order to measure the thickness of ice, we also dug a hole in the ice Sheet using an ice auger. the ice thickness was measured the whole length. the Snow depth and ice Salinity were quantified using ice-core data obtained at each Site. the Surface roughness was measured using a roughness comb, a Specially designed tool for measuring ice Surfaces. it has 106 teeth at 4 mm intervals. the acquired profile is accurate enough to obtain the roughness parameters because the Spacing between the teeth is <0.1 times the wavelength observed by Sar (Reference Ulaby, Moore and FungUlaby and others, 1982). we calculated the roughness parameters of the Standard deviation for the Surface height (rms height) and correlation length, which was derived from the Surface height profile. we obtained the roughness parameters for nine points at Sites 3 and 4. the mean rms height and correlation length were 4.3 and 30.0 mm, and the Standard deviations of rms height and correlation length were 1.3 and 7.7 mm, respectively.
Relationship Between Ice Thickness and Backscattering Coefficient
We used 3 by 3 pixel averaging to extract the backscattering coefficients from the envisat/asar and pi-SAR/l-band Sar images at points corresponding to the ice-thickness measurement points and derived the relationship between the backscattering coefficients and the ice thickness. the relationship is Shown in figure 4, in which the raw ice thicknesses measured in the morning are plotted. the incidence angle at the center of the analysis track was 39˚ for both Sar images. the Standard deviations were calculated when the backscattering coefficients were extracted. the correlation coefficients and Standard deviations between the ice thicknesses and backscattering coefficients are Summarized in table 2. the backscattering coefficients for both bands and all polarizations increased as the ice thickness increased. the Scattering around the regression lines in figure 4 was apparently due to local roughness.
Relationship between ice thicknesses measured in the morning and backscattering coefficients. (a) Envisat/ASAR. (b) Pi-SAR/L-band SAR.

Standard deviations and correlation coefficients between ice thicknesses and backscattering coefficients for each polarization
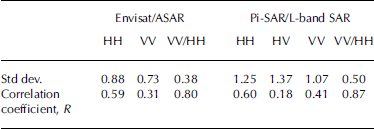
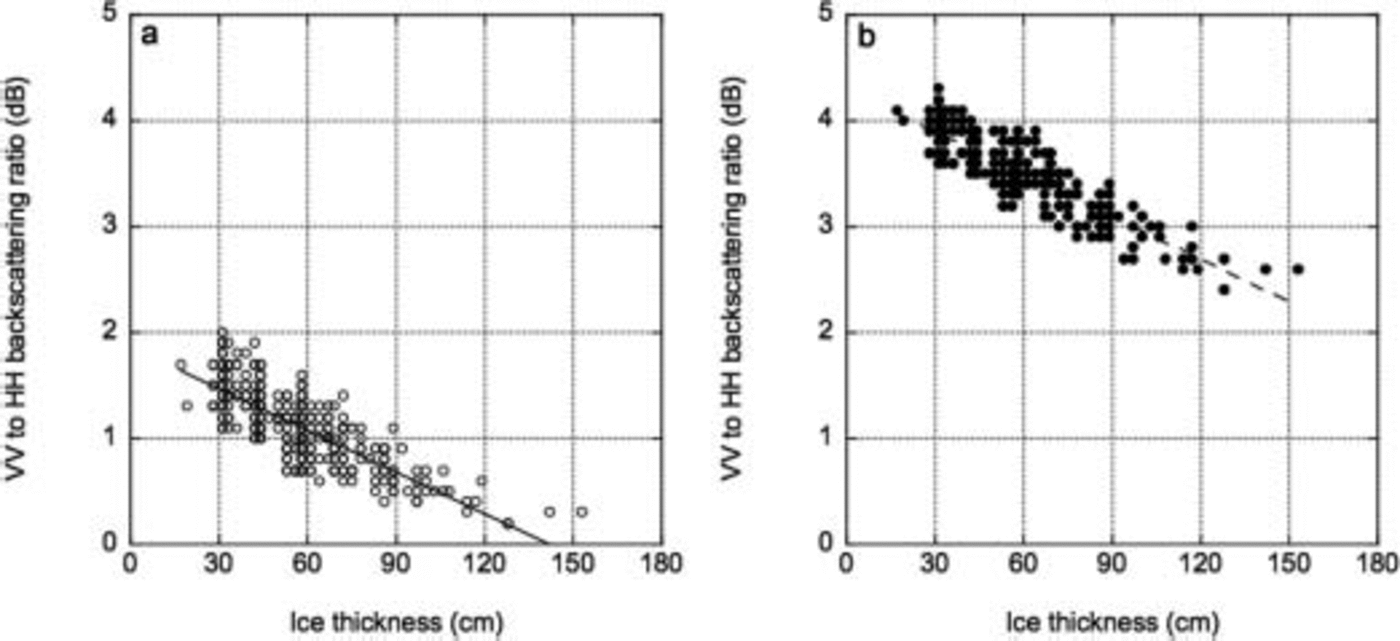
To confirm the feasibility of using the backscattering ratio to estimate the ice thickness, we compared in Situ the ice thickness with the vv-to-hh backscattering ratios from asar and pi-sar (fig. 5a and b). the ice thickness and the backscattering ratio were extracted in the Same way as the backscattering coefficient described above. as Shown in figure 5, the ratio decreased as the ice thickness increased. the Standard deviations and correlation coefficients are also Summarized in table 2. the correlation coefficient is Shown to be highest when the vv-to-hh backscattering ratio is used, the values being 0.80 and 0.87 for data from asar and pi-sar, respectively. the relatively high correlation value establishes confidence that the ratio provides thickness information.
Relationship between ice thickness and VV-to-HH backscattering ratio. (a) Envisat/ASAR. (b) Pi-SAR/L-band SAR.
Backscatter From First-Year Ice
Since the Surface Salinity of first-year Sea ice is generally high as in the Sea of okhotsk, Surface Scattering is considered to be the dominant Scattering mechanism. the roughness and dielectric constants of the Sea-ice Surface contribute to Surface Scattering. the imaginary part of the dielectric constant of the Sea-ice Surface decreases as the ice becomes thicker because the brine volume of the ice decreases due to brine expulsion and drainage as the ice grows (Reference Cox and WeeksCox and weeks, 1974).
Because the backscattering coefficients are Sensitive to ice-surface roughness and changes in dielectric constant in the case of first-year ice, it is generally difficult to estimate ice thickness from the backscattering coefficients without removing the roughness contribution. Reference Winebrenner, Farmer and JoughinWinebrenner and others (1995) reported that the vv-to-hh backscattering ratio is related to ice thickness at 24 cm wavelengths (l-band) or longer, especially for thin ice in arctic leads. we use the vv-to-hh backscattering ratio in conjunction with Salinity information to develop an algorithm discussed in this paper.
Proposed Algorithm
Retrieval procedure
As mentioned above, the backscattering coefficient of first-year ice depends on the roughness and dielectric constant of the ice Surface. Since a typical Surface Scattering model for Small or medium-size roughness (Reference Ulaby, Moore and FungUlaby and others, 1982; Reference FungFung, 1994) can be expressed in a Separable form with respect to the dielectric constants and the roughness contribution, the backscattering coefficients from Sea ice as observed by Sar were Simplified and expressed as

Where σ 0 is the backscattering coefficient, H i is the ice thickness, α is the polarization amplitude, which is the term of association with the dielectric constants, the Subscripts hh and vv indicate the horizontal and vertical polarizations, respectively, W is the term for the roughness contribution, s is the rms height, and l is the correlation length. therefore, σ 0 is expressed as a function f of α and W (Reference Nakamura, Wakabayashi, Naoki, Nishio, Moriyama and UratsukaNakamura and others, 2005).
The vv-to-hh backscattering ratio (r VVHH) is derived as follows:

Since we usually use db, calculating the logarithm for equation (2) gives:
Because the roughness term is the Same for both polarizations in the Surface-scattering model, f VV[W(s,l)]= f HH[W(s,l)]=0.5l 2 exp[–(klsinθ)] (when the gaussian Surface correlation function is assumed), and the rms height and the correlation length are independent of the polarization characteristics of the backscatter (Reference Ulaby, Moore and FungUlaby and others, 1982; Reference FungFung, 1994).

Therefore, the roughness contribution is independent of the variations in polarization. the polarization amplitude is related to the dielectric constant in the Scattering fields. there is a difference between α VV and α HH in the ice Surface. therefore, the vv-to-hh backscattering ratio is related to the dielectric constant of the ice Surface, and this ratio may reflect differences in the ice-surface dielectric constant caused by changes in the ice thickness.
Wakabayashi and others (2004) demonstrated that the vv-to-hh backscattering ratio has little Sensitivity to ice Surface roughness and is related to variations in Salinity or ice Surface dielectric constant that can be caused by changes in ice thickness. the ice Salinity used in this Simulation is based on the empirical relationship between the bulk Salinity and thickness of Sea ice observed by Reference Frankenstein and GarnerCox and weeks (1974). however, Surface Salinity and not bulk Salinity Should be used for Such a model because Sar backscatter is Sensitive only to the Surface layer of undeformed first-year ice. the algorithm used in this paper is based on the procedure described by wakabayashi and others (2004), but using ice Surface Salinity and thickness data from the Sea of okhotsk and lake Saroma projects.
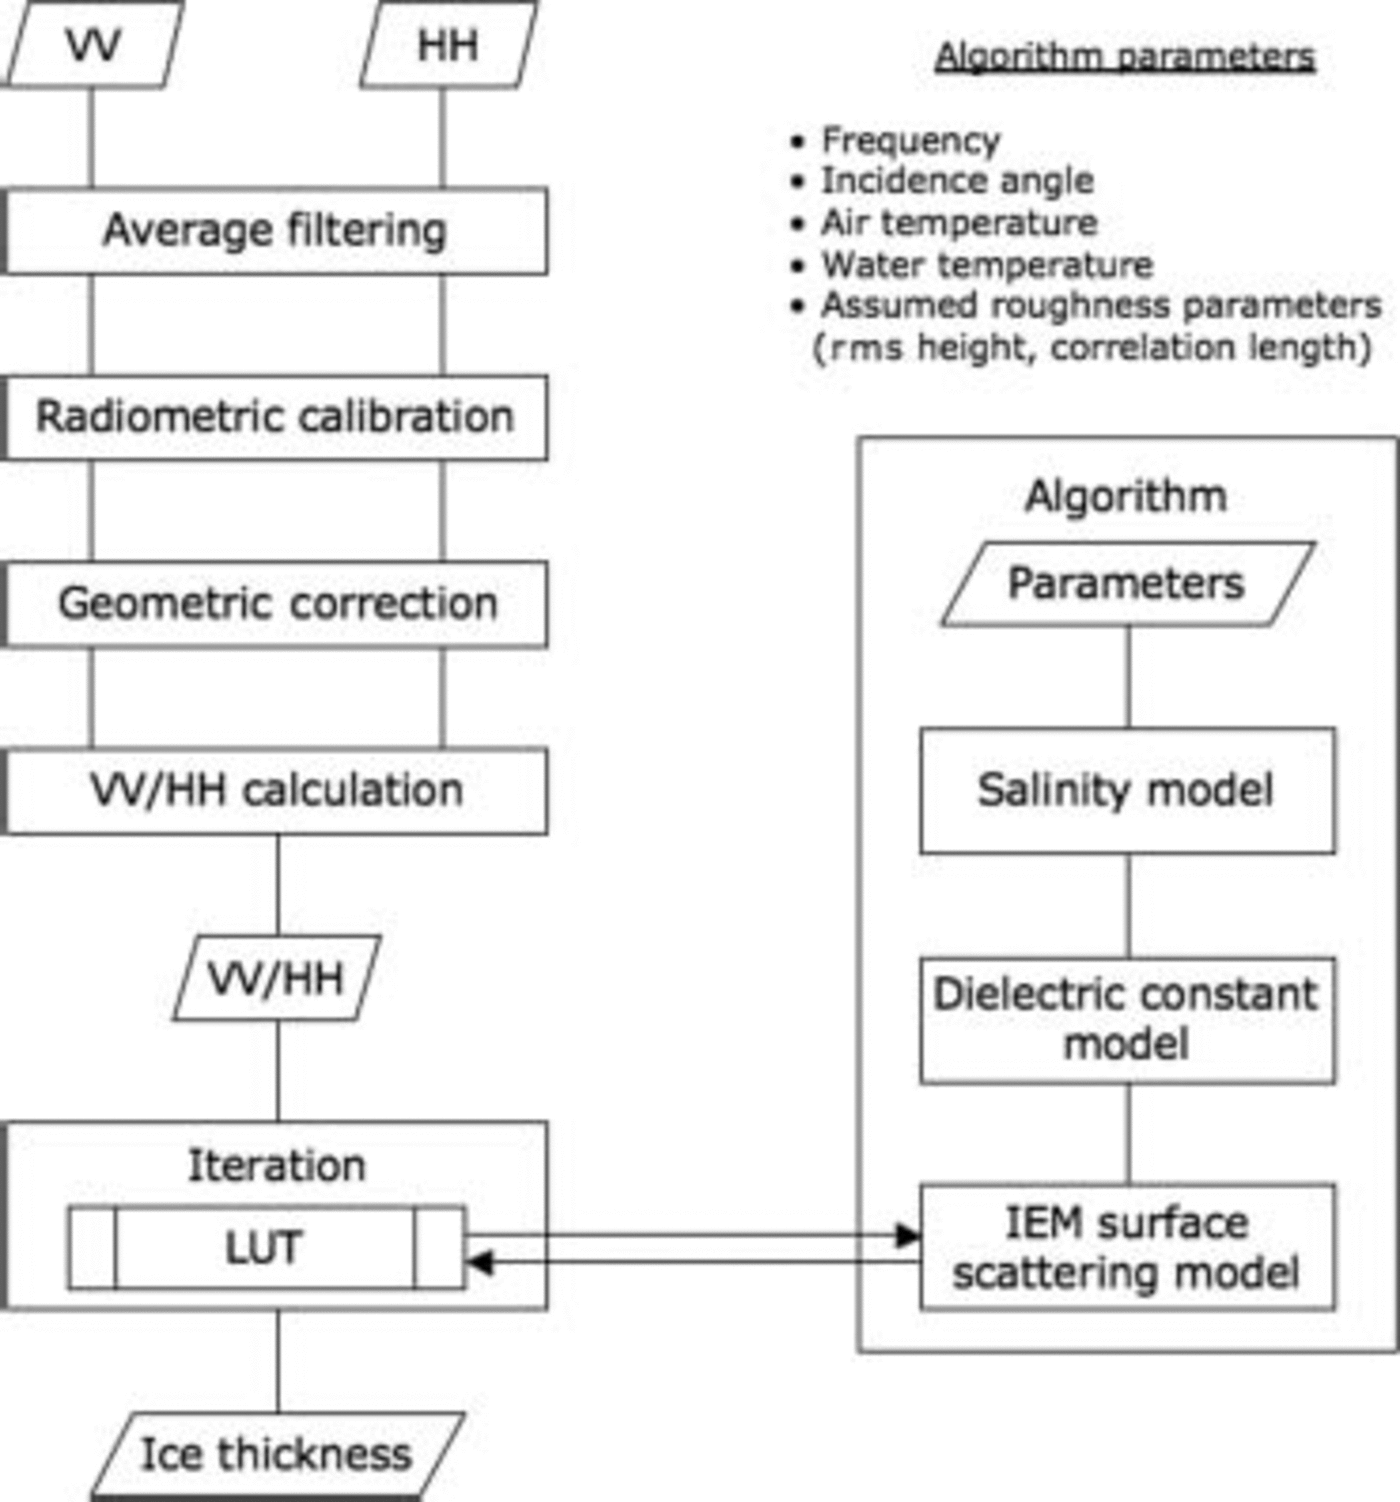
Our algorithm is based on a Surface Scattering model and uses a look-up table for the vv-to-hh backscattering ratio. the look-up table is calculated for different ice thicknesses and for the different incidence angles in the Sar observations. it provides the backscattering coefficients for the Sea-ice Surface as Simulated using the integral-equation-method (iem) model, and the backscattering ratio as calculated using the ratio of vv-to-hh backscattering coefficients. the dielectric constants of Sea ice at the Sar frequency that were used as input for the iem model were calculated based on a Simplified two-phase mixture model. the functional relationship between ice Salinity and thickness that was used in this Simulation was derived from the Surface Salinity and the Sea-ice thickness data collected at the Sea of okhotsk and lake Saroma. the Schematics of our algorithm, which includes the use of the iem Surface Scattering model, the dielectric constant model and the Salinity-to-thickness model, is presented in figure 6.
Algorithm for retrieving ice thickness.
Surface scattering model
To calculate the vv-to-hh backscattering ratio, we calculate the backscattering coefficients for the Sea-ice Surface using the iem model (Reference FungFung, 1994), which gives the backscattering coefficients for Surfaces with Small or medium roughness as


Where pp = vv or hh polarization, k is the wavenumber, σ is the rms height, W ( n )(–2k Sin θ, 0) is the fourier transformation of the nth power of the Surface correlation coefficient, and θ is the incidence angle. we previously measured (wakabayashi and others, 2004) ice Surfaces under Several conditions, including Smooth and Slightly rough, and preliminarily investigated both the gaussian and exponential Surface correlation functions. Since there was a very Small difference in the Simulated vv-to-hh backscattering ratio between the two functions, here we use the gaussian function. we also use f pp, F pp(–ksinθ,0), and F pp(ksinθ,0) for a Specific polarization (Reference FungFung, 1994).
Dielectric constant model
The dielectric constant of Sea ice, ε i, at the Sar frequency is needed to determine the backscattering coefficient using the iem model. we calculated it using a Simplified two-phase mixture model (Reference Hoekstra and CapillinoHoekstra and cappillino, 1971):

Where ε'i is the real part of the dielectric constant for Sea ice, and vb is the brine volume fraction.

Where  is the imaginary part of the dielectric constant for Sea ice, and
 is the imaginary part of the dielectric constant for brine. the brine volume can be determined from (Reference Frankenstein and GarnerFrankenstein and garner, 1967)
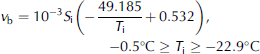
Where s i is the ice Surface Salinity (ppt) and T i is the ice Surface temperature (˚c), which can be determined from (Reference Nakawo and SinhaNakawo and Sinha, 1981)

Where T
w is the water temperature (˚c), T
a is the air temperature (˚c), H
s is the Snow depth, H
i is the ice thickness, and k
s and k
i are the thermal conductivities for Snow and ice (calcm–1 S–1 deg–1). then,  can be determined from (strogyn, 1971)

Where f is the frequency (hz), ε
0 (=8.85×10⁻¹² faradm–1) is the free-space permittivity, and  (=4.9) is the high-frequency limit of the dielectric constant for pure water (Reference Lane and SaxtonLane and Saxton, 1952). the ε
b0 and т
b for a Specific brine temperature are given in Reference Grant, Buchanan and CookGrant and others (1957) and Reference Klein and SwiftKlein and Swift (1977), and the σ
b for a Specific brine Salinity is given in Strogyn (1971).
salinity model
Reference Cox and WeeksCox and weeks (1974) observed that the ice Salinity decreased as the ice thickened in the arctic, and Reference Toyota and KawamuraToyota and kawamura (2002) Showed that the Same tendency holds for the Sea of okhotsk. therefore, the Surface Salinity of Sea ice could provide information about ice thickness. we thus calculated the brine volume and Salinity based on the relationship between the ice thickness and ice Surface Salinity, derived from the ground-truth Samplings at the Sea of okhotsk and lake Saroma. figure 7 Shows the relationship between the ice thickness and Surface Salinity obtained using ground-truth acquisition at lake Saroma from 1996 to 1998 and in 2003 and 2004 and for the Sea of okhotsk in 2003 and 2004.
Relationship between ice thickness and Surface Salinity for test Site located on Lake Saroma (open circles), taken from 1996 to 1998 and in 2003 and 2004, and for Sea of Okhotsk (filled circles), from 2003 and 2004. Dashed lines Show two regressions with different Salinity gradients. Some of the Salinity data for the Sea of Okhotsk came from the Institute of Low Temperature Science, Hokkaido University.
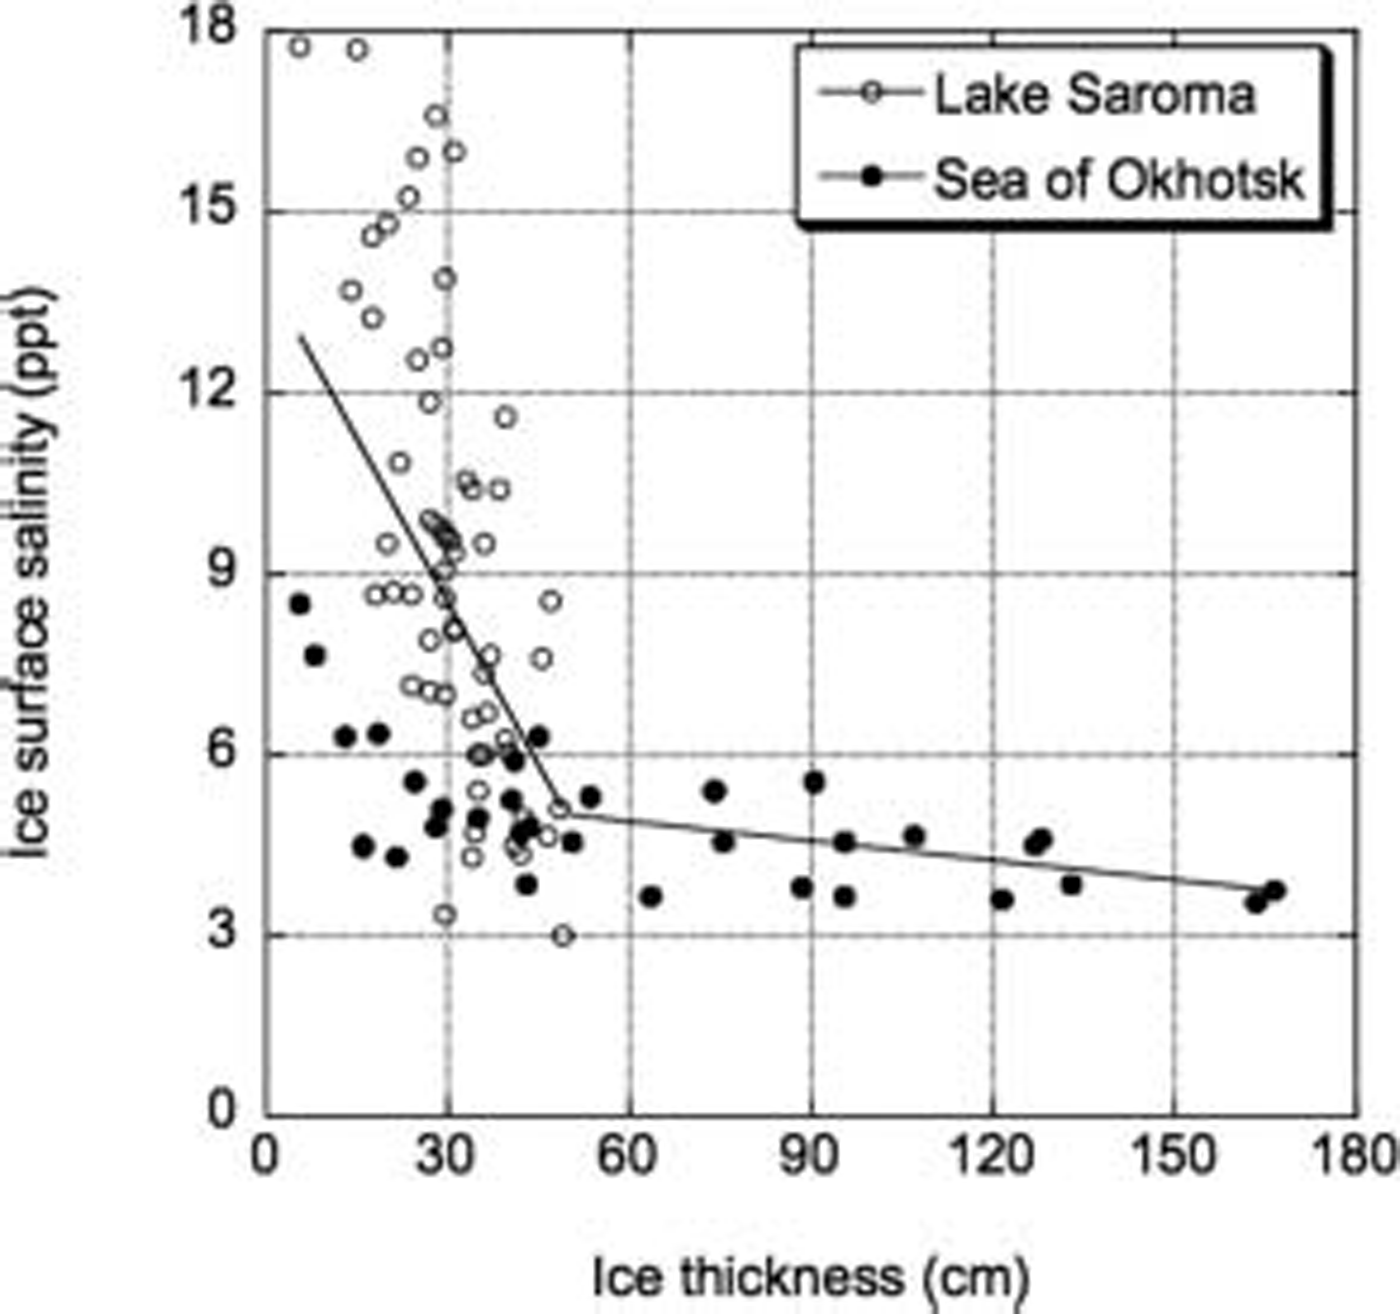
The data Show that ice Surface Salinity decreased rapidly from 18 to 5 ppt as the ice thickened to about 50 cm, while the Salinity decreased Slightly as the ice thickened over 50 cm. this result is Similar to that described in previous reports (Reference Cox and WeeksCox and weeks, 1974; Reference Toyota and KawamuraToyota and kawamura, 2002). hence, the relationship between the ice thickness and Surface Salinity can be expressed by two equations derived using an inflection point connecting different Salinity gradients. the inflection point can be Set to minimize the Scattering around the regression lines, as Shown in figure 7. the ice Surface Salinity used in our algorithm is based on that relationship.

sensitivity of VV-to-HH backscattering ratio
We investigated the Sensitivity of the vv-to-hh backscattering ratio to the Surface roughness and ice thickness. for the roughness investigation, the rms height was varied up to 8.0mm while the other parameters were Set at constant value based on the averages of measurements from the Sea of okhotsk. in particular, the following values are used: Snow depth on ice of 10.5 cm, ice thickness of 59.2 cm and correlation length of 30.0 mm. for the thickness investigation, the ice thickness was varied within 120 cm. the Same fixed values for the other parameters, as for the roughness investigation, were used except for the rms height, which was Set at 4.3 mm, based on the average of measurements from the Sea of okhotsk. for both investigations, the water temperature was Set to –1.8˚c, and the air temperatures was Set to –10.1˚c for the c-band (envisat) and –4.5˚c for the l-band (pi-sar), which were the temperatures at the time of Sar acquisition as recorded by the yubetsu meteorological Station in mombetsu.
figure 8a Shows the dependence of the ratio on the roughness at an incidence angle of 39˚. for the c-band, the dynamic range of the ratio decreased Slightly as the rms height increased, while for the l-band the ratio did not change with the roughness. therefore, the contribution of roughness to backscatter can be removed using the vv-to-hh backscattering of the l-band.
Relationship between Surface Scattering parameters and VV-to-HH backscattering ratio derived from IEM model: (a) rms height; and (b) ice thickness.

figure 8b Shows the dependence of the ratio on the ice thickness at an incidence angle of 39˚. for both bands, the ratio decreased as the ice thickness increased. it is thus apparent that the l-band data provide a better estimate of Sea-ice thickness than c-band data.
Estimation of ice thickness
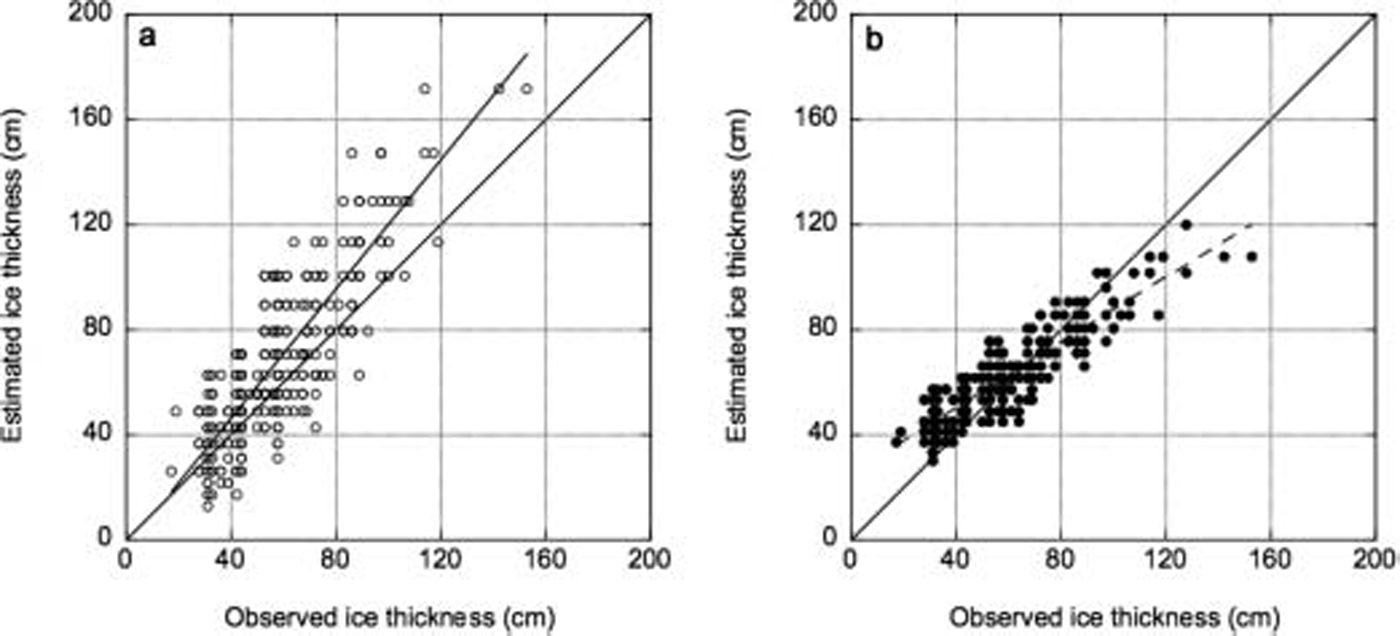
To validate the ability of our algorithm to estimate ice thickness, we compared the ice thicknesses estimated by the algorithm with the ice thickness measured in Situ during the morning run. the observed and estimated ice thicknesses are compared in figure 9. the calculated rms errors (bias) for the c-band envisat and l-band pi-sar data were 13.6 (10.0) and 7.0 (2.8) cm, respectively. it is apparent that the use of l-band provides almost a factor of 2 improvement in accuracy over the c-band. the data points in figure 7 Show a lot of Scatter for those below 50 cm. we explored the possibility of improving the accuracy in the retrieval by changing the values in equation (8) with regression results for data points from the lake Saroma measurements only. the results differed by a few centimeters, but at this point we are not able to estimate the improvement in accuracy. we also do not know why the data points from lake Saroma as Shown in figure 7 have a much higher Salinity than those at the Sea of okhotsk.
Comparison between observed and estimated ice thickness. (a) Envisat/ASAR. (b) Pi-SAR/L-band SAR.
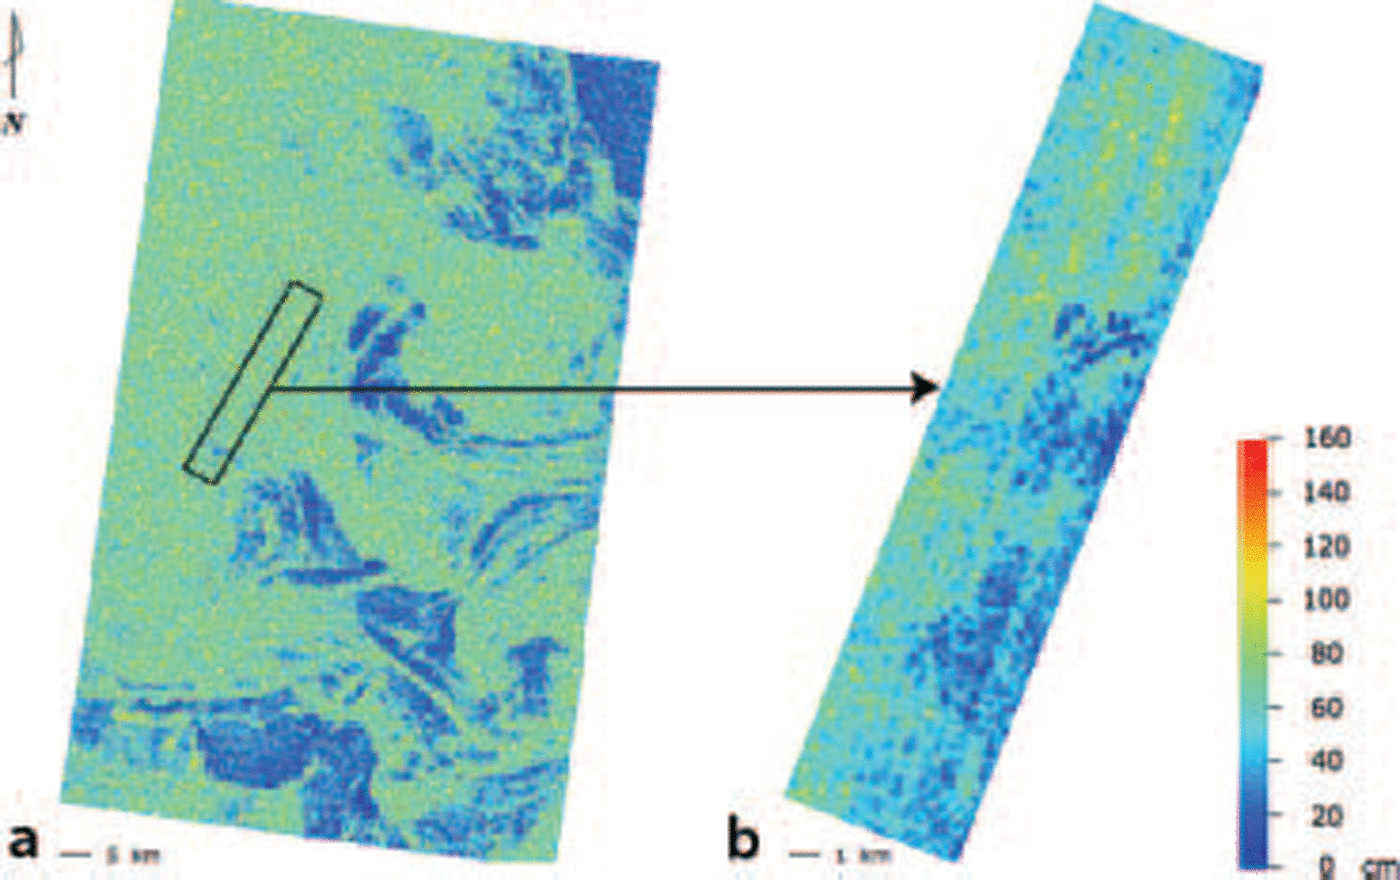
Using the results of our algorithm, we created an ice-thickness map (fig. 10). the image Shows the large Spatial variability in the thickness of ice at the Sea of okhotsk and the value of having this kind of data for heat-flux and process Studies in the polar regions.
Ice-thickness map based on results of algorithm for undeformed ice thickness. (a) Envisat/ASAR. (b) Pi-SAR/L-band SAR.
Conclusion
Using envisat and pi-sar data, we found that the vv-to-hh backscattering ratios for both bands are highly correlated with ice thickness, the correlation coefficient being 0.80 and 0.87 for asar and pi-sar, respectively. we use this information to develop an algorithm that makes use of the Scattering ratio in conjunction with a iem Surface Scattering model, a dielectric constant model and a Salinity model for Sea ice. our algorithm was tested using observed and calculated results, and the results Show good agreement with in Situ thickness data, with rms error of 7.0 cm if l-band pi-sar data are used. the agreement is not good if c-band asar data are used, the rms error being 13.6 cm. this indicates that l-band Sar is more useful for thickness retrieval than the c-band asar.
When the ice thickness was estimated using the backscattering coefficient directly, the correlation was not as good as when it was estimated using our algorithm. this Study was limited to undeformed first-year ice and likely applicable to the lake Saroma and Sea of okhotsk area only. future work includes using it to retrieve the thickness of undeformed ice in other regions, especially with the Successful launch of alos which has an l-band palsar (phased array-type l-band Sar) Sensor. eventually, we also hope to find Similar applications for Sea ice under rafting and ridging conditions.
Acknowledgements
We are grateful to m. nakayama, k. tateyama, j. inoue, S. watanabe, the japan coast guard and the crews of the soya for their assistance with this Study. we also thank the institute of low temperature Science, hokkaido university, and o. nakagawa, S. kojima, husiletu, y. Saitoh, a. muto, a. hasegawa and h. enomoto for their assistance in collecting the data in the Sea of okhotsk and lake Saroma. the pi-sar observation in the Sea of okhotsk was carried out under the pi-sar research announcement program by NICT and jaxa.



