Implications
We studied the effect of parenteral butyrate on pig liver metabolism more directly through intravenous infusion of sodium butyrate. The results revealed that parenteral butyrate mainly affected pig liver lipid and carbohydrate metabolism. This study provides the information that parenteral butyrate affects the body’s metabolism and contributes to a more systematic understanding of the role of butyrate in the body, thus promoting more scientific and rational application of butyrate in animal production and even human health.
Introduction
Short-chain fatty acids are the final products of anaerobic bacterial fermentation of non-digestible carbohydrates in the hindgut, of which acetate, propionate, and butyrate are the most abundant (Nicholson et al., Reference Nicholson, Holmes, Kinross, Burcelin, Gibson, Jia and Pettersson2012). Short-chain fatty acids are readily absorbed in portal vein and directly reach the liver which generally removes the total incoming propionate and butyrate, whereas acetate uptake is limited (Remesy and Demigne, Reference Rémésy and Demigné1983). Recently, more and more attention has been paid to butyrate for its benefits in the health of humans and animals. As a signal molecule, butyrate can regulate body metabolism by inhibition of histone deacetylases and activation of its G protein-coupled receptors 41 (GPR41) and GPR43 (Brown et al., Reference Brown, Goldsworthy, Barnes, Eilert, Tcheang, Daniels, Muir, Wigglesworth, Kinghorn, Fraser, Pike, Strum, Steplewski, Murdock, Holder, Marshall, Szekeres, Wilson, Ignar, Foord, Wise and Dowell2003; Davie, Reference Davie2003). A study showed that sodium butyrate (SB) protected against high fat diet-induced cardiac dysfunction and metabolic disorders in type II diabetic mice (Zhang et al., Reference Zhang, Du, Yano, Wang, Zhao, Dubielecka, Zhuang, Chin, Qin and Zhao2017). Our previous study also showed that the oral administration of SB affected the lipid metabolism and hepatic metabolite profiles of piglets (Yu et al., Reference Yu, Ren, Xu, Su and Zhu2016). Although butyrate can act its roles in both enteral and parenteral levels, the main pathway is largely unknown so far, and little information on the effects of butyrate on the metabolism of piglets at the extraintestinal level is available.
The liver is the metabolic center of the body and plays a key role in metabolism of nutrients. RNA sequencing (RNA-Seq) is an approach for assessment of transcriptome profiling using deep-sequencing technologies, which can provide a far more precise measurement of levels of transcripts and their isoforms than other methods (Wang et al., Reference Wang, Gerstein and Snyder2009). Studying the profiles of hepatic gene expression may supply the first information on the metabolic response to intravenous infusion of SB. Metabolite profiling has also been widely used in nutrition research. The alterations in the metabolome can provide an insight into the end points of metabolic fluxes in the body (Wang et al., Reference Wang, Lawler, Larson, Ramadan, Kochhar, Holmes and Nicholson2007), which significantly contributes to our understanding of the regulating mechanism of SB on the body metabolism.
In the current study, we hypothesized that intravenous SB can directly affect liver metabolism, thus affecting the overall metabolism of the body. Therefore, by using transcriptomic analysis and gas chromatography-mass spectrometry (GC-MS) based metabolic profiling, the aim of this study was to investigate the effects of intravenous infusion of SB on liver gene expression and metabolite profiles of growing pigs in a short-term.
Material and methods
Ethics statement
This study was approved by the Nanjing Agricultural University Animal Care and Use Committee (Nanjing, Jiangsu Province, China). All surgical and animal care procedures throughout the study followed Experimental Animal Care and Use Guidelines of China.
Animals, housing, experimental design and sampling
A total of 12 crossbred growing barrows (Duroc×Landrace×Large White; initial BW=19.53±1.35 kg) from the research pig farm (Nanjing Agricultural University) were used in the present study. Pigs were surgically fitted with a medical polyethylene cannula (inside diameter 2 mm and outside diameter 3 mm) via internal jugular vein after anesthesia to allow for the continuous infusion of SB. One week before surgery, pigs were moved into 1.0×1.2 m individual pens for adaptation to the new environment, where they were housed for the duration of the experiment. During the 1 week recovery period after surgery, pigs consumed a commercial grower diet (Supplementary Material Table S1). Feed amounts were gradually increased after surgery until reaching pre-surgery levels. Following recovery, pigs (BW=23.70±1.29 kg) were randomly allocated into the SB and control (CO) groups with a completely randomized design. Each group consisted of six replicates (pens), with one pig per pen. At 0900 h of each experimental day, pigs in the SB group were intravenously infused with 10 ml SB (200 mmol/l, pH 7.4, 37°C) via internal jugular vein, while the CO group was treated with the same volume of physiological saline (0.9% NaCl, pH 7.4). During the 7 days experimental period, pigs had unlimited access to feed and water. No differences in the average daily weight gain (0.82±0.08 kg v. 0.81±0.06 kg) and average daily feed intake (1.39±0.21 kg v. 1.44±0.13 kg) of pigs were found between the SB and CO groups. On day 8, all pigs were weighed and euthanized with a jugular vein injection of 4% sodium pentobarbital solution (40 mg/kg BW) after 12 h fasting. Blood samples (10 ml) were collected and centrifuged at 2000×g for 10 min at room temperature, and the supernatants were collected and stored at −28°C for the biochemical analysis. The tissues of the liver were collected and preserved in liquid nitrogen for further gene expression and metabolome analyses.
Serum biochemical analysis
The concentrations of total protein (TP), high-density lipoprotein-cholesterol (HDL-C), low-density lipoprotein-cholesterol (LDL-C), cholesterol, glucose and triglyceride (TG) in the serum of pigs were determined using an Olympus AU400 biochemical analyzer (Tokyo, Japan).
Library construction for RNA sequencing and sequencing procedures
Total RNA of the liver tissues was isolated using RNeasy mini kit (Qiagen, Hilden, North Rhine-Westphalia, Germany). As there were six replicates in each group, three biological replicates were randomly selected for the RNA-Seq so as to reduce the costs of the experiment. Strand-specific libraries were prepared using the TruSeq® Stranded Total RNA Sample Preparation kit (Illumina, San Diego, CA, USA) following the manufacturer’s instructions. Briefly, ribosomal RNA was removed from total RNA using Ribo-Zero rRNA removal beads. Following purification, the mRNA was fragmented into small pieces using divalent cations under 94°C for 8 min. The cleaved RNA fragments were copied into first-strand cDNA using reverse transcriptase and random primers. This was followed by second strand cDNA synthesis using DNA polymerase I and RNase H. These cDNA fragments then went through an end repair process, the addition of a single ‘A’ base, and then ligation of the adapters. The products were then purified and enriched with PCR to create the final cDNA libraries. Purified libraries were quantified by Qubit® 2.0 fluorometer (Life Technologies, Carlsbad, CA, USA) and validated by Agilent 2100 bioanalyzer (Agilent Technologies, Atlanta, GA, USA) to confirm the insert size and calculate the mole concentration. Clusters were generated by cBot with the libraries diluted to 10 ρmol/l and then were sequenced on the Illumina HiSeq 2500 (Illumina) using paired-end sequencing program, respectively. The library construction and sequencing were performed at Shanghai Biotechnology Corporation. Approximately 58.2 million reads per sample (mean±SD=58.2±6.61 million) were generated. The Q20 value per sample was >90%, so the sequencing results were qualified for follow-up analysis. The detailed information about the quality control of RNA and sequencing showed in Supplementary Material Table S2.
Liver sample preparation for gas chromatograph-mass spectrometry analysis
Thirty milligram of each liver sample was mixed with 900 μl methanol containing [13C2]-myristic acid (12.5 μg/ml). The samples were grounded by a TissueLyser II (30 Hz; Qiagen) and maintained at 4°C for 1 h. Then, the samples were centrifuged at 12 000×g (4°C) for 10 min, and the supernatant (100 μl) was dried in a SpeedVac evaporator (Savant Instruments, Framingdale, NY, USA). The dried analytes were methoximated with a 30 μl aliquot of methoxyamine pyridine solution (10 μg/ml), then vortex-mixed (3 min) and maintained at room temperature for methoxidation (16 h). Then, 30 μl of n-heptane was added to each GC vial with methyl stearate (30 μg/ml) for quality control, after trimethylsilylation with 30 μl of methyl-trimethyl-silyltrifluoroacetamide with 1% trimethylchlorosilane.
Gas chromatography-mass spectrometry analysis
One microliter of each derivatized sample was injected splitlessly by an Agilent 7683 autosampler (Agilent Technologies, Atlanta, GA, USA) into Agilent 6890 GC system equipped with a 10 m×0.18 mm i.d. fused-silica capillary column with a chemically bonded 0.18 μm stationary phase (DB-5; J&W Scientific, Folsom, CA, USA). The inlet temperature was 250°C, the gas (helium) flow rate was 1.0 ml/min through the column. The column temperature was held at 70°C for 2 min, then increased by 30°C/min to 310°C, and held there for 2 min. The column effluent was introduced into the ion source of a mass spectrometer (Pegasus III; Leco, St. Joseph, MI, USA) through a transfer line. The ion source temperature and transfer line temperature were 200°C and 250°C, respectively. Mass spectra were acquired in the mass range 50 to 800 m/z at a rate of 30 spectra/s. Then, the compounds were identified by the comparison of the mass spectrum and retention indices of all the detected compounds with authentic reference standards and those available in the National Institute of Standards and Technology Library 2.0 and NEW Wiley 9 mass spectra library database (Sun et al., Reference Sun, Yu, Zhou, Fang, Su and Zhu2016).
Quantitative real-time PCR
The first-strand cDNA synthesis was performed using 1 μg of liver RNA with SuperScriptTM II Reverse Transcriptase (Invitrogen, Carlsbad, CA, USA). The cDNA of all 12 samples were then analyzed by quantitative real-time PCR using an ABI 7300 sequence detector (SDS, Foster City, CA, USA) to validate the RNA-Seq results. The PCR reactions were performed in a final volume of 20 μl with the Roche SYBR Green PCR Kit (Roche, Hercules, CA, USA) according to the manufacturer’s instructions. The mRNA expression of acetyl-CoA acyltransferase 1 (ACAA1), carnitine palmitoyltransferase 2 (CPT2), acyl-CoA synthetase long-chain family member 1 (ACSL1), carnitine palmitoyltransferase 1A (CPT1A), fatty acid binding protein 1 (FABP1), apolipoprotein A1 (APOA1), acetyl-CoA carboxylase alpha (ACACA), acyl-CoA oxidase 1 (ACOX1), apolipoprotein A4 (APOA4) and stearoyl-CoA desaturase (SCD) was measured for the validation of the RNA sequencing results. The primers for these genes were designed using Primer-BLAST (https://www.ncbi.nlm.nih.gov/tools/primer-blast/index.cgi?LINK_LOC=BlastHome) and listed in Supplementary Material Table S3. The fold change was calculated using the 2−ΔΔCt method, presented as the fold-expression change in SB group relative to CO group after normalization to the endogenous control gene, β-actin.
Data analysis
For serum metabolites and gene expression determined by real-time PCR, the data were analyzed by SPSS 17.0 as a completely randomized design. The pen was used as the experimental unit (n=6), the significance of differences between the CO and SB groups was evaluated by a Student’s t test. Significant differences were declared when P<0.05.
Raw reads obtained by RNA-Seq were processed into clean reads with removal of the sequencing adapt and low-complexity reads using FASTX-Tool kit (http://hannonlab.cshl.edu/fastx_toolkit/index.html). Then clean reads were mapped to reference pig genome (Sus scrofa 10.2) using TopHat (version: 2.0.9) with spliced mapping algorithm (Trapnell et al., Reference Trapnell, Pachter and Salzberg2009). Each read allows multi hits ⩽2, then Cufflinks (version: 2.2.1) was used for the quantitative analysis of mapping results (Trapnell et al., Reference Trapnell, Williams, Pertea, Mortazavi, Kwan, van Baren, Salzberg, Wold and Pachter2010). By converting the RNA-Seq reads into fragments per kilobase of exon model per million mapped reads (FPKM), normalization of gene expression levels was achieved (Mortazavi et al., Reference Mortazavi, Williams, Mccue, Schaeffer and Wold2008). Then the Cuffdiff program in the Cufflinks (version: 2.2.1) was used to analyze the differentially expressed genes of the two groups (n=3), at the same time, fold change was calculated based on FPKM value. In addition, the edgeR method was also used to carry out differential gene analysis (Robinson et al., Reference Robinson, McCarthy and Smyth2010). The Q-values were obtained after the P-values were corrected by a false-discovery rate (FDR) method (Benjamini and Hochberg, Reference Benjamini and Hochberg1995). The unknown genes were removed after annotate transcripts to pig (Sus scrofa) genes (https://david.ncifcrf.gov/home.jsp; accessed on November 2016). Genes with values of Q<0.05 and fold change ⩾1.2 or ⩽0.83 were considered to be differentially expressed and selected for the further study.
The online enrichment analysis tool of Shanghai Biotechnology Corporation (http://enrich.shbio.com/index/ga.asp; accessed on 4 October 2017) was used to performed Gene Ontology (GO) enrichment analysis and Kyoto Encyclopedia of Genes and Genomes (KEGG) Pathway enrichment analysis. Fisher’s exact test was used as statistical method, and Q-value was used as FDR correction method. A P-value <0.01 and a Q-value <0.05 were considered significantly enriched. The KEGG database was used to analyze the gene network of the differentially expressed genes involving significant pathways. Particular interest was devoted to the peroxisome proliferator-activated receptor (PPAR) pathways, lipid and carbohydrate metabolism.
The SIMCA-P (version 13.0; Umetrics AB, Umeå, Sweden) was used for the multivariate analysis of the pre-processed GC-MS data. The partial least squares discriminant analysis (PLS-DA) was employed to process the acquired GC-MS data (Eriksson et al., Reference Eriksson, Trygg and Wold2008). R 2 X cum, R 2 Y cum and Q 2 cum were calculated to describe the quality of a model. R 2Xcum and R 2 Y cum indicate the cumulative sum of squares of all the X variations and Y variations explained by all extracted components. Q 2 cum values display the cumulative percent of the variation in Y and can be used to estimate how well the model predicts the Y. The metabolites with variable importance projection values >1 and P-values <0.1 were extracted as the discriminating metabolites between the CO and SB groups. The impact of SB on the metabolite set enrichment analysis was evaluated based on the Metaboanalyst (version 3.0) tool, with its default settings, except that log transformation was used for the data normalization (Xia et al., Reference Xia, Psychogios, Young and Wishart2009).
Results
Serum metabolites
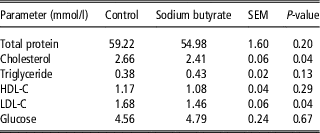
As shown in Table 1, the SB treatment significantly decreased (P<0.05) the concentrations of cholesterol and LDL-C, while no significant differences (P>0.05) in the concentrations of TP, TG, HDL-C and glucose were found between the CO and SB groups.
Serum metabolites concentrations of pigs in the control (CO) and sodium butyrate (SB) groups

HDL-C=high-density lipoprotein cholesterol; LDL-C=low-density lipoprotein cholesterol.
Metabolomic analysis of the liver
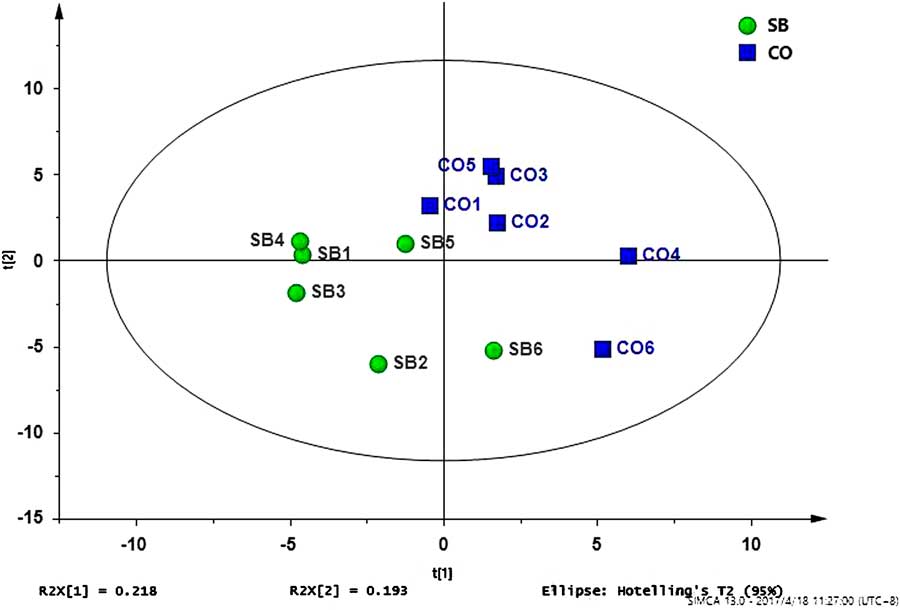
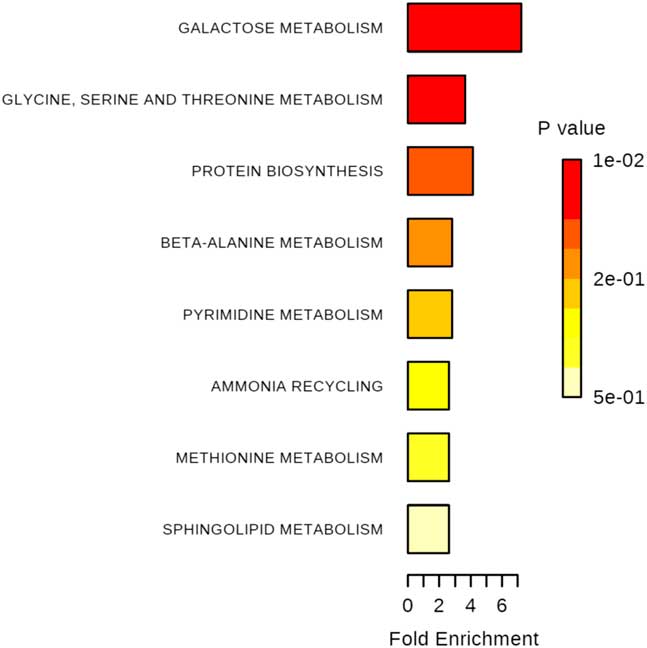
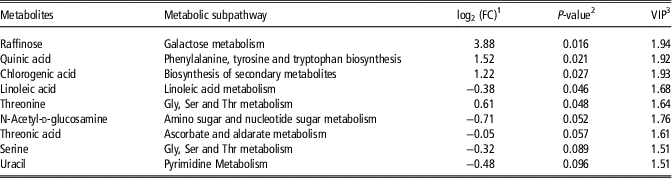
A total of 90 metabolites were detected (Supplementary Material Table S4) and used for multivariate analysis of liver metabolites, the goodness of model fit (R 2 Y cum) was 0.976 and the goodness of prediction (Q 2 cum) was 0.424 in the PLS-DA model (Figure 1). The extracted metabolites that were responsible for the difference between the CO and SB groups are shown in Table 2. Four of the metabolites (raffinose, quinic acid, chlorogenic acid and threonine) were significantly enriched (P<0.05), one (linoleic acid) was significantly reduced (P<0.05), and four (N-acetyl-d-glucosamine, threonic acid, serine and uracil) tended to be reduced by the SB treatment. Further metabolic pathway enrichment analysis showed that the SB treatment significantly affected galactose metabolism, glycine, serine and threonine metabolism, and protein biosynthesis (Figure 2).
(colour online) Partial least squares discriminant analysis (PLS-DA) of metabolites in the livers of pigs in the sodium butyrate (SB) and control (CO) groups. t[1]=the first principal component; t[2]=the second principal component; R 2 X=the fraction of variance explained by a component; R 2 X [1]=t[1] explained 21.8% of the variation, R 2 X[2]=t[2] explained 19.3% of the variation.

(colour online) Metabolite sets enrichment overview map of the selected metabolites (variable importance in the projection >1 and P<0.1) identified in liver between the control (CO) and sodium butyrate (SB) treatments. The rectangle color is based on its P-value, and the rectangle length is determined based on the pathway impact values. Longer length and darker colors represent greater pathway enrichment and greater pathway impact values, respectively.

Significantly altered metabolites in pig livers of the sodium butyrate (SB) group compared with the control (CO) group

1 log2(FC)=the logarithmic transformation of fold change for concentration of metabolites derived from SB group compared with CO group.
2 The significance P-value was obtained from Wilcoxon–Mann–Whitney test with a threshold of 0.10.
3 VIP=variable importance projection. This value was obtained from PLS-DA model with a threshold of 1.0.
Gene expression profiles in the liver
The gene expression profiles showed that a total of 117 differentially expressed genes were selected between the CO and SB groups at the particular cutoff criteria fold change ⩾1.2 or ⩽0.83 and Q<0.05. Among the genes, 51 genes were upregulated and 66 genes were downregulated by the SB treatment (Supplementary Material Table S5). These differentially expressed genes were subjected to GO enrichment analysis and KEGG pathway enrichment analysis with the online enrichment analysis tool of Shanghai Biotechnology Corporation.
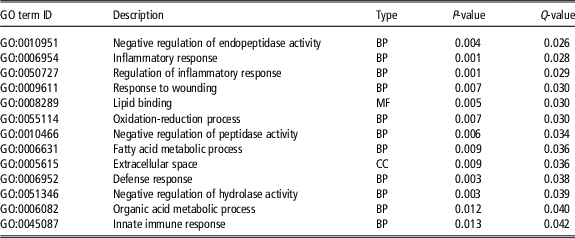
The result of GO enrichment analysis is shown in Table 3, 13 terms were significantly enriched (Q<0.05). At the level of biological processes, most of the genes were significantly enriched in the regulation of inflammatory response, inflammatory response, innate immune response, response to wounding, defense response, negative regulation of endopeptidase, peptidase and hydrolase activity, fatty acid metabolic process, organic acid metabolic process and oxidation-reduction process. At the level of molecular function and cellular component, most of the genes were significantly enriched in the lipid binding and extracellular space, respectively.
Top gene ontology clusters of differentially expressed genes in the livers of pigs induced by the sodium butyrate treatment compared with the control treatment

BP=biological process; MF=molecular function; CC=cellular component.
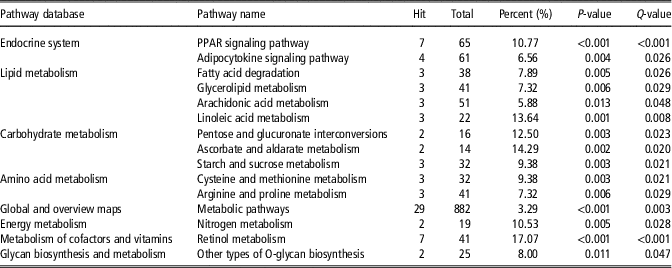
The result of KEGG pathway enrichment analysis is presented in Table 4. The significant pathways included mainly the endocrine system (PPAR signaling pathway and adipocytokine signaling pathway), lipid metabolism (linoleic acid metabolism, fatty acid degradation, glycerolipid metabolism and arachidonic acid metabolism), carbohydrate metabolism (starch and sucrose metabolism, pentose and glucuronate interconversions and ascorbate and aldarate metabolism), amino acid metabolism (cysteine and methionine metabolism and arginine and proline metabolism) and so on.
The mainly Kyoto Encyclopedia of Genes and Genomes (KEGG) pathways enriched with differentially expressed genes in the livers of pigs induced by the sodium butyrate treatment compared with the control treatment

PPAR=peroxisome proliferator-activated receptor.
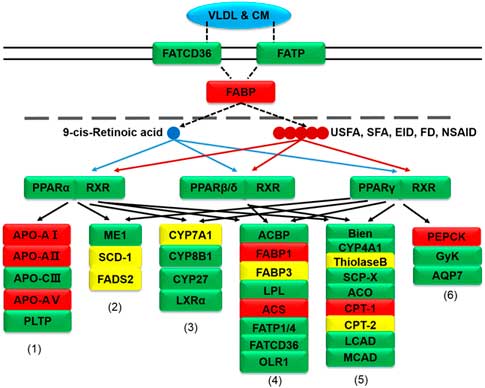
The detailed network of the PPAR signaling pathway was constructed using information from the KEGG database (Figure 3). In detail, fatty acid oxidation promoters ACSL1, CPT1A, CPT2 and ACAA1 were downregulated, fatty acid transport promoters FABP1 was upregulated, but FABP3 was downregulated, cholesterol metabolism promoter cytochrome P450 family 7 subfamily A member 1 (CYP7A1) was upregulated, and lipid transport promoters apolipoprotein A1 (APOA1), apolipoprotein A2 (APOA2) and apolipoprotein A5 (APOA5) were downregulated, lipogenesis promoter SCD was upregulated, but fatty acid desaturase 2 (FADS2) was downregulated by the short-term SB treatment. In addition, gluconeogenesis promoter PCK1 was downregulated.
(colour online) Influence of intravenous infusion of sodium butyrate (SB) on peroxisome proliferator-activated receptor (PPAR) signaling pathways in the livers of pigs. (1) Lipid transport, (2) lipogenesis, (3) cholesterol metabolism, (4) fatty acid transport, (5) fatty acid oxidation, (6) gluconeogenesis; gene symbols in red indicate genes that are differentially expressed between the SB and control (CO) groups (Q<0.05), gene symbols in yellow indicate genes that are marginally differentially expressed between the SB and CO groups (P<0.05). USFA=unsaturated fatty acid; SFA=saturated fatty acid; EID=eicosanoid; FD=fibrate drug; NSAID=non-steroidal anti-inflammatory drug.

Validation of the RNA sequencing results by real-time PCR
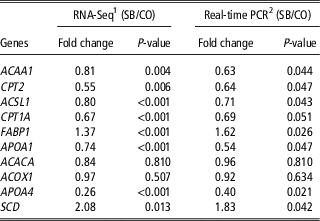
To validate the RNA-Seq results by the quantitative real-time PCR, two upregulated (FABP1 and SCD), six downregulated (ACAA1, CPT1A, CPT2, ACSL1, APOA1 and APOA4) genes, and two unchanged (ACACA and ACOX1) genes were validated. The results showed the expression profiles of these genes detected by the quantitative real-time PCR were consistent with those detected by RNA-Seq (Table 5). The quantitative real-time PCR C t values of the validated genes are shown in the Supplementary Material Table S6. The result confirmed the reliability of our RNA-Seq data.
Validation of RNA sequencing results of samples in the sodium butyrate (SB) and the control (CO) groups by real-time quantitative PCR

ACAA1=acetyl-CoA acyltransferase 1; CPT2=carnitine palmitoyltransferase 2; ACSL1=acyl-CoA synthetase long-chain family member 1; CPT1A=carnitine palmitoyltransferase 1A; FABP1=fatty acid binding protein 1; APOA1=apolipoprotein A1; ACACA=acetyl-CoA carboxylase alpha; ACOX1=acyl-CoA oxidase 1; APOA4=apolipoprotein A4; SCD=stearoyl-CoA desaturase.
1 Results based on RNA sequencing using six samples.
2 Results based on 12 individual samples.
Discussion
In the current study, transcriptomic and metabolomic analyses were creatively adopted to directly investigate the responses in the livers of growing pigs following a short-term intravenous infusion of SB. At the transcriptional level, we found that intravenous SB could affect liver metabolism by decreasing lipid transport, fatty acid oxidation, and gluconeogenesis as well as increasing fatty acid transport. At the metabolic level, intravenous SB mainly affected liver carbohydrate and amino acid metabolism. Compared with the data available in the literatures, our work was the first to investigate the transcriptomic and metabolomic responses induced by intravenous infusion of SB in the livers of growing pigs.
In the present study, the gene expression profiles showed that the PPAR signaling pathway was significantly affected by the SB treatment, which has profound effects on lipid and carbohydrate metabolism. In the PPAR signaling pathway, we found that lipid transport promoters (APOA1, APOA2 and APOA5), fatty acid oxidation promoters (ACSL1 and CPT1A), and gluconeogenesis promoter PCK1 were downregulated, fatty acid transport promoter FABP1 was upregulated by the short-term SB treatment.
Long-chain acyl-CoA synthetase (ACSL) catalyzes the first step in the activation of fatty acids for intracellular metabolism by converting long-chain fatty acids into long-chain acyl-CoAs (Hall et al., Reference Hall, Smith and Bernlohr2003). Acyl-CoA synthetase long-chain family member 1 is the main ACSL isoforms, which is highly expressed in adipose, liver and muscle (Mashek et al., Reference Mashek, Li and Coleman2006). Mitochondrial carnitine system plays a key role in β-oxidation. Carnitine palmitoyltransferase 1 catalyzes the esterification of long-chain acyl-CoAs into l-carnitine for transport into the mitochondria. The acyl-carnitine conjugate is converted back to the acyl-CoA ester inside mitochondria by CPT2 (Kerner and Hoppel, Reference Kerner and Hoppel2000). Acetyl-CoA acyltransferase (ACAA) also known as 3-ketoacyl-CoA thiolase, including two isoforms ACAA1 and ACAA2, which catalyzes the last step of the fatty acid β-oxidation. It has been suggested that obesity-resistant animals may show enhanced peroxisomal β-oxidation metabolism by upregulating the expression of ACOX1 and ACAA1 (Xie et al., Reference Xie, Wang, Zhang, Li, Can, Qing, Kung and Zhang2011). Another study showed that the inhibition of 3-ketoacyl-CoA thiolase activity in rat hearts led to a reduction of fatty acid oxidation (Kantor et al., Reference Kantor, Lucien, Kozak and Lopaschuk2000). In the present study, we found that a short-term intravenous infusion of SB significantly downregulated the expression of ACSL1 and CPT1A in pig liver, and the expression of CPT2 (P=0.006) in the SB group was 0.55-fold lower than the CO group. Moreover, the expression of ACAA1 (P=0.004) and ACAA2 (Q<0.001) were 0.81-fold and 0.74-fold lower in SB group comparing with the CO group, respectively. Hence, the results may indicate that a short-term intravenous infusion of SB could decrease fatty acid β-oxidation.
FABP1 (L-FABP) and FABP3 (H-FABP) interact directly with nuclear receptors, especially PPARs and RAR (Schroeder et al., Reference Schroeder, Petrescu, Huang, Atshaves, McIntosh, Martin, Hostetler, Vespa, Landrock, Landrock, Payne and Kier2008). A previous study with L-FABP null mice indicated that L-FABP played a key role of the cytosolic LCFA-binding capacity in liver (Martin et al., Reference Martin, Danneberg, Kumar, Atshaves, Erol, Bader, Schroeder and Binas2003). A high level of FABP1 could bind more LCFA and LCFA-CoA to reduce the toxic effects of poorly soluble lipids, and enhance LCFA and LCFA-CoA intracellular trafficking. In the present study, the upregulated expression of FABP1 by the SB treatment may be related to the reducing fatty acid β-oxidation and the upregulation of SCD, which led to an accumulation of long-chain fatty acids.
Apolipoprotein A1 and APOA2 are the major protein of the HDL particle, APOA5 is associated mainly with HDL and very low-density protein (VLDL) particles (Borghini et al., Reference Borghini, James, Blatter and Pometta1991; Abe et al., Reference Abe, Okada, Kuromori, Hara, Saito, Iwata, Harada and Mugishima2009). Apolipoprotein A4 is associated mainly with HDL (Lagrost et al., Reference Lagrost, Gambert, Boquillon and Lallemant1989). In the present study, the expression of APOA1, APOA2, APOA4 and APOA5 were downregulated by the short-term SB treatment. Meanwhile, the serum biochemical analysis showed that the SB treatment significantly decreased the concentrations of serum cholesterol and LDL-C. Moreover, the expression of CYP7A1 was increased by the SB treatment. The CYP7A1 gene encodes the enzyme cholesterol 7α-hydroxylase, which catalyzes the initial step in cholesterol catabolism and bile acid synthesis (Hubacek and Bobkova, Reference Hubacek and Bobkova2006). A previous study reported that butyrate increased 1.5-fold expression of CYP7A1 mRNA in cultured human hepatoma (HepG2) cells (Yang et al., Reference Yang, Lee and Kim2005). Another study reported that fats from different dietary sources affected the gene expression of APOA4 and CYP7A1 in pig liver (Oczkowicz et al., Reference Oczkowicz, Świątkiewicz, Ropkamolik, Gurgul and Żukowski2016). These results indicate that the short-term SB treatment can promote cholesterol metabolism by converting more cholesterol into bile acid and then decrease the secretion of hepatic cholesterol.
Phosphoenolpyruvate carboxykinase (PEPCK) has two isoforms, cytosolic isoform and mitochondrial isoform. The cytosolic isoform is encoded by the PCK1 gene, which accounts for over 95% of the activity in the liver and kidney (Wiese et al., Reference Wiese, Lambeth and Ray1991) and is a key enzyme in gluconeogenesis to catalyze the formation of phosphoenolpyruvate from oxaloacetate. A previous research reported that treatment of fasted rats with a PEPCK inhibitor, caused hypoglycemia (Ditullio et al., Reference Ditullio, Berkoff, Blank, Kostos, Stack and Saunders1974). In another research, overexpression of PEPCK transgenic mice caused hyperglycemia (Valera et al., Reference Valera, Pujol, Pelegrin and Bosch1994). In the present study, we found that intravenous SB decreased the gene expression of PCK1, suggesting the decrease of gluconeogenesis. However, a previous study showed that butyrate fermentation products of the plant fiber significantly increased the glucose production from lactate in isolated rat hepatocytes, and resulted in the increase of gluconeogenesis (Anderson and Bridges, Reference Anderson and Bridges1984).
The edgeR method determines differential expression using empirical Bayes estimation and exact tests based on a negative binomial model, which can account for biological variability when there are only one or two replicate samples (Robinson et al., Reference Robinson, McCarthy and Smyth2010). Cuffdiff is part of the extensive Cufflinks package developed for the identification of differentially expressed genes and transcripts, revealing differential splicing and promoter-preference changes. Although the Cuffdiff method has been widely used for the determination of differential expression genes in transcriptome sequencing (Bongiorni et al., Reference Bongiorni, Gruber, Chillemi, Bueno, Failla, Moioli, Ferrè and Valentini2016; Oczkowicz et al., Reference Oczkowicz, Świątkiewicz, Ropkamolik, Gurgul and Żukowski2016; Park et al., Reference Park, Jeong, Cho, Jeong and Park2017; Sun et al., Reference Sun, Xie, Huang, Li, Sun, Wang, Xi, Wu and Zhang2017), our study found that compared with the Cuffdiff method, a significantly lower number of differentially expressed genes (33 v. 117) obtained by the edgeR method with the same threshold (Supplementary Material Table S7). Nevertheless, real-time PCR results confirmed the reliability of our RNA-Seq data based on the Cuffdiff method. This is consistent with a previous report which aimed to compare different differential gene analysis methods (Rapaport et al., Reference Rapaport, Khanin, Liang, Pirun, Krek, Zumbo, Mason, Socci and Betel2013). However, another study found that Cuffdiff, baySeq, DESeq, edgeR and NOISeq generated consistent results on the identification of differentially expressed genes (Nookaew et al., Reference Nookaew, Papini, Pornputtapong, Scalcinati, Fagerberg, Uhlén and Nielsen2012). In this study, three replicates of samples for each group were used for RNA-Seq, which might be responsibility for the different transcriptome results between the edgeR and Cuffdiff methods. In addition, the individual variation of pigs and the short-term treatment in this study can also weaken the effect of SB infusion.
In the current study, we explored the effects of a short-term intravenous infusion of SB on the metabonomic profiles of pig liver. A previous study showed that butyrate could affect the energy metabolism of the liver in rats (Gallis et al., Reference Gallis, Tissier, Gin and Beauvieux2007). In this study, the concentration of raffinose in the SB group was 14.7-fold higher than that in the CO group. Raffinose is a trisaccharide composed of galactose, fructose and glucose, which is present in beans, cabbage, brussels sprouts, broccoli, asparagus and other vegetables and whole grains. Although pigs are not able to metabolize raffinose, intestinal microorganisms can ferment and utilize this substrate. Our study showed also that intravenous infusion of SB modified colonic microbial composition (unpublished data), which may explain the concentration change in raffinose between the two groups. In the SB group the concentration of sucrose was 3.2-fold higher compared with the CO group. Sucrose can decomposed into galactose and fructose, the accumulation of sucrose indicates that intravenous SB could decrease the metabolism of galactose and fructose. In addition, the downregulated expression of PCK1 indicates the decrease of gluconeogenesis. This may be consistent with the decrease of carbohydrate metabolism. The concentration of linoleic acid in the SB group was 0.77-fold lower compared with the CO group, which is in agreement with the upregulated expression of cytochrome P450, family 1, subfamily A, polypeptide 2. The enzyme encoded by this gene can catalyze the conversion of linoleic acid to 9(10)-EpOME and 12(13)-EpOME.
Succinic acid, citric acid, and malic acid are all the intermediate products of tricarboxylic acid (TCA) cycle. Moreover, serine could transfer more carbon skeletons to the TCA cycle for energy production. Previous studies have shown that amino acid catabolism in adipose tissue could provide an essential intermediate for the TCA cycle (Lackey et al., Reference Lackey, Lynch, Olson, Mostaedi, Ali, Smith, Karpe, Humphreys, Bedinger and Dunn2013). In the present study, the concentrations of succinic acid, citric acid and malic acid in the SB group were 1.43, 1.37 and 1.42-fold higher than that in the CO group, respectively. In addition, the concentration of serine was 0.8-fold lower in SB group than that in the CO group, which is in agreement with the increasing expression of serine dehydratase by the SB treatment. Although not statistically significant, these results may indicate that the TCA cycle can be promoted by the SB treatment to some extent. However, the limitation on the small sample size or the individual variation of pigs should be considered in further studies.
Essentially, butyrate is an energy substance. Unlike the intestinal absorption, intravenous infusion of SB causes the entrance of large amounts of butyrate to the liver, which finally breaks down into acetyl-CoA molecules (Astbury and Corfe, Reference Astbury and Corfe2012). Acetyl-CoA can enter into the TCA cycle. In addition, it is a precursor to synthesize fatty acid, ketone bodies, cholesterol and its derivatives. So we speculate that under our experimental condition, the role of butyrate as an energy source (acetyl-CoA donor) is greater than that as the signal molecule to affect the liver metabolism.
Conclusion
The present study investigated the transcriptomic and metabolomic responses induced in the livers of growing pigs by a short-term intravenous infusion of SB. We found that SB could affect the liver metabolism by decreasing fatty acid oxidation and increasing cholesterol metabolism. Our finding is the first discovery on the impact of intravenous SB on the body metabolism of pigs, and so makes a contribution for further understanding the regulating mechanism of butyrate on the body metabolism.
Acknowledgments
This research has received funding from the National Key R&D Program of China (2017YFD0500505), the National Basic Research Program of China (2012CB124705), and the National Natural Science Foundation of China (31572414).
Declaration of interest
The authors declare that the research was conducted in the absence of any commercial or financial relationships that could be construed as a potential conflict of interest.
Ethics statement
None.
Software and data repository resources
The authors declare that the data of this research are not deposited in any official repository.
Supplementary material
To view supplementary material for this article, please visit https://doi.org/10.1017/S1751731118000174