


1 Introduction
The aim of this article is to add to the store of acoustic data pertaining to the vowels of contemporary RP (and near-RP) accent(s) of English. That is to say it hopes to add to the body of knowledge formed by studies such as Wells (Reference Wells1962), Henton (Reference Henton1983), Bauer (Reference Bauer1985), Deterding (Reference Deterding1990, Reference Deterding1997), Hawkins & Midgley (Reference Hawkins and Midgley2005), Fabricius (Reference Fabricius2007), Ferragne & Pellegrino (Reference Ferragne and Pellegrino2010), Wikström (Reference Wikström2013) etc. Unlike many similar studies it does not depend on citation words (typically of the /hVd/ kind) spoken within carrier sentences constructed for the purpose of obtaining the measurements, but rather looks at authentic speech produced while reading news copy (in this respect it is similar to Deterding Reference Deterding1997). In addition to monophthongs, which are the usual target of this kind of acoustic investigation, also analysed were four diphthongs. We were especially interested in obtaining figures on price and mouth diphthongs, as there is little acoustic data concerning RP diphthongs in general, and even less empirical data confirming changes affecting these two diphthongs (unlike e.g. changes such as goose-fronting or trap-lowering, which are already well documented and supported by acoustic data). This kind of investigation, as Wikström (Reference Wikström2013: 39) puts it, besides being of pure scientific interest, is also of educational interest, as it can provide a solid basis for updating current EFL models (viz. Fabricius’ term ‘c-RP’ (= Construct RP) 2002: 358–9).
2 Corpus and method
2.1 The corpus
The corpus comprised broadcasts of one radio and one television news programme: BBC Radio 4 Six O'Clock News and BBC News at Six broadcast on the BBC 1 television channel. The broadcasts examined all took place between September 2014 and January 2015. Only the speech of the main newsreader was analysed (i.e. the speech of various correspondents was ignored); newsreaders with Scottish and Northern Irish accents were also not taken into consideration. This left fourteen speakers whose speech may be broadly characterised as contemporary RP or near-RP (for some additional information on the speakers see below). Generally speaking, we agree with Roach (Reference Roach2014), who says that, if we restrict ourselves regarding broadcast speech in the way described above, what becomes striking
is just how little variation there is, even today. Phoneticians tend to concentrate on small deviations from an imagined norm, but for most purposes I believe there is a remarkably homogeneous body of speakers working for the BBC that provides a valuable model. (Roach Reference Roach2014)
Indeed, Roach has usually preferred terms such as ‘BBC Accent’ or ‘BBC Pronunciation’ instead of ‘RP’ (Roach Reference Roach2014), because, as stated in the English Pronouncing Dictionary (Jones Reference Jones, Roach, Setter and Esling2011: vi), ‘it is the accent most often heard in the speech of newsreaders and announcers on serious channels of the BBC’. Hannisdal (Reference Hannisdal2006: 125–6) writes in a similar vein:
Although it is hard to find RP speakers, it is easy to find RP, as the accent is frequently heard in the broadcast media. In the newscasting genre RP still dominates as the most frequently used accent of English, [in spite] of the changing social status of the variety. Broadcast news is therefore well suited as a source for observing RP in use.
2.2 The speakers
As stated above, the corpus comprised fourteen speakers, seven female and seven male. Three of them (Female Speaker 2 (FS2), Female Speaker 3 (FS3) and Female Speaker 4 (FS4)) are BBC News at Six TV newsreaders, while the remaining eleven are radio newsreaders at BBC Radio 4 Six O'Clock News. Unfortunately, we have not been able to acquire background information for all the speakers. What we did manage to gather is presented below, followed by some remarks regarding specific features which could lead to some speakers’ being labelled as near-RP.
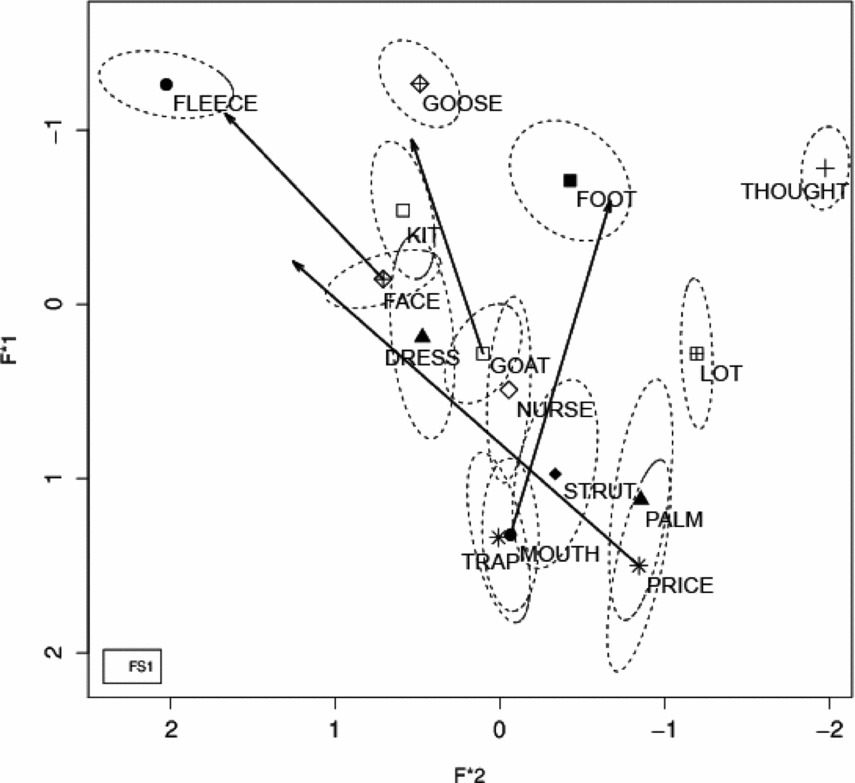
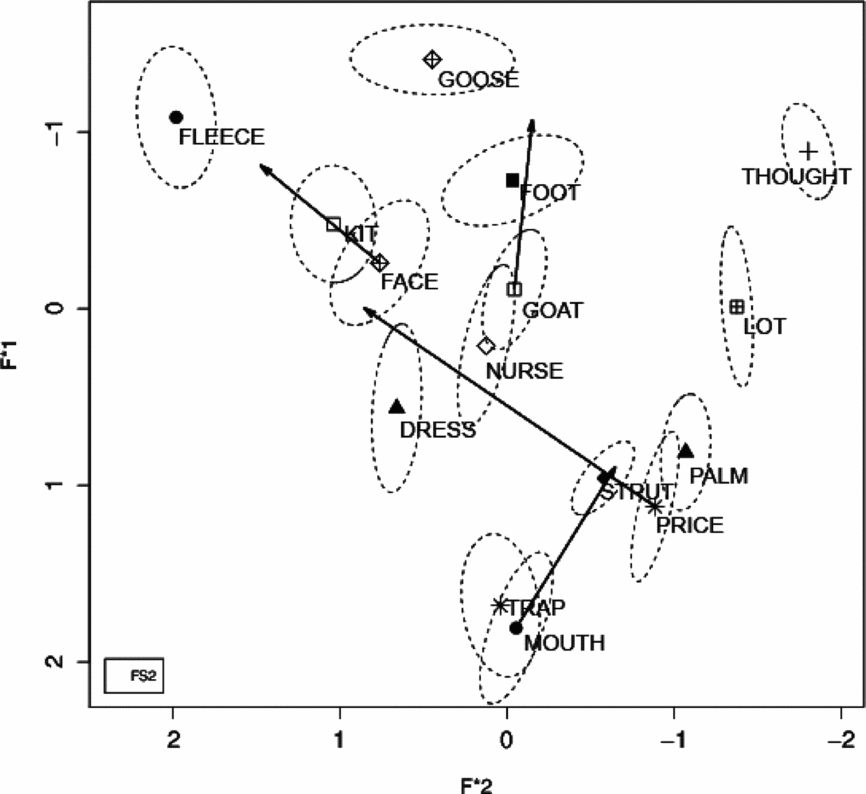
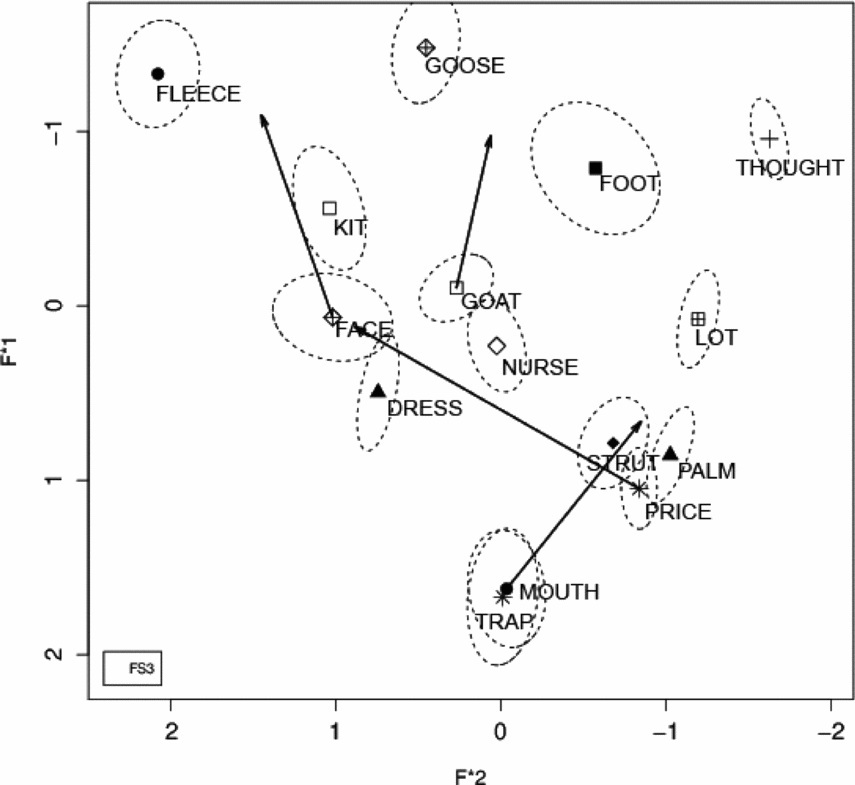
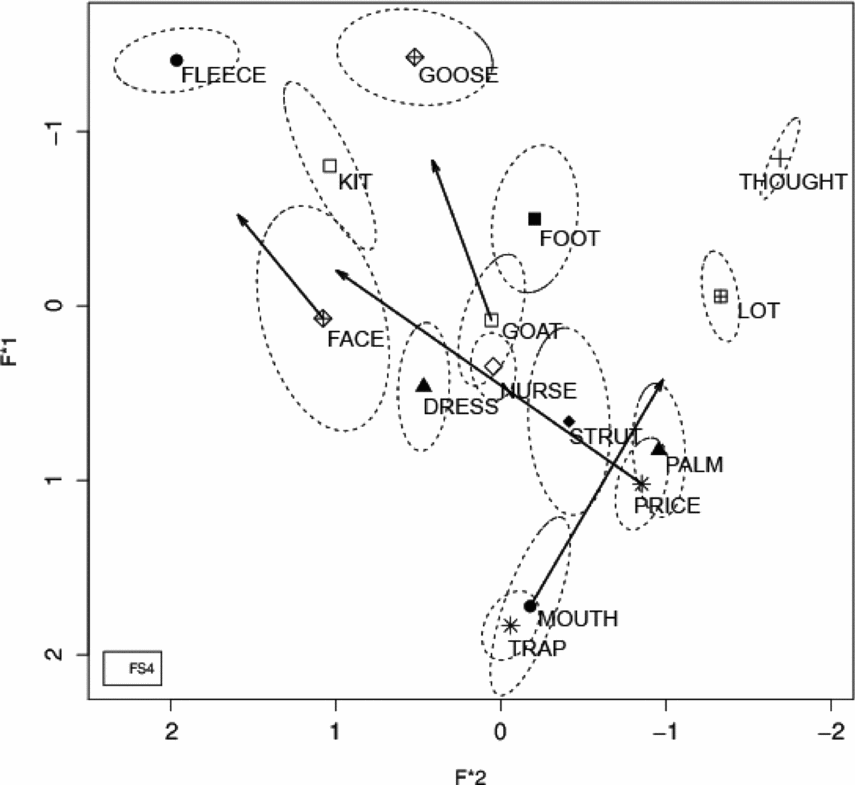
FS1 was born in 1961, educated at Stratford-upon-Avon Grammar School for Girls and at Goldsmiths, University of London. FS2 was born in 1964, went to Gayton Primary School in Heswall, Wirral, the International School of Milan and the Haberdashers’ Aske's Hatcham College in New Cross, London; she studied at Hertford College, Oxford. FS3 was born in 1964, went to King Edward's school in Birmingham and the International School in Calcutta, and studied at Exeter College, Oxford. FS4 was born in 1968 and attended Putney High School and St Paul's Girls’ School in Hammersmith; she studied at the University of Manchester. FS6 was born around 1955 and was raised in Cheshire. FS7 went to boarding school in Kent and graduated from the Royal Scottish Academy of Music and Drama in 1984. We have no data for FS5. MS1 was raised in Bexhill-on-Sea. MS2 was born in 1976 was educated at Northfield St Nicholas Infants School (now Poplars) and then Harris Middle School in Lowestoft and then at Denes High School, a state comprehensive school in the town, followed by the University of East Anglia. MS4 was born in 1966 and grew up in Cumbria. MS5 graduated in 1987 from Cornwall College. MS6 studied at the University of London after which he joined the BBC in 1985. MS7 was born in 1956. We have no data for MS3.
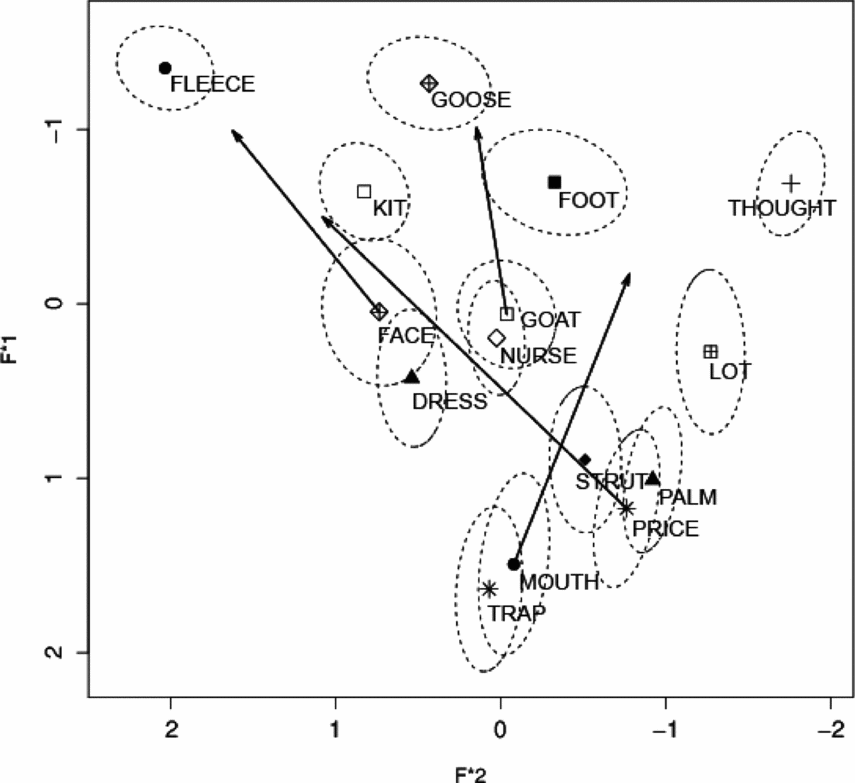
FS6 has clear traces of a north of England accent, inasmuch as she uses the trap vowel in bath words, in addition to which her trap vowel is often somewhat shorter than expected. MS4 likewise has trap in the bath set, and his mouth vowel is of a quality which we would characterise as non-RP (its onset is fronter and closer than trap, almost halfway between trap and dress, i.e. around [æ]); this is why his mouth tokens were exempt from the data plotted in figure 1 below. Finally, in MS5 a not-quite-RP, broadly speaking Southern voice quality can be tentatively detected.
Means of all speakers normalised according to Lobanov (Reference Lobanov1971) using NORM. Ellipses are one standard deviation.

2.3 The method
The vowels analysed were the following (as per usual, lexical set keywords first proposed in Wells Reference Wells1982 are used): kit, dress, trap, foot, strut, lot, fleece, start/palm, goose, thought and nurse monophthongs;Footnote 2 and goat, price, mouth and face diphthongs (both the starting and ending points). The vowels choice, near, square and cure have not been included in this analysis (either due to the dearth of tokens in the corpus, or because the vowel in question is not thought to be undergoing any notable changes in RP, or both), nor have we analysed schwa, happy and thank you, as we confined our analysis to stressed vowels only. A limit of no fewer than seven tokens per vowel per speaker was set. A total of 1,874 tokens were analysed in the end, which yields an average of 8.92 tokens per vowel per speaker.
Regarding the phonetic environment, vowels that were either before or after /w/, /r/, /j/ and /l/ were completely avoided (see Deterding Reference Deterding1997: 49), as these approximants would most likely have noticeable coarticulatory effects. Other sonorants (i.e. nasals or other vowels) were also avoided whenever possible.Footnote 3 The above conditions were somewhat relaxed with the foot vowel, due to its relative infrequency. Specifically, words with prevocalic /l/ and /r/ were admitted, but even so, with one speaker, MS5, only five tokens were analysed. In addition to this, whereas with other vowels we usually succeeded in avoiding measuring more than one example of the same word (thus maximizing the number of different contexts the vowel was measured in), this was not the case with foot (e.g. words such as could (when strong) and look were disproportionately represented). All of this should be borne in mind when considering the results of the present study.
All tokens were analysed manually with Praat speech analysis software (Boersma & Weenink Reference Boersma and Weenink2014), using the get formant function. As is customary (Boersma Reference Boersma, Podesva and Sharma2013: 395), the settings with the cut-off at 5,500 Hz, were used for tracking all female speakers’ formants, but the cut-off was lowered to 5,000 Hz for the analysis of the recordings from the male speakers. A steady-state area around the temporal midpoint of the vowel was where measurements were taken for monophthongs. In cases where no steady state was present, as with some short monophthong tokens, measurements were made at the exact midpoint of the vowel's duration. Regarding diphthongs, to avoid the most obvious consonant coarticulation effects, measurements of the onset part were typically made after the first 12–16 per cent of the vowel's duration (for price there was usually a clear steady state portion close to the beginning, which made measurement of its onset more straightforward); for goat, price, mouth and face the glide was analysed by taking measurements at around 79–85 per cent of the vowel's duration, i.e. close to the endpoint of the vowel. The exact point of measurement was determined taking into account the central tendency of the vowel in question and the maximal value reached (e.g. for mouth onsets both F1 and F2 were measured at the point of highest F1 reached) (see Labov et al. Reference Labov, Ash and Boberg2006: 38). We are aware that a common method involves taking measurements for each diphthong token at the same points (specifically, 20 per cent for the onset and 80 per cent for the glide); however, we feel that with manual measuring it is more appropriate to tailor the measuring point for each individual token.
3 Results and discussion
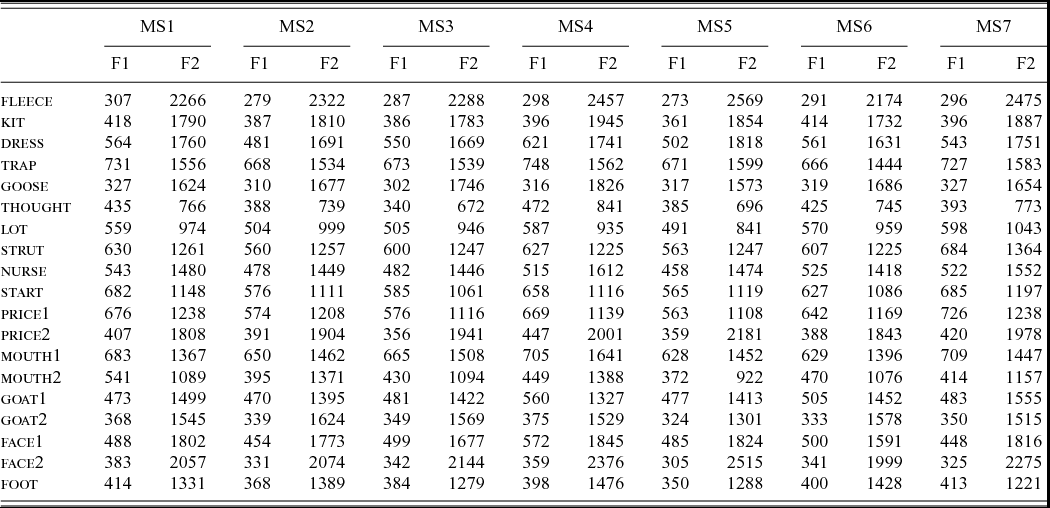
Raw mean F1 and F2 frequencies for each vowel for each speaker are presented in tables A1 and A2 in the Appendix. Here we present a plot with normalised means and ellipses representing one standard deviation (figure 1). Vowels were normalised according to Lobanov's (Reference Lobanov1971) vowel normalisation method, as adapted by Thomas & Kendall (Reference Thomas and Kendall2010), using the NORM vowel normalisation software (Thomas & Kendall Reference Thomas and Kendall2014), which was also used to draw the plot.
We now turn to the discussion of certain specific vowels. Note that in addition to citing similar acoustic studies of RP vowels we shall also be comparing our data to descriptions found in works which have at least to a degree a pedagogical if not a normative purpose (e.g. Cruttenden Reference Cruttenden2014; Collins & Mees Reference Collins and Mees2014; Hughes, Trudgill & Watt Reference Hughes, Trudgill and Watt2012), which could mean that they, in some instances, tend to lean towards more conservative representations.
3.1 Goose
This is a vowel which has been steadily fronting during much of the twentieth century (Gimson Reference Gimson1962; Wells Reference Wells1982, Reference Wells, Casado and Palomo1997). Gimson described it as ‘a back close vowel, but the tongue raising is relaxed from the closest position and is somewhat advanced from true back’ (1962: 114). Wells wrote that it ‘is a relatively long close back vocoid, often with some degree of diphthongization of the [ʊu] type, particularly in free position. It is often somewhat centralized from fully back’ (1982: 147).
If we consider the position of goose on our plot it can be seen that it is somewhat fronter than central (it is situated 58 per cent of the way between the backest vowel, thought, and frontest vowel, fleece). We shall now proceed to compare these results to those in other similar studies, and then we shall briefly survey descriptions found in several contemporary handbooks.
In table 1 the data from Wells (Reference Wells1962), Henton (Reference Henton1983), Bauer (Reference Bauer1985), Deterding (Reference Deterding1990, Reference Deterding1997), Hawkins & Midgley (Reference Hawkins and Midgley2005), Ferragne & Pellegrino (Reference Ferragne and Pellegrino2010)Footnote 4 and the present study are shown. We have included, in this table as well as in other tables below, the data on speakers’ gender (‘M’ or ‘F’), and whether the study analysed citation forms produced while reading controlled carrier sentences (‘cit’), or reading paragraphs of connected text in a real-life or controlled setting (‘con’). We have also included the years of birth for speakers in four age groups from Hawkins & Midgley (Reference Hawkins and Midgley2005).
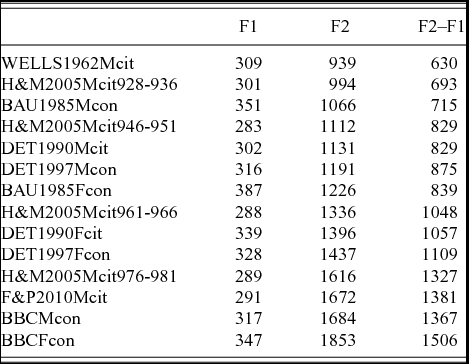
Raw mean F1 and F2 frequencies of goose in various studies, sorted from lowest to highest F2

According to table 1, the highest F2 values (also the highest F2–F1 valuesFootnote 5 ) are produced by the female speakers from our study. This is followed by the male speakers from our study and the youngest group, also male, from Hawkins & Midgley (Reference Hawkins and Midgley2005). Two factors should be taken into consideration while looking at these results: the more obvious one is the age of the speaker – as goose-fronting is a well-established change in progress we should expect younger speakers to have higher F2 values. The other factor is the speech style; as sociolinguists have shown (see e.g. Schilling Reference Schilling, Chambers and Schilling2013 and references therein), typically we should expect more conservative forms, i.e. with less advanced goose-fronting, in speech styles that resemble those in ‘cit’ studies than in those present in ‘con’ studies in table 1 (the former resemble the Word List style in classical sociolinguistic studies, while the latter resemble Reading Passage style). We should also note here that even though in absolute terms our F2 values are higher than those reported by Hawkins & Midgley (Reference Hawkins and Midgley2005), in relative terms, i.e. when we compare our plot (figure 1) with theirs (2005: 187), we see that for their youngest group of speakers (b. 1976–81) goose is 70 per cent of the way between thought and fleece, while for their second youngest group (b. 1961–6) the position is at around 55 per cent of the same distance, compared to our 58 per cent.
Turning now to descriptions found in handbooks, we notice that the fifth edition of English Accents and Dialects shows the frontest position of goose on its plot of RP monophthongs. The authors position it firmly in the near-front section of the chart, as front as some 70 per cent of the distance between the backest and the frontest vowel (Hughes, Trudgill & Watt Reference Hughes, Trudgill and Watt2012: 48). Cruttenden says in the eighth edition of Gimson's Pronunciation of English (2014: 133) that ‘[t]wo types occur within GB:Footnote
6
(i) a more centralised monophthongal vowel [
 ] or, with unrounding, [
 ]; and (ii) a short diphthong [ʊu] or, with unrounding [
 ]’. The chart position for the first variant, i.e. the fronter of the two, is squarely in the top centre, i.e. halfway between the back and the front. Interestingly, Cruttenden also provides formant values of monophthongs from Deterding (Reference Deterding1990, Reference Deterding1997), which show somewhat more conservative values than Cruttenden's impressionistic descriptions.
Collins & Mees in the third edition of Practical Phonetics and Phonology (Reference Collins and Mees2014: 104) show a chart with goose positioned only a third of the way from back to front. Though they add ‘for many NRPFootnote 7 speakers a striking change has occurred in recent years whereby this vowel has become much more fronted and unrounded’ (2014: 106).
Finally, Upton (Reference Upton, Kortmann and Schneider2004), offering neither a plot nor formant values, provides a quite conservative description:
In all forms this is a long high back vowel with lip rounding. The characteristic point of RP articulation is slightly relaxed from fully raised, and also somewhat advanced, with fronting becoming evident among many speakers, especially the young. (2004: 225)
3.2 Foot
The vowel in foot seems to have been following the fronting of goose described above. Thus, Wells (Reference Wells1982: 133) described it as ‘a relatively short, lax, fairly back and fairly close vocoid [ʊ]’, but Wells (Reference Wells, Casado and Palomo1997), writing about both foot and goose, says:
Traditionally classified as back and rounded, these vowels are not only losing their lip-rounding but also ceasing to be very back. Thus spoon, conservatively [spuːn], may now range to a loosely rounded [spʊʉn] or even [spɪɨn], while good /gʊd/ is often pronounced with a schwa-like quality.
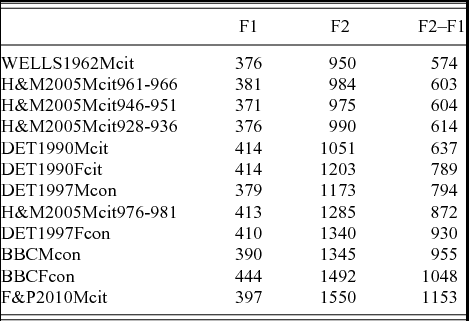
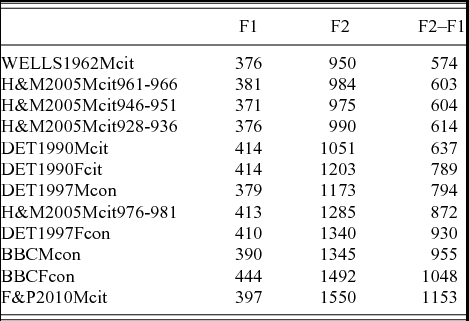
On our plot (figure 1), foot is actually not only less front than goose, but also less front than the central nurse and onset of goat, though only somewhat. We have displayed the raw data from various other studies in table 2.
Raw mean F1 and F2 frequencies of foot in various studies, sorted from lowest to highest F2
Upton (Reference Upton, Kortmann and Schneider2004: 223) says ‘quite uncontroversially, this is realized as a half-close and advanced rounded vowel in all types of RP’. He presumably means somewhat advanced compared to fully back, as he describes the glide of goat (see below) as moving ‘to or in the direction of RP /ʊ/, giving [əʊ]’.
Hughes et al. (Reference Hughes, Trudgill and Watt2012: 48) show foot on their plot as being slightly fronter than central, which, compared to other central vowels on their chart, means slightly backer than nurse and non-final schwa, but fronter than final schwa. They add that ‘[f]or many younger RP speakers the vowel has fronted and unrounded to a quality close to [ə]. Some have taken this process so far that /ʊ/ can quite easily be mistaken for /ɪ/’(2012: 51).
Collins & Mees (Reference Collins and Mees2014: 103) write that ‘foot is often unrounded and central, especially in the high-frequency word good’.
Cruttenden (Reference Cruttenden2014: 130–1) says that foot is ‘pronounced with a part of the tongue nearer to centre than to back raised just above the close-mid position’ and adds that this vowel ‘has moved forward recently and there is an increasing tendency for it to be unrounded’. The symbols he offers are [ö] and [
 ], or [
 ] and [
 ]; the fronter of the two positions plotted on his vowel chart is exactly as front as, but of course more open than, the fronter of his goose variants (see above).
3.3 Goat
Our results (figure 1) suggest a vowel with a mid-central starting point, overlapping with nurse, whose glide is somewhat fronter than central and approaching the fronted goose.
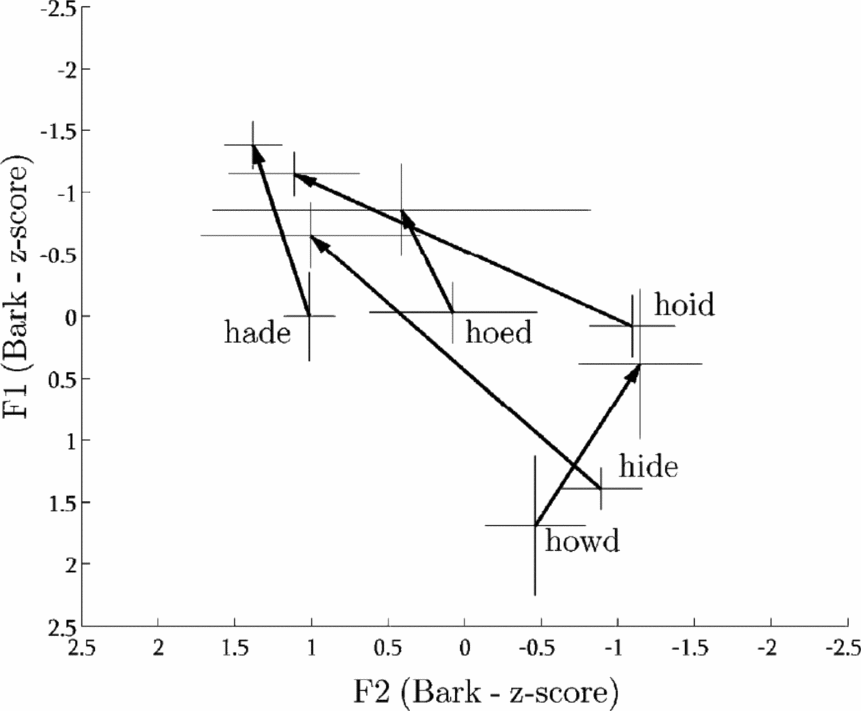
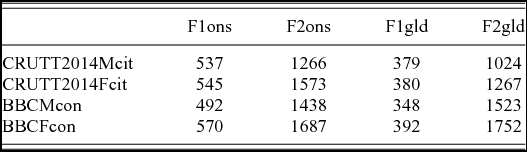
Comparable studies of formants typically focus on monophthongs while completely ignoring diphthongs. One exception is Cruttenden (Reference Cruttenden2014: 105), who does offer formant values for diphthongs (another exception would be Ferragne & Pellegrino Reference Ferragne and Pellegrino2010; however, regarding diphthongs they only provide a plot, which is reproduced in figure 2, with five starting points and glides, and no raw formant values; for some further comments on their study see below under price and mouth). Unlike his monophthong values, which are taken from Deterding (Reference Deterding1990) and (Reference Deterding1997), these were obtained by Cruttenden himself in 1993 (see table 3). He used three male and three female speakers (aged 35–55, i.e. born between 1938 and 1958), and recorded them reading carrier sentences (Alan Cruttenden p.c.).
An F1/F2 graph for SSE diphthongs with z-scored Bark frequencies (from Ferragne & Pellegrino Reference Ferragne and Pellegrino2010)

Raw mean F1 and F2 frequencies of goat onset and glide from Cruttenden's 1993 study (reported in Cruttenden Reference Cruttenden2014:105) and from the present study
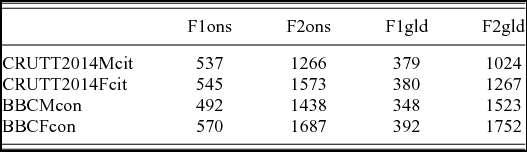
Cruttenden's (2014: 147) impressionistic chart positions for GB goat include both [əʊ] and [ə
] with a near-back second part, but also [əʉ] with the glide ending at a position somewhat fronter than central, in line with our results.
Collins & Mees (Reference Collins and Mees2014: 107–8) only show the variant [əʊ], with the conservative symbol for the glide, but add that ‘many NRP speakers now have a more front articulation’.
The only variant Hughes et al. (Reference Hughes, Trudgill and Watt2012: 53) show has the glide ending in a central position, i.e. somewhat more conservative than the more progressive of the two Cruttenden's inconspicuous GB options.
Upton (Reference Upton, Kortmann and Schneider2004: 225) again opts for the conservative value, saying that the glide of goat moves in the direction of RP foot, ‘giving [əʊ]’.
We also reproduce a plot (figure 2) from Ferragne & Pellegrino (Reference Ferragne and Pellegrino2010) with five diphthongs, on which the position of goat is quite similar to that on our graph in figure 1. Notice also that, strikingly, the glides of goat and mouth differ greatly on both plots. The glide of the latter, unlike the glide of the former, seems not to exhibit the fronting shown by foot and goose (but see some further discussion below in section 3.4 ). Finally, one thing that should be borne in mind when observing goat on vowel plots is the fact that, as Thomas (Reference Thomas2001: 30) puts it:
Because rounding increases through the course of the [goat] diphthong and rounding decreases F2, front-gliding [goat] appears on the vowel formant plots not only when the vector moves leftward (i.e., when F2 increases), but also when the vector moves straight upward (i.e., when F2 shows little change).
3.4 Trap
The vowel in this lexical set was lowering throughout the mid-to-late twentieth century (Gimson Reference Gimson1962; Wells Reference Wells1982, Reference Wells, Casado and Palomo1997). The position of trap on our plot (figure 1) seems to unequivocally support Cruttenden's (Reference Cruttenden2014) decision to adopt /a/ as the symbol for it, but this is probably the least controversial of our findings.
Upton (Reference Upton, Kortmann and Schneider2004), who, as we have seen so far, tends to veer to more traditional qualities in this description of RP (although his adoption of new symbols for RP has been among the more progressive ones, with e.g. /a/ for trap, /ɛ/ for dress and /ɛː/ for square as early as 1995 (see Wells Reference Wells2001)), thinks that:
the movement by younger speakers from trad-RP [æ] to RP [a] is arguably one of the most striking changes that has taken place in the accent group in recent years (Upton Reference Upton, Kortmann and Schneider2004: 222)
and adds that:
this trad-RP to RP change is a matter of which British English native-speakers are aware[.] It is also coming to be remarked upon in the usually conservative English Language Teaching field[.] (Upton Reference Upton, Kortmann and Schneider2004: 222)
Wells (Reference Wells1982: 129) described it as ‘a front nearly open unrounded vocoid, [æ], approximately halfway between cardinals 3 and 4’. He adds, however, that there is a trend ‘towards an opener, [a]-like, monophthongal quality in England’ and that ‘[f]ully open qualities, [a] or [a-], are typical of the north of England, most of Wales, and Ireland’ (Reference Wells1982: 129).
Cruttenden (Reference Cruttenden2014: 120) shows on his impressionistic chart two qualities for trap, one corresponding to Wells’ description, halfway between cardinals 3 and 4, and the other exactly matching cardinal 4. Collins & Mees (Reference Collins and Mees2014: 102) retain the traditional symbol /æ/ but describe the vowel as ‘front open’ and position it as only very slightly closer than fully open on their chart.
Finally, Hughes et al. (Reference Hughes, Trudgill and Watt2012: 48–9), like Cruttenden (Reference Cruttenden2014), also use /a/ as the symbol for trap, but on their chart show only the fully open quality and add that ‘[o]lder and more conservative speakers continue to realise /a/ as the closer, fronter vowel [æ]’.
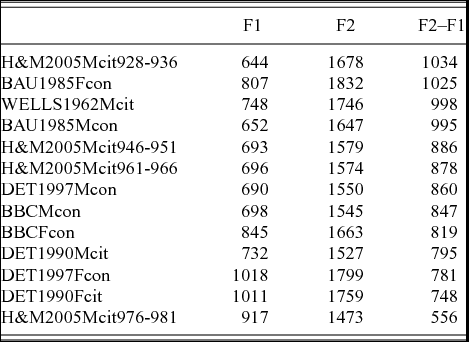
Table 4 shows trap frequencies sorted according to the F2–F1 value; high F2–F1 values would suggest a closer and/or fronter quality, while lower values suggest an opener and/or retracted quality.
Raw mean F1 and F2 frequencies of trap in various studies, sorted from highest to lowest F2–F1
3.5 Price and mouth
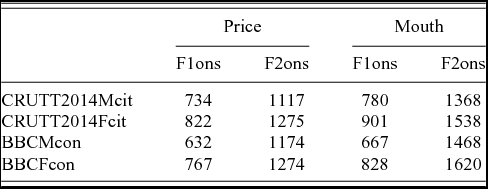
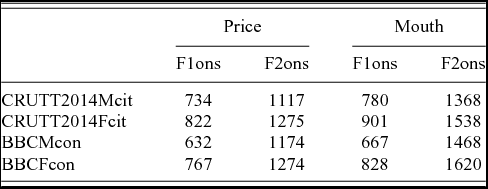
As with goat, the only raw formant values we can compare our results with are those reported in Cruttenden (Reference Cruttenden2014: 105) (table 5).
Raw mean F1 and F2 frequencies of price and mouth onset from Cruttenden's 1993 study (reported in Cruttenden Reference Cruttenden2014:105), and from the present study
In terms of impressionistic descriptions, Wells (Reference Wells1982: 292) wrote that ‘in RP the starting-point of /aʊ/ is never fronter than the starting-point of /aɪ/’.
Cruttenden (Reference Cruttenden2014), as with goat, offers two inconspicuous options for GB price: the first one is almost fully front, and the second one is central (Reference Cruttenden2014: 143). For mouth, one variant is somewhat fronter and the other somewhat backer from central (roughly at 72 and 38 per cent of the way from back to front on the plot) (2014: 149). In other words, Cruttenden does allow for the onset GB mouth to be fronter than that of price, but with the latter being central and former only slightly fronter than central.
Collins & Mees (Reference Collins and Mees2014: 107) show on their chart price being only slightly behind the central position, with mouth being only slightly fronter.
Hughes et al. (Reference Hughes, Trudgill and Watt2012: 53) also show mouth being fronter than price, with the latter being a little fronter than central (at 62 per cent of the distance from back to front on the plot), and former being at around 85 per cent of the way from back to front.
Upton (Reference Upton, Kortmann and Schneider2004: 225) writes regarding price that the ‘startpoint is conventionally set at [a]. However, . . . the RP start-vowel can in fact be at any point from centralized front to centralized back, and is raised from the fully open position’, and regarding mouth that it ‘begins near the front open position, lips spread: some retraction is to be expected, although this is not considerable’.
Turning to Ferragne & Pellegrino's (Reference Ferragne and Pellegrino2010) results presented in figure 2, a few points should be stressed regarding their study. Firstly, the plot reproduced here pertains to the variety referred to as ‘SSE’ (Standard Southern English), which the authors ‘equate with what others label RP’ (2010: 8). The results they obtained, however, come from six male speakers who all come from London (Ferragne & Pellegrino used The Accents of the British Isles corpus (ABI), which required subjects ‘to have been born in that location and to have lived there all of their lives’ (D'Arcy et al. Reference D'Arcy, Russell, Browning and Tomlinson2004: 116)). This should be borne in mind, we feel, when considering the data from their study. Concerning the position of price and mouth specifically, the authors themselves comment saying ‘given that our subjects have all been recorded in London, it may well be that their type of Standard English is influenced by local features such as the price-mouth Crossover’.
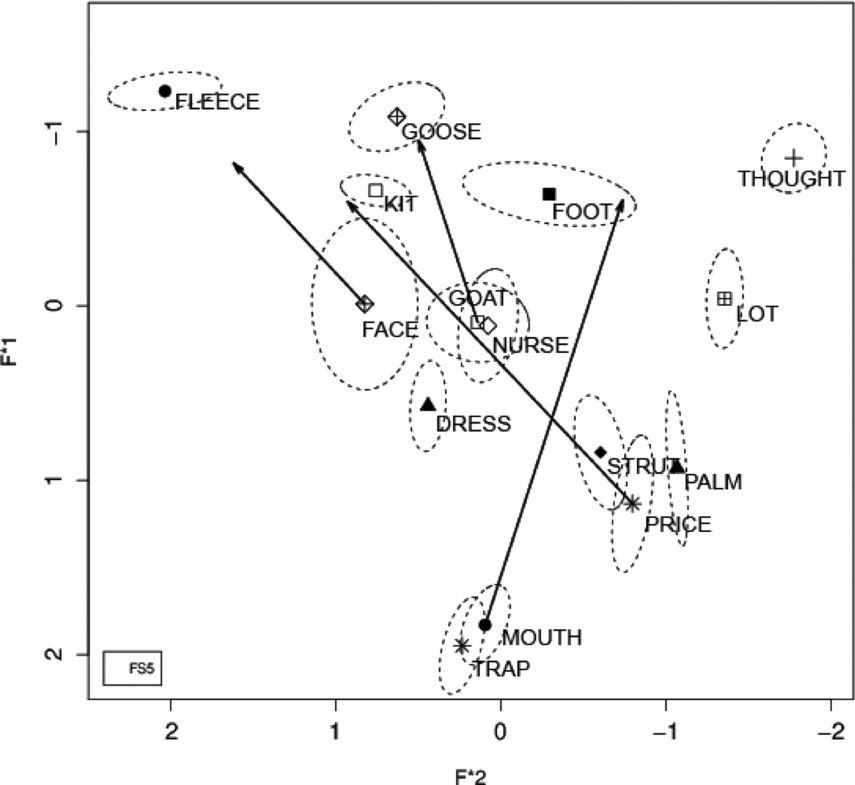
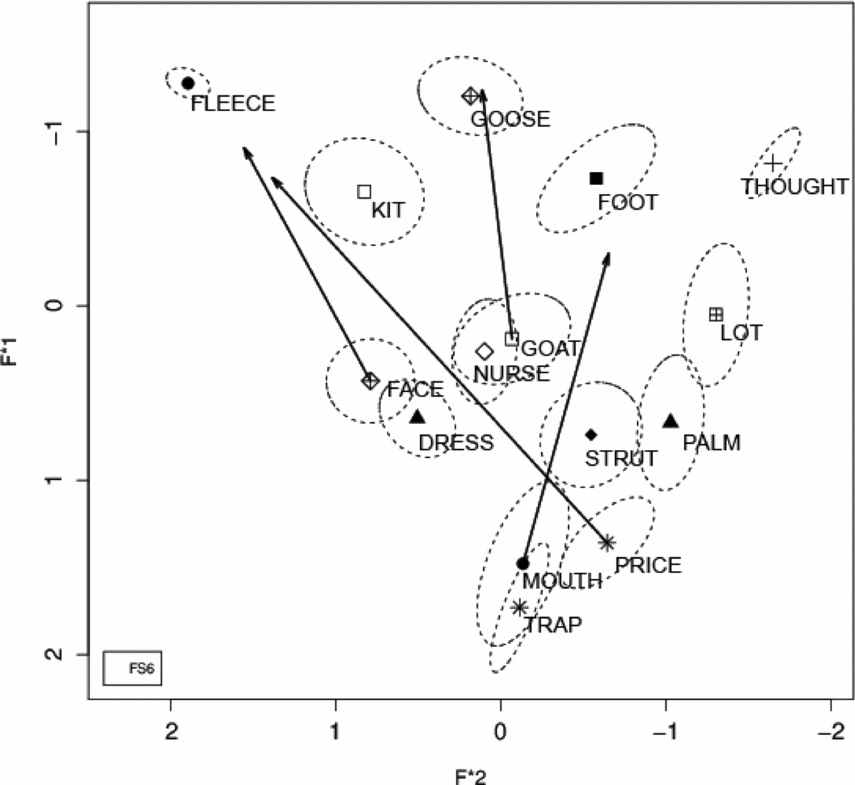
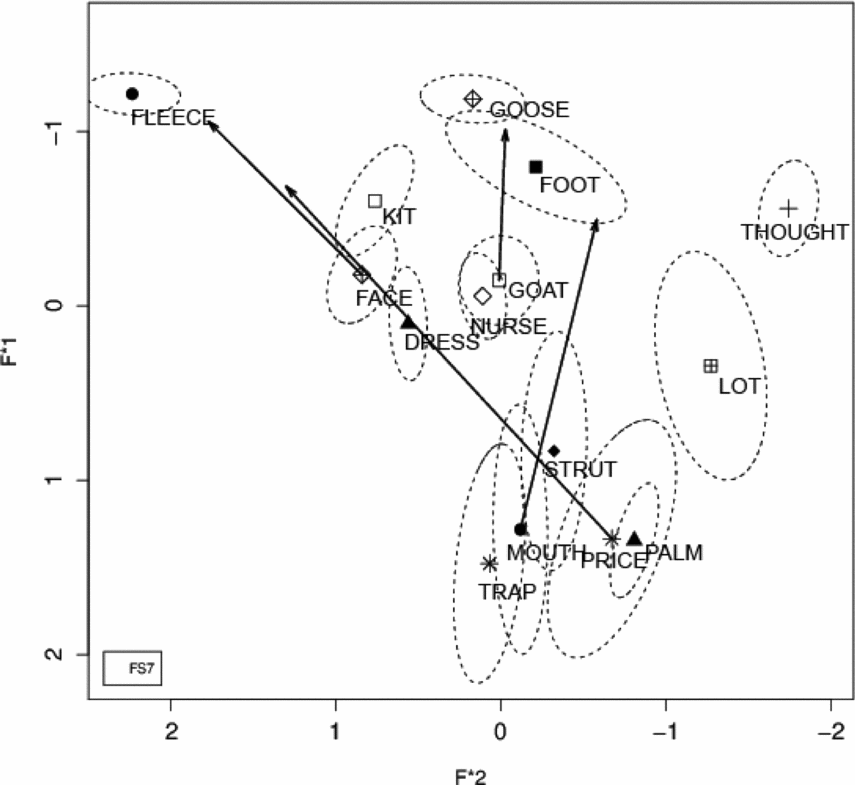
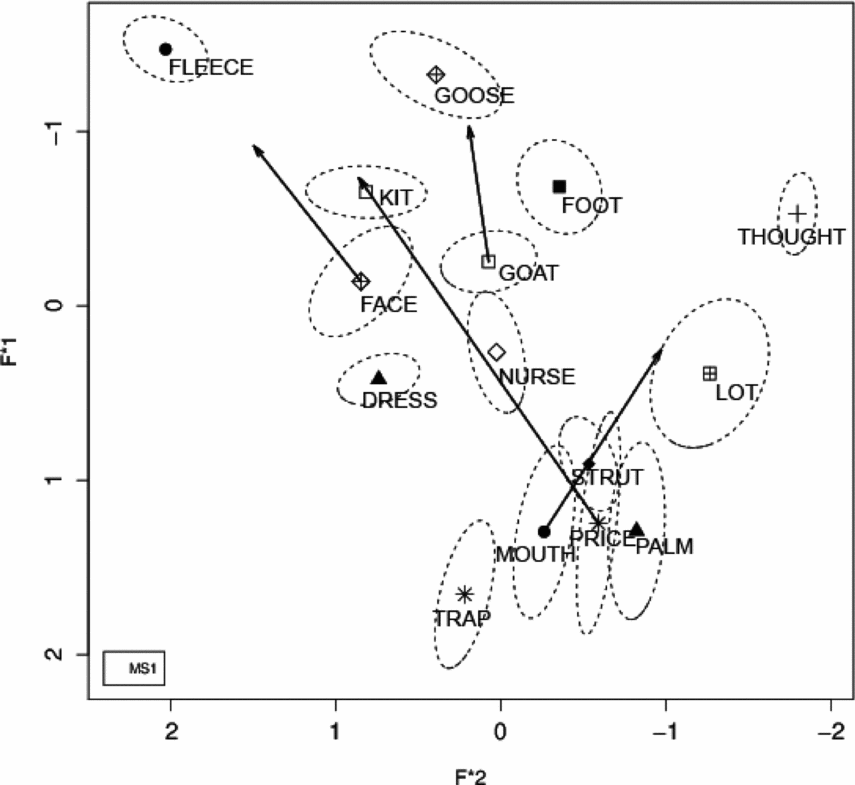
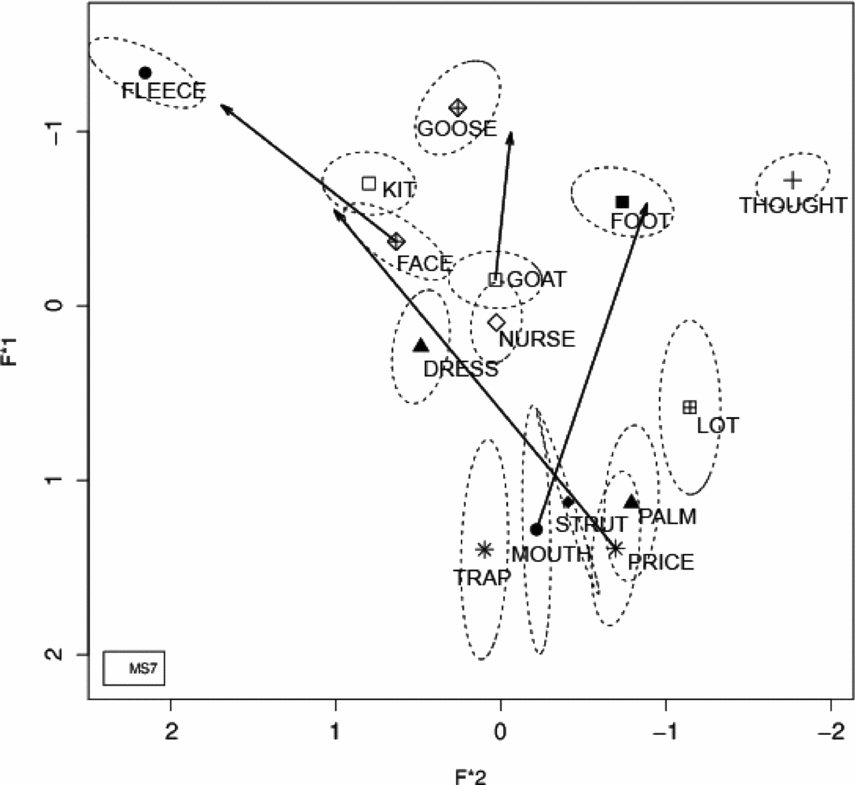
It is interesting, then, to see that our data (figure 1), coming from both male and female speakers of more varying backgrounds, show a very similar relationship between these two diphthongs. What's more, not only is the onset of price backer than that of mouth, but, strikingly, they are not even close to overlapping for most of our 14 speakers (see the individual plots in the Appendix). The only exceptions are MS1, FS6 and FS7, for whom the standard deviation ellipses for mouth and price touch. It should be pointed out, however, that on the aggregate plot (figure 1) mouth is not quite as front as trap, nor is price quite as back as palm/start. Nonetheless, Lindsey (Reference Lindsey2014) does not seem to be wrong in suggesting a switch to /ɑɪ/ (/ɑj/ in his system) for price (see the Conclusion for a discussion of the symbols).
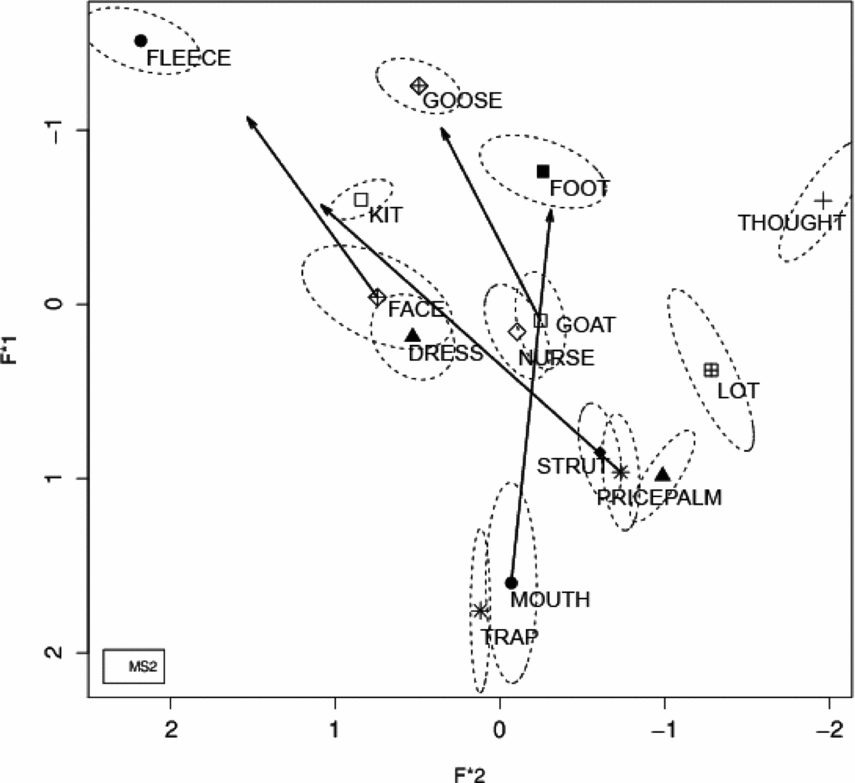
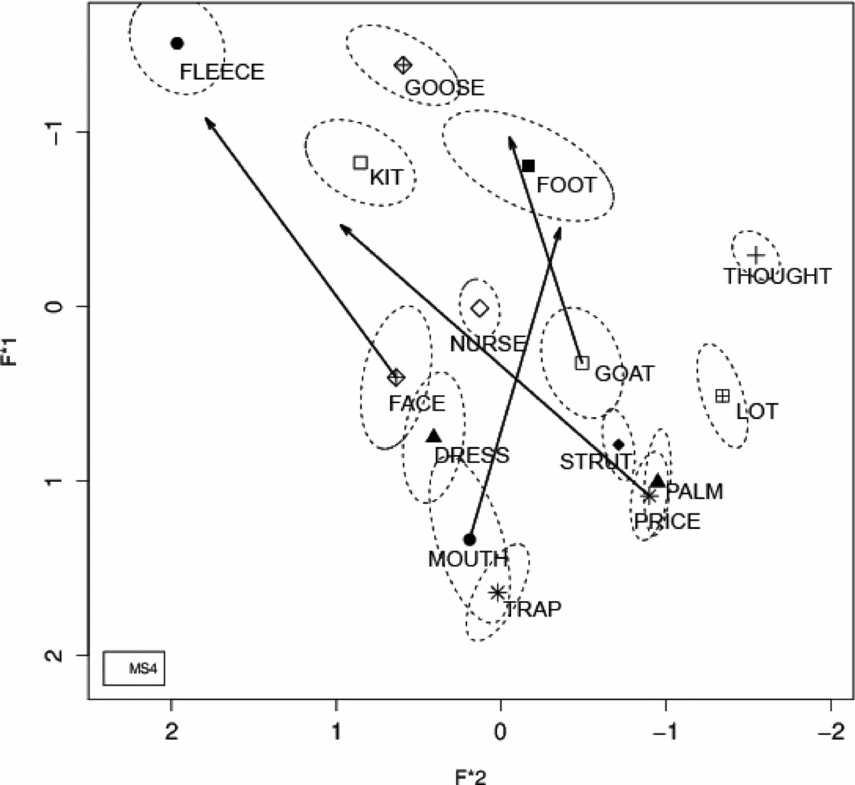
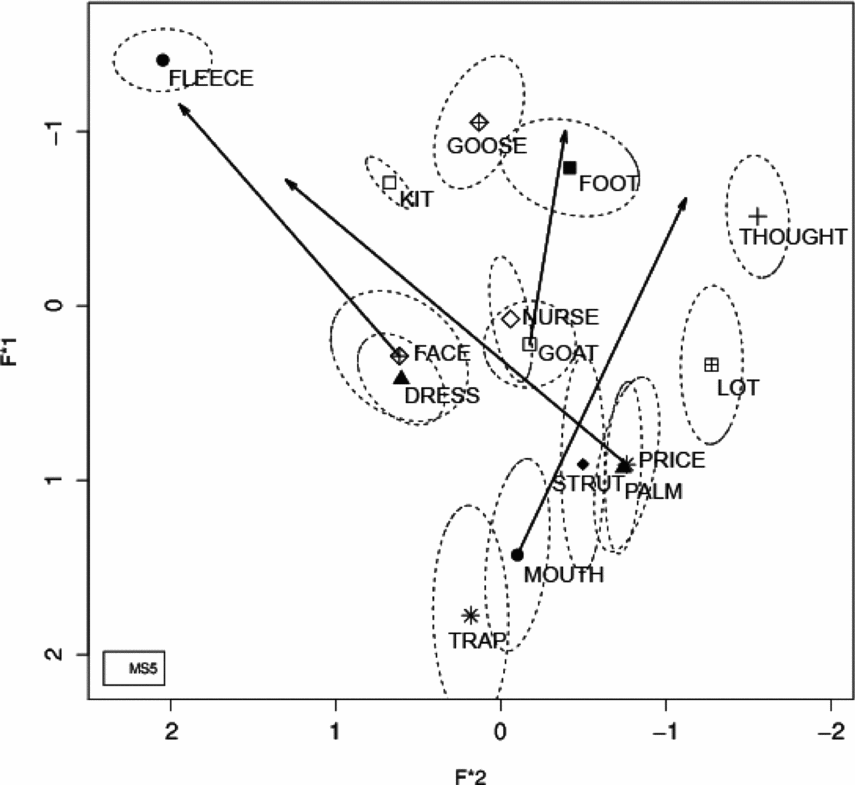
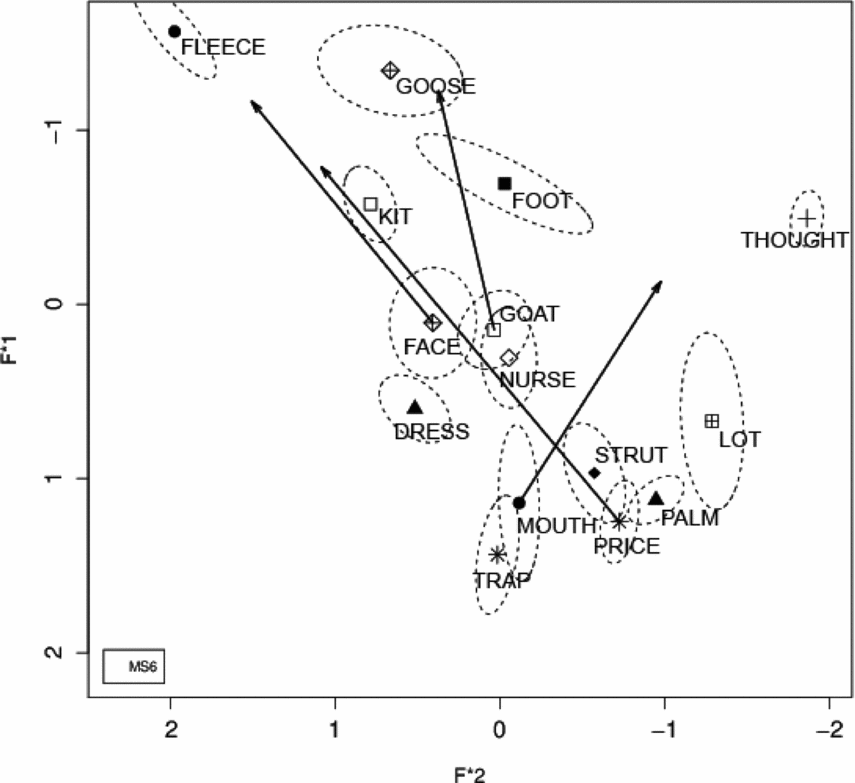
Looking at individual plots (included in the Appendix), we can see that mouth and trap largely overlap for FS1, FS2, FS3, FS4, FS5, FS6 and MS3; they somewhat overlap for MS6 and FS7, whereas they do not overlap for MS1 MS2, MS5 and MS7.
As for price and palm, they somewhat overlap for FS1, FS2, FS3, FS4, MS2, MS3, MS4, MS6 and MS7; they completely overlap for FS7 and MS5, whereas they do not overlap for FS5, FS6 and MS1.
Finally, as stated above under goat, it seems that the glide of mouth is not exhibiting the fronting that the glide of goat does. The speakers, however, do show some interesting variation in this respect. Namely, for FS2, FS3, FS4, MS1, MS3, MS5 and MS6 the glide of mouth seems to be in the general direction of thought (i.e. it is unfronted), whereas for FS1, FS5, FS6, FS7, MS2, MS4 and MS7 it seems to be in the direction of their foot; for the majority of speakers in both these subgroups, however, the glide of goat moves in the direction of goose.
4 Conclusion
Here we will sum up the most important findings and briefly reiterate some general points regarding this study, before suggesting how our findings could reflect on the possible alterations to the IPA symbols used to transcribe RP phonemically.
We believe that the aggregate vowel plot in figure 1 largely speaks for itself; in addition to it, raw formant frequencies are provided in the Appendix. The most important finding to our mind concerns the data on price and mouth onsets: the onsets overlap for just three speakers out of 14 (or 13 if we don't count MS4), but even then mouth is consistently fronter than price.
Another important finding concerns the apparent fronting of the glide of goat, which seems to primarily follow goose, and the absence of such fronting in the glide of mouth, which we decided to reflect in our suggestions for the phonemic symbol changes (see below in section 4.1). In addition to this, we have provided further confirmation of goose-fronting: for all 14 speakers goose was fronter than nurse and the onset of goat, which largely overlap at the centre of the vowel space. Finally, we should stress one more time that the results we provide ameliorate somewhat the dearth of acoustic data regarding the diphthongs of this variety of English.
What should probably be pointed out one more time is that the speech analysed here is neither spontaneous, unrehearsed connected speech, such as that produced in a sociolinguistic interview for example, nor speech produced by reading individual carrier sentences, but speech produced while reading news copy. This should be borne in mind when comparing our results to those obtained in other studies (for example, Deterding Reference Deterding1997 uses data from BBC broadcasts made in the 1980s (MARSEC database, Roach, Knowles, Varadi & Arnfield Reference Roach, Knowles, Varadi and Arnfield1993); on the other hand, Wells (Reference Wells1962), Henton (Reference Henton1983), Deterding (Reference Deterding1990) and Hawkins & Midgley (Reference Hawkins and Midgley2005) use recordings of carrier sentences containing the /hVd/ context (i.e. words such as hid, heed etc.), whereas Bauer (Reference Bauer1985) used recordings of ‘The Story of Arthur the Rat’). As Deterding pointed out with regard to his own study, ‘we have no way of knowing how the BBC speakers might have produced citation words’, but as he adds, ‘as these vowels are taken from connected speech, they represent somewhat more natural data than the rather artificial vowels derived from specially articulated citation speech’ (Deterding Reference Deterding1997: 54).
4.1 New symbols
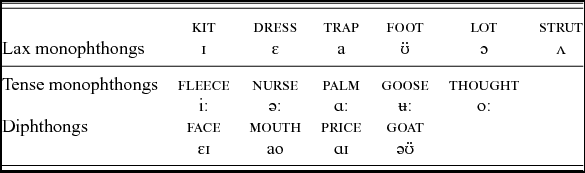
In table 6 we present tentative substitutions for some of the symbols conventionally used to transcribe RP phonemically. The traditional symbols widely used today (in e.g. the Longman Pronunciation Dictionary and the English Pronouncing Dictionary) are in fact a broad phonetic reflection of an older version of prestige British pronunciation (Lindsey Reference Lindsey2014). It may be argued that a phonemic transcription need not consider phonetic reality as one of its priorities, and that simplicity and tradition should take precedence (see e.g. Wells Reference Wells2008, Reference Wells2009, Reference Wells2010, Reference Wells2012). Nonetheless, we feel that the time has come for a ‘tectonic shift in the notation of English vowels’ (Wells Reference Wells2012).
Proposed symbols for the phonemic transcription of RP
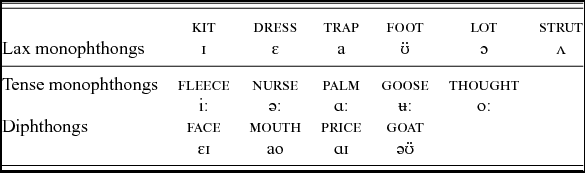
The switch from /æ/ to /a/ for trap has already been made by various authorities (see above in section 3.4). The switch from /e/ to /ɛ/ for dress has been made by Upton (in e.g. the Concise Oxford English Dictionary, starting from the 1995 edition; see Wells Reference Wells2001), and is also advocated by Lindsey (Reference Lindsey2014). Lindsey also proposes a matching switch to the nucleus of face (so /ɛj/ in his system). In other words, we have /e/ and /eɪ/ in the traditional system, /ɛ/ and /ɛj/ according to Lindsey, and /ɛ/ and /eɪ/ used by Upton. The difference in quality displayed in figure 1 could vindicate Upton's choice (only for MS5 do they completely overlap), but we tend to think that, for the sake of simplicity, retaining matching symbols is probably advisable.
The switch from /ɒ/ to /ɔ/ for lot and from /ɔː/ to /oː/ for thought has also been proposed by Lindsey (Reference Lindsey2014), and reflects contemporary qualities, closer than those current in Jonesian times (see also Wikström Reference Wikström2013). We also propose new symbols for goose and foot which would reflect contemporary central values, namely /ʉː/ and /
 / (note that Lindsey Reference Lindsey2014 proposes /ɵ/ for foot). This way the counter-clockwise shift of these four monophthongs is addressed. Related to it is the change of the second symbol, i.e. the one representing the glide, in goat, which then becomes /ə
/. On the other hand, considering that the glide of mouth does not seem to be fronting, or at least not as much, we are suggesting /ao/ as the new symbol for it (although see the discussion above in section 3.5, on the basis of which it could be argued that /a
/ is more appropriate for mouth and əʉ/ for goat). This breaks up the symmetry of the current system in using the lax vowel symbols of kit and foot for all diphthong glides. One way of retaining this neatness would be to use tense monophthong symbols for glides and thus have /əʉ/ for goat and /ɛi/ and /ɑi/ for face and price respectively (and choice, for which we have no data presently). We would consider such a system as appropriate as the one presented in table 6. Finally, as regards nurse, both Upton and Lindsey use /əː/, and we have decided to follow suit.
Appendix
Means of FS1 normalised according to Lobanov (Reference Lobanov1971) using NORM. Ellipses are one standard deviation.

Means of FS2 normalised according to Lobanov (Reference Lobanov1971) using NORM. Ellipses are one standard deviation.

Means of FS3 normalised according to Lobanov (Reference Lobanov1971) using NORM. Ellipses are one standard deviation.

Means of FS4 normalised according to Lobanov (Reference Lobanov1971) using NORM. Ellipses are one standard deviation.

Means of FS5 normalised according to Lobanov (Reference Lobanov1971) using NORM. Ellipses are one standard deviation.

Means of FS6 normalised according to Lobanov (Reference Lobanov1971) using NORM. Ellipses are one standard deviation.

Means of FS7 normalised according to Lobanov (Reference Lobanov1971) using NORM. Ellipses are one standard deviation.

Means of MS1 normalised according to Lobanov (Reference Lobanov1971) using NORM. Ellipses are one standard deviation.

Means of MS2 normalised according to Lobanov (Reference Lobanov1971) using NORM. Ellipses are one standard deviation.

Means of MS3 normalised according to Lobanov (Reference Lobanov1971) using NORM. Ellipses are one standard deviation.

Means of MS4 normalised according to Lobanov (Reference Lobanov1971) using NORM. Ellipses are one standard deviation.

Means of MS5 normalised according to Lobanov (Reference Lobanov1971) using NORM. Ellipses are one standard deviation.

Means of MS6 normalised according to Lobanov (Reference Lobanov1971) using NORM. Ellipses are one standard deviation.

Means of MS7 normalised according to Lobanov (Reference Lobanov1971) using NORM. Ellipses are one standard deviation.

Mean formant frequencies of female speakers (Hz)

Mean formant frequencies of male speakers (Hz)