


Introduction
The mechanical response of glaciers to jökulhlaups (glacier outburst floods) has received scant attention. Reference Roberts, Russell, Tweed and KnudsenRoberts and others (2000) described fractures formed near the glacier terminus, perhaps owing to very high water pressure. Collapse features thought to represent the trace of subglacial drainage tunnels have been described by, for example, Reference BjörnssonBjörnsson (2002). Here we describe some aspects of the mechanical response of Kennicott Glacier, Alaska, USA, to filling and drainage of ice-marginal Hidden Creek Lake (HCL). We focus here on the part of the glacier adjacent to the lake and describe how flow and deformation within that domain is driven by filling and drainage of the lake. For brevity, we refer to this domain as the ‘ice dam’. It is likely that the drainage divide that must be breached to allow lake drainage lies at the bed beneath the ice dam, but we do not address that issue here.
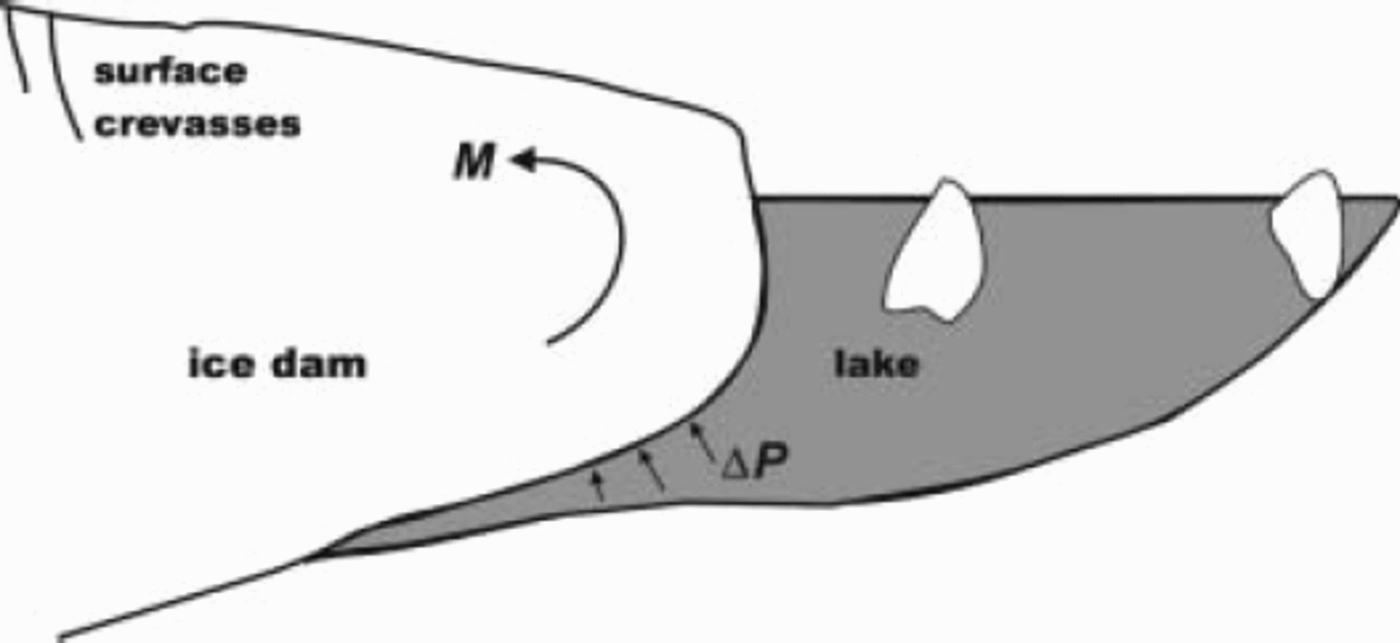
Reference NyeNye (1976, p. 186–187), in his classic paper on jökulhlaups from Grímsvötn, Iceland, suggested that as an ice-dammed lake filled, a wedge of water would penetrate beneath the ice dam and incrementally jack the ice off its bed. He described this scenario as an ‘inverted cantilever’ and argued that the ice dam would ‘be subject to a buoyancy force which will bend it upwards’ because isostatic adjustment is not instantaneous (Fig. 1). With Nye’s hypothesis in mind, we anticipated that the measured response of the HCL ice dam would be explicable in terms of a flexural model with physically reasonable values of pertinent material parameters. It turns out, however, that the data cannot be so explained. The ice dam does indeed respond mechanically to filling and drainage of the lake, but this response is dominated by movement along steeply dipping faults that probably cut the glacier from surface to bed.
Schematic cross-section (not to scale) through ice dam and marginal lake to illustrate the flexural hypothesis of Reference NyeNye (1976). Flow of the main glacier is into the page. Water pressure exerted on the base of the ice dam locally exceeds ice pressure by an amount ΔP, resulting in a bending moment M on the ice dam.
Field Site
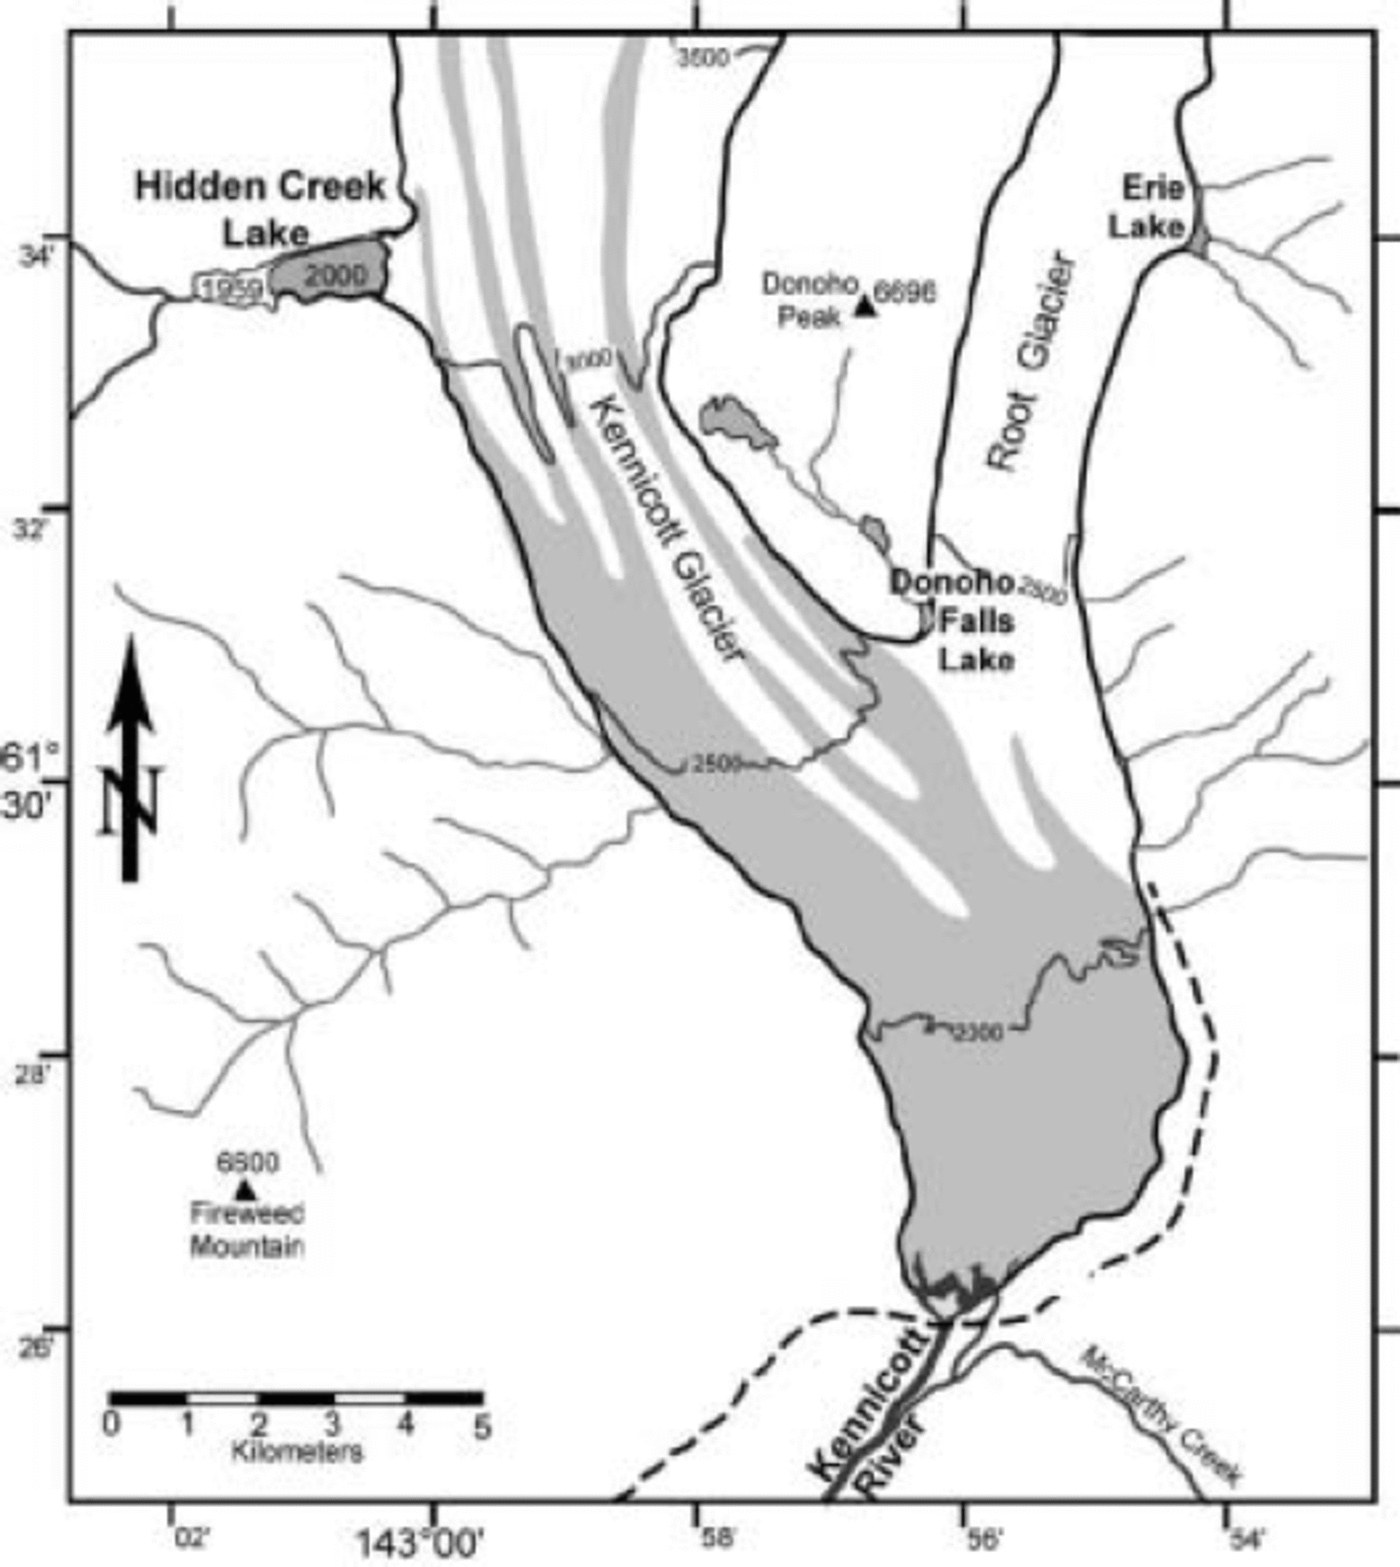
HCL forms within the largest deglaciated tributary to Kennicott Glacier, Wrangell Mountains, south-central Alaska (Fig. 2). The lake is located about 16km from the terminus, in the ablation zone. The glacier intrudes about 800m up the valley of Hidden Creek; for brevity, we will refer to this part of the glacier as the ‘ice dam’, the surface of which is spanned by open fractures, commonly concave towards the lake. At maximum level, HCL has a surface area of about 1 km2, a depth near the ice dam of at least 100 m, and a volume of about 20–30 × 106m3. Background information about HCL, Kennicott Glacier and the history of HCL jökulhlaups may be found in Reference Rickman and RosenkransRickman and Rosenkrans (1997). Hydrologic and hydrochemical observations of the HCL jökulhlaups of 1999 and 2000 have been reported by Reference AndersonAnderson and others (2003a, Reference Anderson, Longacre and Kraalb).
Map showing location of Hidden Creek Lake relative to Kennicott Glacier. The maximum extent of the lake in 1959 and 2000 is indicated. Elevation contours on the glacier and surface elevation of peaks (triangles) are given in feet (1 ft = 0.305 m).
Field Methods
In 2000, we monitored motion of the glacier surface within and near the ice-dam area for several weeks, including the roughly 2 day period of lake drainage. A total of 22 survey targets were set up (Fig. 3), the three nearest the lake with helicopter support. A comparable effort had been made in 1999, but the lake began to drain only hours after we reached the field area. Here we discuss only data from summer 2000. The sparser 1999 data will be discussed and compared to the 2000 data elsewhere.
Map of survey targets on the glacier. Strain in the triangular elements indicated is shown in Figure.8.

A surveying total station was set up on a bedrock knob north of the ice dam. The absolute position of the survey station was determined by using the global positioning system (GPS) and referencing the results to a GPS base station positioned on a US Geological Survey benchmark. Lake level was referenced to the same datum. The probable error in survey measurements is about 10 mm.
Radar operated at either 5 or 10MHz was used to make spot measurements of ice thickness. Transmitting and receiving antennae were separated at their centers by 60 m. Owing to glacier surface conditions, the radar operator was restricted to walking along arcuate ridges (rows of seracs) and morainal stripes, and made soundings at a separation of about 10 m. The probable error in inferred ice thickness is about 5 m near the middle of the ice dam, and about 10m near the margins of the ice dam.
Results
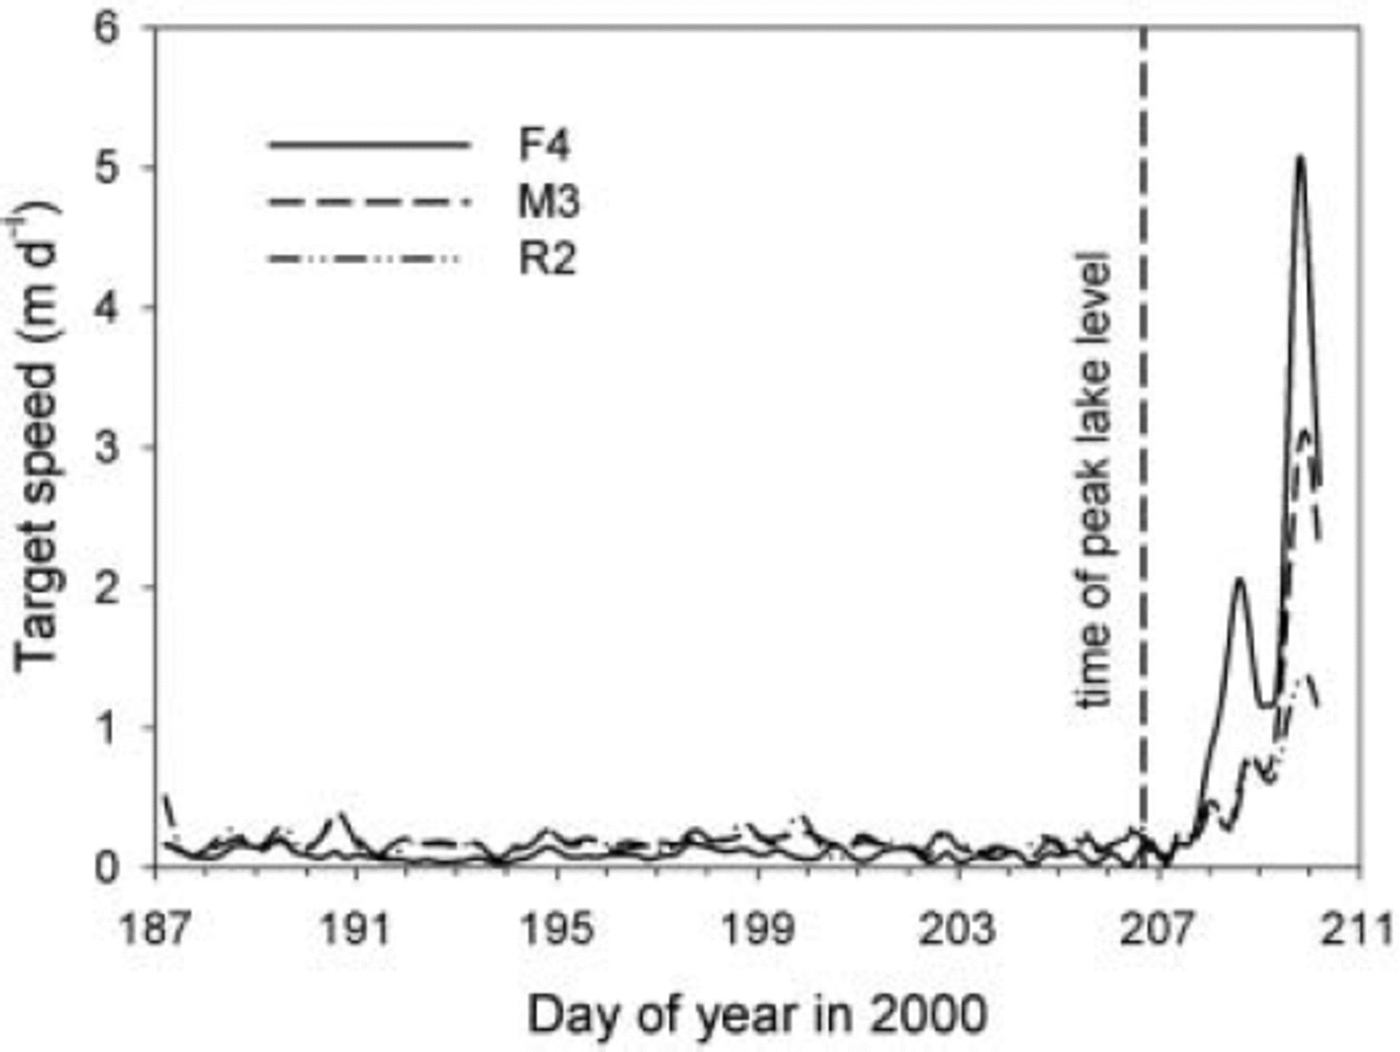
Targets BL1 and MLN on the main glacier (Fig. 3) moved nearly due south and were relatively little affected by lake filling and drainage, although their motions provide some clues about water storage during the jökulhlaup, as discussed by Reference Anderson, Walder, Anderson, Trabant and FountainAnderson and others (2005). Targets P1, P2 and P3, all very close to the edge of the ice dam, moved nearly due west and were lost by calving on day 199; their motions offer evidence (to be presented elsewhere) about mechanical coupling between the ice dam and the main glacier. Here we focus on the 17 targets within what we call the ‘central cluster’, or CC (Fig. 3). Ice thickness is typically about 200–300m beneath the CC targets, which thus spanned a domain about 1–2 ice thicknesses in horizontal extent. With the exception of F6, CC targets moved to the southwest as the lake filled, then showed a change in azimuth ϕ 24–48 hours after the level of HCL reached a maximum (Fig. 4). Target speed u increased greatly at the same time (Fig. 5). The magnitude of the changes in ϕ and u generally decreased with distance from HCL, while the time at which these changes occurred generally became progressively later with distance from the lake.
Trajectories of three CC targets that were roughly oriented in a line normal to the ice-dam face. To show all three trajectories in an undistorted figure, the initial position of M3 has been shifted west by 103 m, while the initial position of R2 has been shifted north by 25m and west by 258m (cf. Fig. 3). Positions have been interpolated to 0.2 day intervals. Local easting and northing are relative to Universal Transverse Mercator zone 10 coordinates (380000, 6810000). Dates of change in trend of motion are indicated. Peak lake stage was reached at day 206.7.

Speed of the targets whose trajectories are shown in Figure 4.
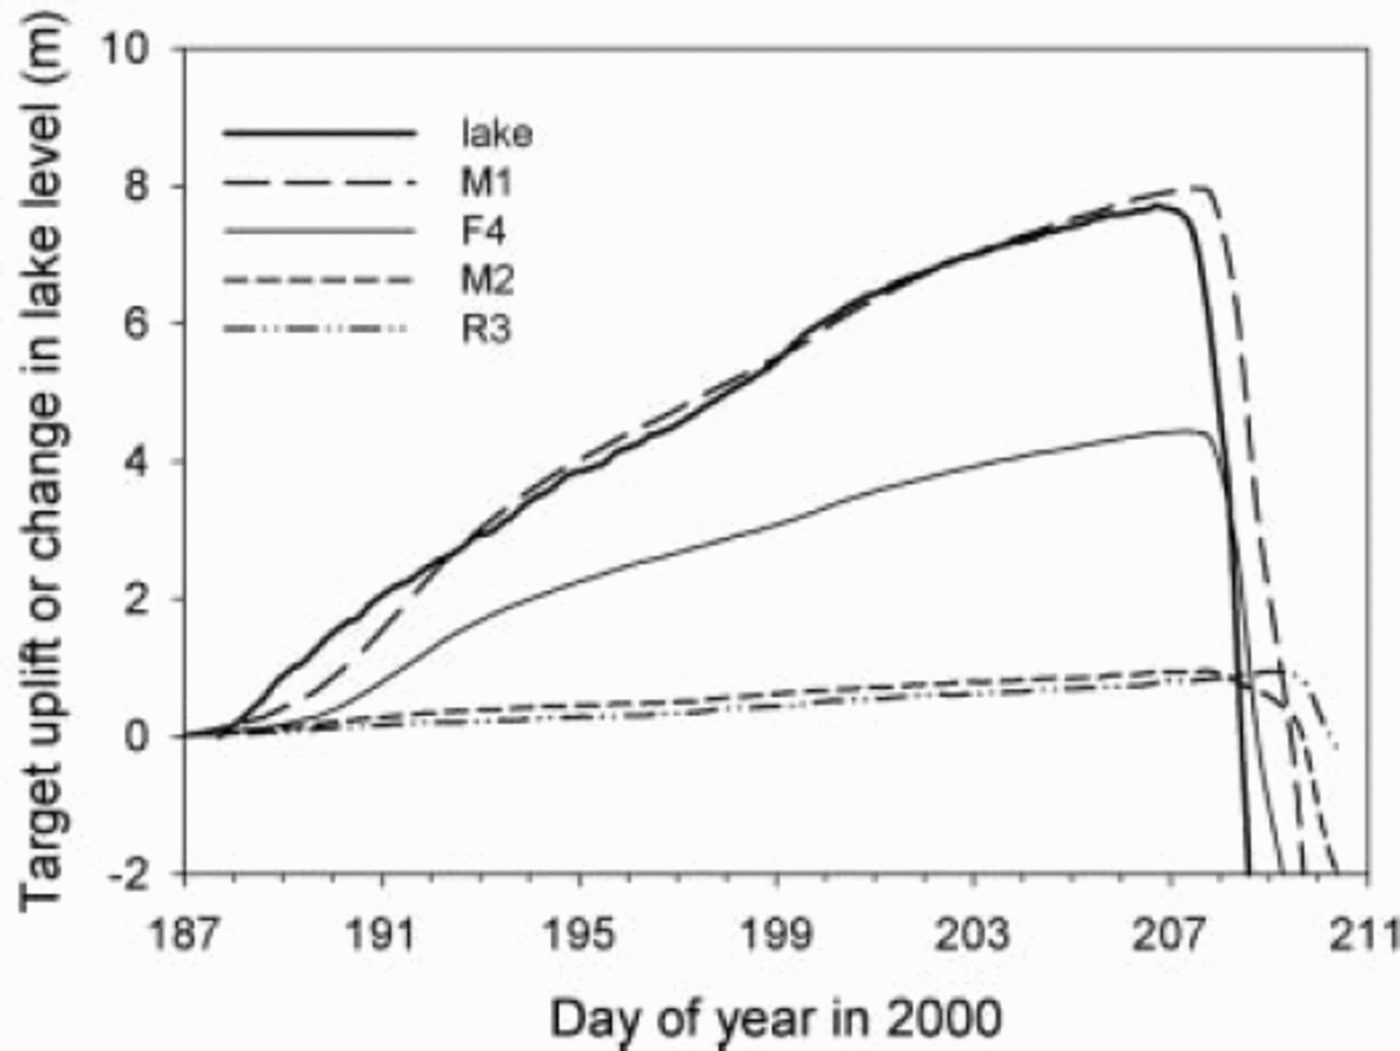
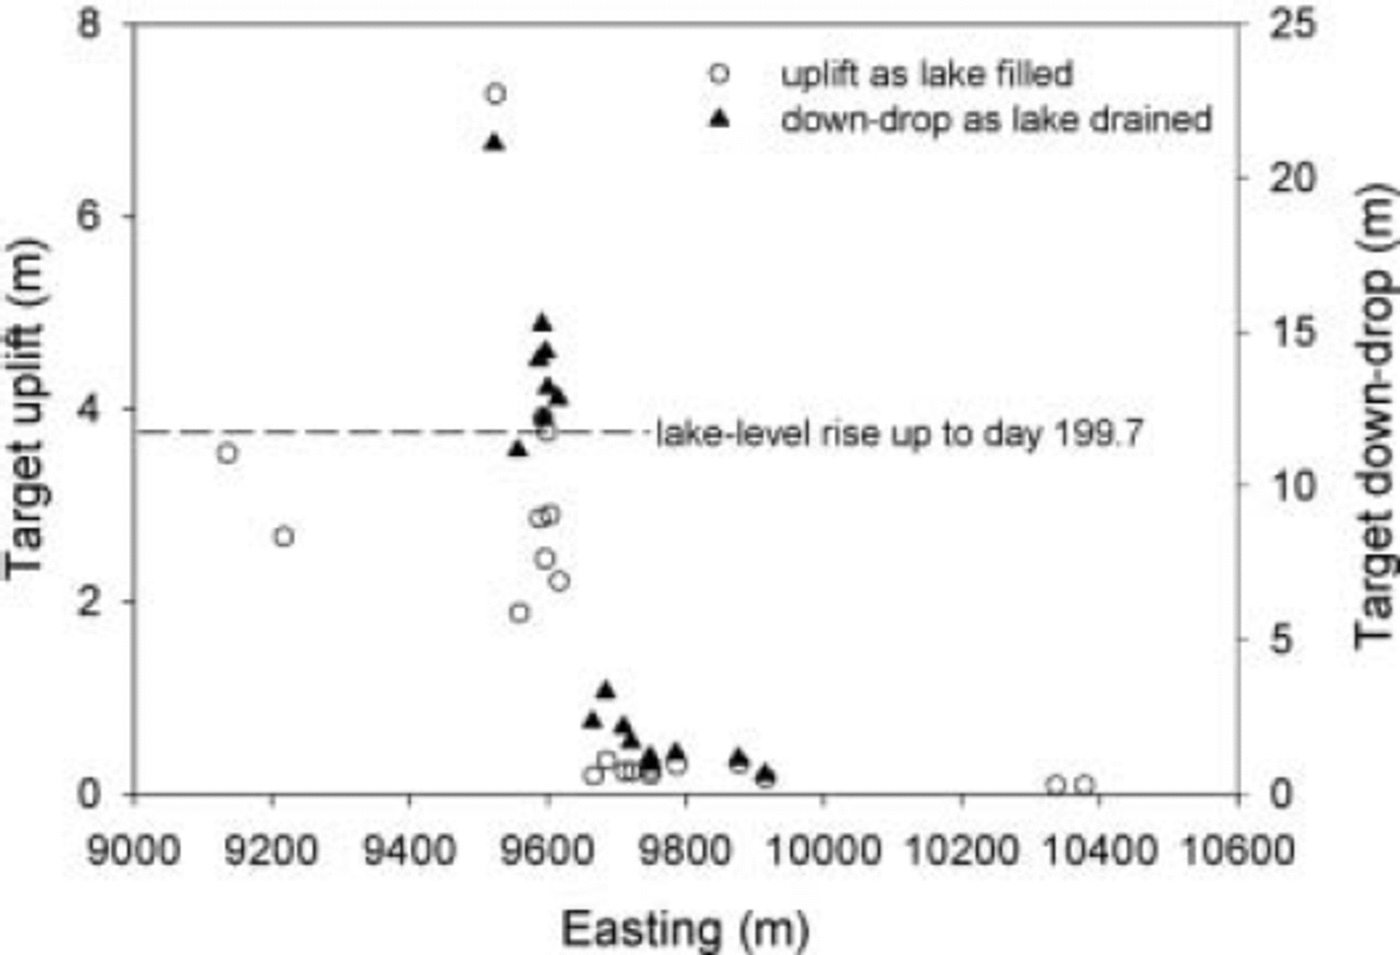
CC targets exhibited diverse vertical motions during lake filling and drainage. Let Δh be the measured change in elevation of a target during some arbitrary time interval. The elevation change Δh f due to surface-parallel ice flow must be subtracted from Δh to give Δh s, the elevation change that we presume is caused by lake-level change. We calculated the correction Δh f from the average slope of the ice-dam surface. Figure 6 shows Δh s(t) for several representative targets. In general, Δh s(t) decreased with distance x from the lake as the lake filled, and reached a maximum at some time after the time of maximum lake level, but close to the time at which the change in ϕ and/or u occurred. Figure 7 shows accumulated vertical rise of targets as a function of x for one particular time interval, as well as the total drop Δh drop in target elevation from the maximum elevation to the last data collected. The key point to note from Figure 7 is the locally steep gradient in Δh s and Δh drop at an easting of about 9600 m. The overall pattern of uplift/down-drop is reminiscent of ground deformation near a steeply dipping fault.
Target uplift (corrected for gross glacier flow) and change in lake level as a function of time relative to the start of data collection.
Target uplift and down-drop as a function of easting. Uplift shown is the accumulated value from the start of data collection until the calving event of day 199.7. Down-drop is the difference between maximum value of Δh s and the last measured value (at about day 210.67).
The ice dam was, in an average sense, stretching in an east–west sense (ɛ
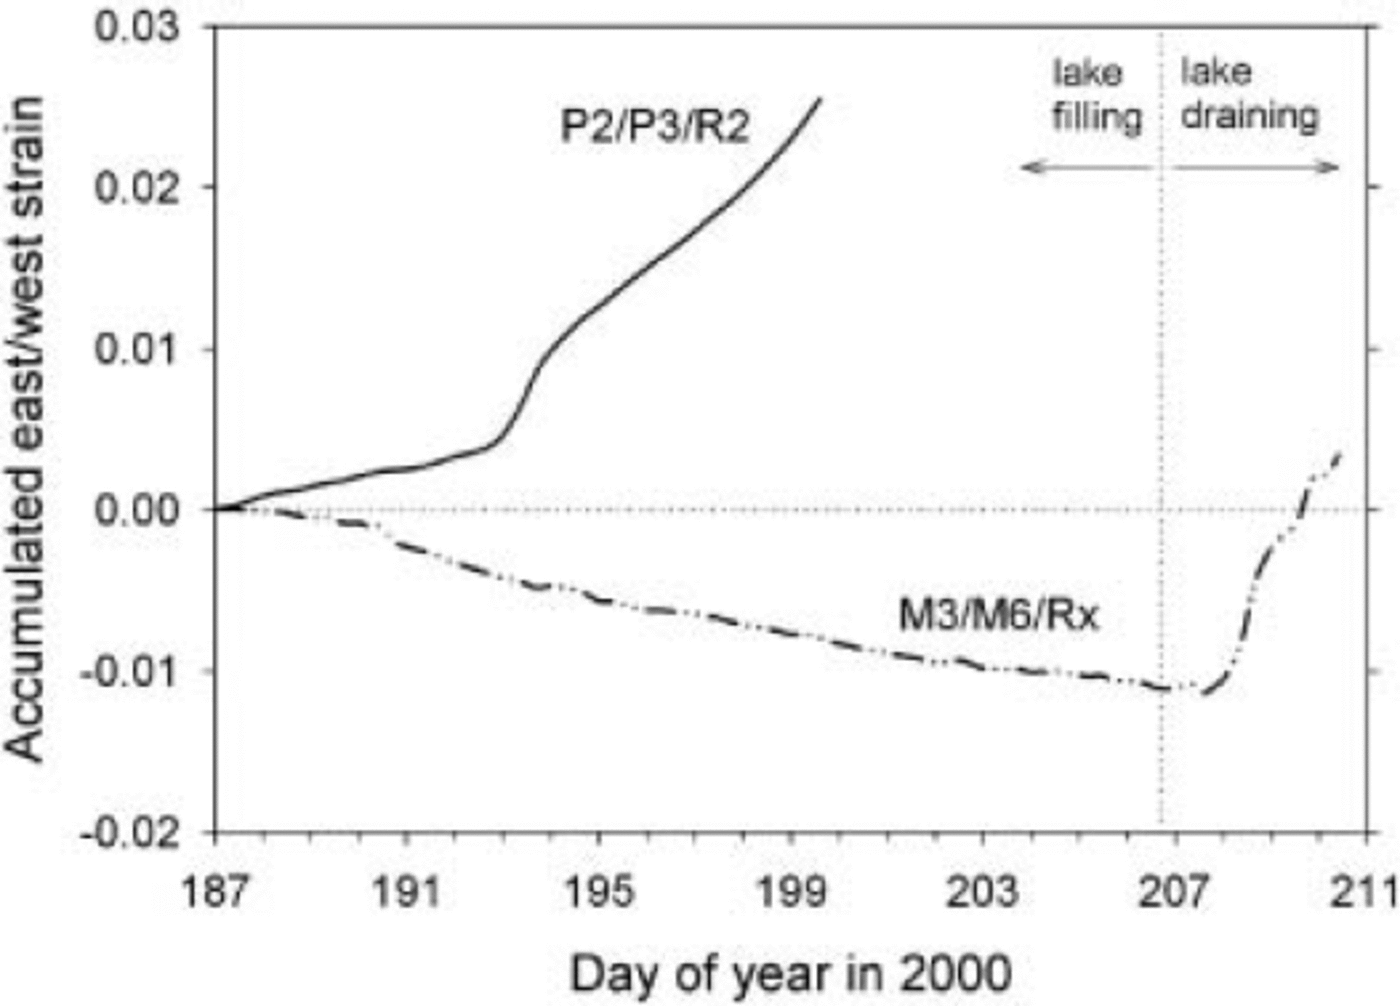
xx > 0) at all times (element P2/P3/R2 in Fig.8). The ice dam probably behaved roughly like a confined ice shelf (Reference Van der VeenVan der Veen, 1999), with no drag over much of the base (owing to the water wedge) and resistance provided by drag along the sides of the ice dam and by stress gradients within the ice. But within a narrow zone, ɛ
xx
underwent a reversal, being negative as the lake filled, positive as the lake drained (element M3/M6/Rx in Fig.8). The zone of strain reversal is basically the same as the zone in which Δh
s decreased sharply from west to east (Fig. 7). Considering the motion of targets on the west side of the central cluster relative to those on the east side, we consistently see a reversal in the sense of motion (e.g. Fig. 9). Most of these relative-motion trajectories exhibit a very steep plunge toward the lake, at roughly 10o from the vertical. To summarize, within the zone of large  the strain rate ɛ
xx < 0 (shortening) as the lake fills, then reverses sign as the lake drains, but outside the zone of large
 ɛ
xx
is always positive (extension).
Accumulated strain in an east–west direction for two overlapping triangular elements (see Fig. 3). Element P2/P3/R2 is representative of strain for the ice dam as a whole up to the time that P2 and P3 were lost by calving. M3/M6/Rx is an element that spans the zone of large uplift gradient.
Motion of M1 relative to M2 projected onto a vertical plane striking east–west. No vertical distortion. Data have been interpolated to 0.2 day intervals. Until day 207.8 (diamonds), the east–west separation of M1 and M2 (see Fig. 3) decreased while M1 rose faster than M2. After day 207.8 (squares), the east–west separation of M1 and M2 increased while M1 dropped faster than M2. Arrows also indicate sense of temporal change in relative separation. The nearly reversible trajectory is most reasonably interpreted as giving the apparent dip of a fault that separates M1 from M2 and accommodates the relative motion.

Discussion
The observations that targets near the face of the ice dam rose at a rate very nearly equal to dz l /dt, and that ∂(Δh s)/∂t fell off with distance from the lake, might lead one to conclude that the ice dam was behaving mechanically as a plate in flexure, the glaciological analogy being an ice shelf responding to ocean tides (e.g. Reference Lingle, Hughes and KollmeyerLingle and others, 1981). The fundamental problem with this explanation is that there were two regions of fairly gentle gradient (∂Δh s /∂x) in vertical displacement separated by a narrow zone, only about 100m wide, in which the magnitude of ∂Δh s /∂x was much greater (Fig. 7). This distribution of ∂Δh s /∂x cannot be reproduced by a flexural model unless the flexural rigidity is arbitrarily ‘tuned’ so as to vary by many orders of magnitude over short distances.
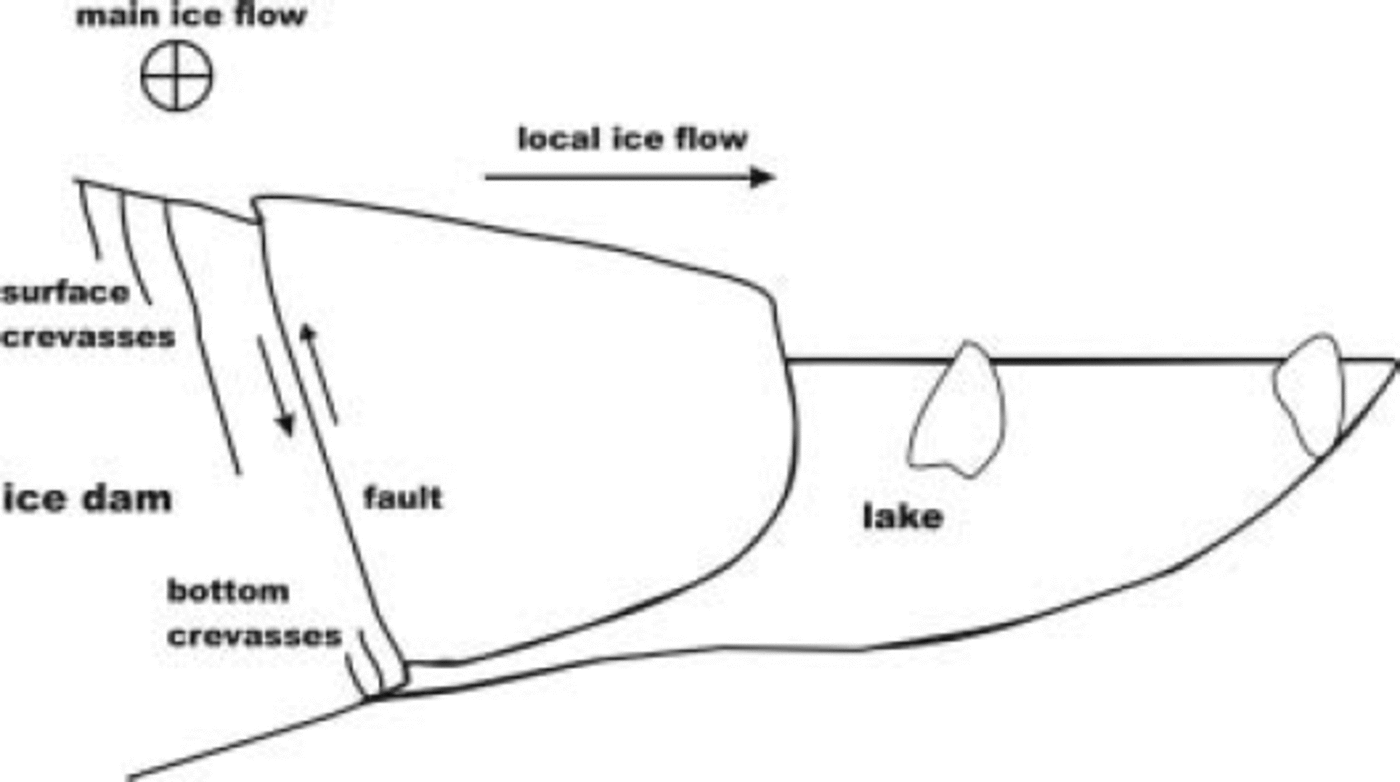
We believe the most reasonable explanation for the observed pattern of deformation, especially the relative-motion histories, is in terms of movement along steeply dipping faults that dip towards the lake and cut through the entire ice thickness (Fig. 10). In this interpretation, some of the crevasses cutting across the ice dam are simply surface expressions of such faults. We suggest that as the lake fills, fault-bounded sections of the ice dam go afloat. Targets separated by such a fault accordingly converge in an east–west sense. As the lake drains and the subglacial wedge of water thins beneath the buoyant sections of the ice dam, those sections sag, and targets separated by a fault diverge in an east–west sense.
Schematic cross-section (not to scale) through the ice dam and lake, indicating the subglacial water wedge and where crevasses form and link up to form high-angle faults. Flow of the main glacier is into the page. The indicated sense of fault motion is for rising lake level, and would reverse as the lake drains.
A previous (albeit much less detailed) study of the mechanical behavior of an ice dam during filling and drainage of an ice-marginal lake (by Reference KasperKasper (1989) at Kaskawulsh Glacier, Canada) revealed a pattern of vertical motion strikingly similar to what we measured at Kennicott Glacier. The Kaskawulsh Glacier ice dam seems also to have been pervasively faulted.
Aerial photographs show essentially the same pattern of fractures spanning the HCL ice dam from year to year. As part of the ice dam calves into HCL every year as the lake drains, there must be some mechanism for regenerating the fracture pattern. Figure 10 illustrates our view of this process. Fractures initially form in extension, as surface crevasses, during lake drainage, are advected towards the lake, and probably undergo an episode of extension annually as the lake drains. Bottom crevasses are likely to grow wherever the subglacial water wedge lifts up the glacier by modest amounts during lake filling (cf. Reference Van der VeenVan der Veen’s (1998) discussion of floating ice shelves). We suggest that bottom crevasses link up with surface crevasses to form fractures penetrating through the entire glacier thickness. Such fractures are advected toward the lake and act as high-angle faults during a subsequent cycle of lake filling and drainage. The ice dam immediately adjacent to the lake forms a compact mass, rather than disintegrating, because the HCL valley narrows to the west (Fig. 3), thereby buttressing the pervasively fractured ice dam in much the same way as constrictions in a river channel foster ice jams.
Summary
We placed a large number of survey targets on the surface of a glacier in the vicinity of a marginal ice-dammed lake, and measured target displacement as the lake filled and drained. Spatial and temporal patterns of target movement are most readily explained if a wedge of water penetrates beneath the ice dam as the lake fills and if a substantial part of the ice dam is in fact faulted from the surface to the bed, through about 250–300m of ice. The faults may form through time by coalescence of surface crevasses and basal crevasses. A flexural model for ice-dam deformation fails to explain the data.
Acknowledgements
D. Rosenkrans of Wrangell–St Elias National Park and Preserve helped us obtain permission to conduct this research. R. Jacobel provided radar equipment. J. Harper, D. Lindsay and R. Schlichting assisted in the field. D. MacAyeal, F. Ng and R.M. Iverson provided helpful reviews of an earlier version of this paper. The US National Science Foundation, Office of Polar Programs supported this research through grants 9812945, 9812973, 9812944, 9912129, 9912180 and 9912306.



