The past decades have seen progress being made in our understanding of typical reading development and the causes of deficits in the acquisition process. Research on reading and writing, however, has traditionally focused on a limited number of European languages, in particular English, a language with an exceptionally inconsistent and irregular orthography (Share, Reference Share2008). More recently, research on reading and spelling in other languages and scripts has been receiving increased attention (Landerl et al., Reference Landerl, Ramus, Moll, Lyytinen, Leppanen, Lohvansuu and Schulte-Körne2013; Peterson & Pennington, Reference Peterson and Pennington2015; Winskel, Reference Winskel2013). However, whereas the body of research focusing on East Asian languages is growing (i.e., Chinese, Japanese, and Korean), still very little research has been conducted on reading and spelling development in languages of Southeast Asia, among which is the highly transparent Standard Indonesian (SI) language (Jap, Borleffs, & Maassen, Reference Jap, Borleffs and Maassen2017; Winskel & Widjaja, Reference Winskel and Widjaja2007).
Dyslexic children exhibit common phonological deficits in different languages, and predictors of reading performance are relatively universal, at least in alphabetic orthographies. Nevertheless, the predictors’ precise weights may vary depending on the transparency of the mapping system (Ziegler & Goswami, Reference Ziegler and Goswami2005). Moreover, orthographic differences across languages have been shown to influence the reading strategies applied and to impose differential weighting on different neural pathways during word reading (Das, Padakannaya, Pugh, & Singh, Reference Das, Padakannaya, Pugh and Singh2011). Expanding our research focus to a broader range of languages and scripts is therefore essential to gain a better understanding of orthography-specific versus universal mechanisms in reading and spelling development.
In the present study, we adopt Pennington et al.’s (Reference Pennington, Santerre-Lemmon, Rosenberg, MacDonald, Boada, Friend and Olson2012) approach in which we test the fit of single versus multiple deficit models of dyslexia to individual cases. Instead of focusing on a mainly English-speaking sample, however, we analyze individual profiles of young readers of SI. An introduction to Pennington et al.’s study and the present study is given in the “Individual Prediction of Dyslexia” and “The Present Study” sections, respectively.
UNDERLYING SKILLS OF READING IN DIFFERENT ORTHOGRAPHIES
Wagner and Torgesen (Reference Wagner and Torgesen1987) distinguish three major types of phonological abilities required for reading acquisition: phonological awareness, retrieval of phonological codes from long-term memory, and phonological coding in short-term memory. Phonological awareness (PA) refers to the sensitivity for and access to sounds in spoken words. Although accepted as one of the strongest predictors of reading development in the opaque English orthography (e.g., Muter, Hulme, Snowling, & Stevenson, Reference Muter, Hulme, Snowling and Stevenson2004; Vellutino, Fletcher, Snowling, & Scanlon, Reference Vellutino, Fletcher, Snowling and Scanlon2004), opinions differ on whether this also applies to more transparent orthographies. Some studies showed that the influence of PA was stronger in opaque than in transparent orthographies (Mann & Wimmer; Reference Mann and Wimmer2002; Vaessen et al., Reference Vaessen, Bertrand, Tóth, Csépe, Faísca, Reis and Blomert2010; Ziegler et al., Reference Ziegler, Bertrand, Tóth, Csépe, Reis, Faísca and Blomert2010), while others reported an equally strong prediction of PA in English and in more transparent orthographies (Caravolas, Lervåg, Defior, Seidlová-Málková, & Hulme, Reference Caravolas, Lervåg, Defior, Seidlová-Málková and Hulme2013; Caravolas et al., Reference Caravolas, Lervåg, Mousikou, Efrim, Litavký, Onochie-Quintanilla and Hulme2012, Reference Caravolas, Lervåg, Defior, Seidlová-Málková and Hulme2013). In transparent orthographies, PA seems to particularly affect early reading acquisition, with its influence decreasing over time when the basic decoding rules have been learned (Furnes & Samuelsson, Reference Furnes and Samuelsson2011; Georgiou, Parrila, & Papadopoulos, Reference Georgiou, Parrila and Papadopoulos2008; Holopainen, Ahonen, & Lyytinen, Reference Holopainen, Ahonen and Lyytinen2001; Vaessen et al., Reference Vaessen, Bertrand, Tóth, Csépe, Faísca, Reis and Blomert2010). However, conflicting results have been reported for Czech (Caravolas, Volín, & Hulme, Reference Caravolas, Volín and Hulme2005), Dutch (Morfidi, van der Leij, de Jong, Scheltinga, & Bekebrede, Reference Morfidi, van der Leij, de Jong, Scheltinga and Bekebrede2007), and Finnish (Kortteinen, Närhi, & Ahonen, Reference Kortteinen, Närhia and Ahonen2009) on more complex PA tasks. Moreover, using speeded PA tasks, Vaessen and Blomert (Reference Vaessen and Blomert2010) showed that reading and PA remained reciprocally related over many years also in transparent orthographies. In opaque orthographies, PA remains a strong predictor beyond first grade, reflecting the fact that the development of accurate decoding in opaque orthographies takes longer than in more transparent orthographies (Seymour, Aro, & Ersine, Reference Seymour, Aro and Erskine2003).
The second type of phonological ability (i.e., the retrieval of phonological codes from long-term memory), concerns access to the pronunciations of letters, digits, and words, and is typically tested as rapid automatized naming (RAN). RAN has been primarily associated with reading speed and fluency in both transparent orthographies such as Dutch (de Jong & van der Leij, Reference de Jong and van der Leij2003; Vaessen, Gerretsen, & Blomert, Reference Vaessen, Gerretsen and Blomert2009), German (Landerl & Wimmer, Reference Landerl and Wimmer2008), Greek (Georgiou et al., Reference Georgiou, Parrila and Papadopoulos2008), and Finnish (Kairaluoma, Torppa, Westerholm, Ahonen, & Aro, Reference Kairaluoma, Torppa, Westerholm, Ahonen and Aro2013; Lepola, Poskiparta, Laakkonen, & Niemi, Reference Lepola, Poskiparta, Laakkonen and Niemi2005), and in the opaque English orthography (Pennington, Cardoso-Martins, Green, & Lefly, Reference Pennington, Cardoso-Martins, Green and Lefly2001; Sunseth & Bowers, Reference Sunseth and Bowers2002). In contrast to PA, the relative importance of RAN has been shown to increase over time (de Jong & van der Leij, Reference de Jong and van der Leij1999; Heikkilä, Torppa, Aro, Närhi, & Ahonen, Reference Heikkilä, Torppa, Aro, Närhi and Ahonen2016; Vaessen et al., Reference Vaessen, Bertrand, Tóth, Csépe, Faísca, Reis and Blomert2010; Wimmer, Reference Wimmer1993). Even though RAN seems to be a rather robust predictor of reading across languages, the relationship between RAN and reading still warrants more research as results are again contradictory. RAN has been claimed to be a stronger predictor of reading skills than PA in more transparent orthographies (e.g., de Jong & van der Leij, Reference de Jong and van der Leij1999, Reference de Jong and van der Leij2003; Wimmer, Mayringer, & Landerl, Reference Wimmer, Mayringer and Landerl2000). This is at odds with the results from cross-linguistic studies showing the impact of RAN to be stronger in the more complex rather than the less complex orthographies (Landerl et al., Reference Landerl, Ramus, Moll, Lyytinen, Leppanen, Lohvansuu and Schulte-Körne2013), or with results indicating generally weak associations between RAN and reading across orthographies (Ziegler et al., Reference Ziegler, Bertrand, Tóth, Csépe, Reis, Faísca and Blomert2010). Others have suggested that RAN remains universally important after decoding accuracy has been reached (e.g., Moll et al., Reference Moll, Ramus, Bartling, Bruder, Kunze, Neuhoff and Landerl2014; Norton & Wolf, Reference Norton and Wolf2012), which has been shown to take considerably longer in inconsistent orthographies (Seymour et al., Reference Seymour, Aro and Erskine2003). Studies conducted in less transparent orthographies after the initial phases of reading seem to support this idea (Juul, Poulsen, & Elbro, Reference Juul, Poulsen and Elbro2014; Vaessen et al., Reference Vaessen, Bertrand, Tóth, Csépe, Faísca, Reis and Blomert2010).
Phonological coding in short-term memory, the third phonological ability involved in reading acquisition mentioned by Wagner and Torgesen (Reference Wagner and Torgesen1987), concerns the ability to temporarily store verbal information and is often denoted as verbal working memory (VWM). VWM is regarded as playing an important role in both word decoding and spelling (Tilanus, Segers, & Verhoeven, Reference Tilanus, Segers and Verhoeven2013, Reference Tilanus, Segers and Verhoeven2016). Assessing VWM skills, Tilanus et al. (Reference Tilanus, Segers and Verhoeven2013, Reference Tilanus, Segers and Verhoeven2016) found large differences between typical and poor second-grade learners of Dutch, showing that the poor readers had difficulty keeping phonological information in their working memory. VWM impairments were also found in older dyslexic elementary school readers of English (Kibby, Marks, Morgan, & Long, Reference Kibby, Marks, Morgan and Long2004) and German (Reiter, Tucha, & Lange, Reference Reiter, Tucha and Lange2004) as compared to typical readers. By contrast, Dutch dyslexic children and weak readers in de Jong and van der Leij's (Reference de Jong and van der Leij2003) study did not differ significantly from typical readers on VWM tasks that were assessed in kindergarten and first grade. The authors hypothesize that if VWM is influenced by learning to read, or develops concurrently, then differences between typical and dyslexic readers might become more apparent after first grade. The results of Landerl et al.’s (Reference Landerl, Ramus, Moll, Lyytinen, Leppanen, Lohvansuu and Schulte-Körne2013) cross-linguistic study indicated that VWM played a significant, but comparatively minor role than phoneme deletion and RAN as predictors of dyslexia. In contrast to the latter two predictors, the impact of VWM was not modulated by orthographic complexity in Landerl et al.’s study.
THE MODELS EXPLAINING DYSLEXIA
The International Dyslexia Association characterizes dyslexia as difficulties with accurate and/or fluent word reading, spelling, and decoding (Lyon, Shaywitz, & Shaywitz, Reference Lyon, Shaywitz and Shaywitz2003). In children with reading difficulties in transparent orthographies, such as Finnish, Greek, or Italian, reading speed is usually slowed, whereas reading accuracy remains relatively unaffected following the very early stages of reading acquisition (e.g., Constantinidou & Stainthorp, Reference Constantinidou and Stainthorp2009; Dandache, Wouters, & Ghesquière, Reference Dandache, Wouters and Ghesquière2014; de Jong & van der Leij, Reference de Jong and van der Leij2003; Escribano, Reference Escribano2007; Holopainen et al., Reference Holopainen, Ahonen and Lyytinen2001; Landerl & Wimmer, Reference Landerl and Wimmer2008; Tressoldi, Stella, & Faggella, Reference Tressoldi, Stella and Faggella2001). Phoneme identification and phonological decoding skills hence seem to be relatively intact (Barca, Burani, Di Filippo, & Zoccolotti, Reference Barca, Burani, Di Filippo and Zoccolotti2006; Martens & de Jong, Reference Martens and de Jong2006; Ziegler & Goswami, Reference Ziegler and Goswami2005). If grapheme-to-phoneme correspondences are consistent, even children with dyslexia are apparently able to map printed words onto their spoken forms. Still, a tendency toward inaccurate reading was also found among some of the poor readers in transparent orthographies (e.g., Boets et al., Reference Boets, de Smedt, Cleuren, Vandewalle, Wouters and Ghesquière2010; Eklund, Torppa, Aro, Leppänen, & Lyytinen, Reference Eklund, Torppa, Aro, Leppänen and Lyytinen2015; Leinonen et al., Reference Leinonen, Müller, Leppänen, Aro, Ahonen and Lyytinen2001; Sprenger-Charolles, Colé, Lacert, & Serniclaes, Reference Sprenger-Charolles, Colé, Lacert and Serniclaes2000). In languages with an opaque and inconsistent orthography on the level of grapheme–phoneme correspondences, dyslexia typically becomes apparent on the basis of inaccurate reading alone, although reading speed and spelling skills may also be affected (Ziegler & Goswami, Reference Ziegler and Goswami2005).
Although dyslexia has been studied extensively over the years, researchers have not yet been able to get to the root of the matter. Instead, single (e.g., Ramus et al., Reference Ramus, Rosen, Dakin, Day, Castellote, White and Frith2003), double (e.g., Wolf & Bowers, Reference Wolf and Bowers1999), and multiple deficit models (e.g., Bishop & Snowling, Reference Bishop and Snowling2004; Pennington, Reference Pennington2006) have been proposed to explain this developmental condition. One prevailing theory is the phonological theory of dyslexia, which proposes that dyslexia is caused by a specific impairment in the representation, storage, and/or retrieval of speech sounds (Ramus et al., Reference Ramus, Rosen, Dakin, Day, Castellote, White and Frith2003). These processes are essential for the establishment and automatization of grapheme–phoneme correspondences (i.e., the foundation of reading in alphabetic systems), which in turn underlie fluent and accurate word recognition. While different views exist on the nature of the phonological problems, for the last several decades there has been scientific consensus that dyslexia has its roots in cognitive difficulties to process phonological features, resulting in difficulties to process written language (Peterson & Pennington, Reference Peterson and Pennington2015; Vellutino et al., Reference Vellutino, Fletcher, Snowling and Scanlon2004).
In contrast to single deficit models, the multiple deficit model (Pennington, Reference Pennington2006) does not rest on one causal factor or chain of factors while excluding others, but postulates that multiple etiologic risk and protective factors interact with each other and with cognitive processes, neural systems, and complex behavioral disorders. The double-deficit hypothesis (Wolf & Bowers, Reference Wolf and Bowers1999), instead of focusing on multiple interacting factors, proposes a distinction between a phonological deficit subtype of dyslexia that would be linked to inaccurate reading, and a naming-speed deficit subtype linked to slow reading. A “double deficit” would then lead to both slow and inaccurate reading. However, findings of previous double-deficit studies are mixed, possibly due to the large variation in age and reading levels of the participants, in measures and cutoff criteria used for the selection of the deficit subgroups, and in levels of consistency of the orthographies studied (Torppa et al., Reference Torppa, Parrila, Niemi, Lerkkanen, Poikkeus and Nurmi2013).
As discussed above, the predictive value of reading-related skills may vary depending on the characteristics of the orthography being learned and/or on the phase of the development of reading skill. An additional challenge arising with the use of these models is that the predictions made by these models are based on group data and that much less is known about the extent to which these group predictions can be applied to individual cases. Even though a specific combination of predictors may account for most of the variance in reading performance at the group level, at the individual level, this may mask the presence of subgroups, including some whose reading skills may be adequately explained by a particular single predictor, while with others they are explained by a different single predictor, and in some individuals by multiple predictors.
INDIVIDUAL PREDICTION OF DYSLEXIA
Pennington et al. (Reference Pennington, Santerre-Lemmon, Rosenberg, MacDonald, Boada, Friend and Olson2012) analyzed individual profiles of cognitive predictors of reading in two large population-based twin studies including randomly selected preschool and school-aged children (only one per twin pair), to see whether predictions made by cognitive models of dyslexia using group data could be applied to individual cases. The first sample (N = 827) consisted of children from the United States aged 7–19 years; the second sample (N = 809) was composed of subsamples from Australia, Norway, and the United States, including children aged 5–7 years. Tests were conducted in English, except for the Norwegian children whose testing was conducted in Norwegian.
The authors assessed the validity of five different predictor models, including two single deficit models (single phonological deficit model; single deficit subtypes model), two multiple deficit models (phonological core, multiple deficit, multiple predictor model; multiple deficit, multiple predictor model), and one hybrid model (subgroups of individuals with dyslexia fitting each of the four other models). The models differed on two crucial points, namely, whether or not a single deficit was necessary and sufficient to cause dyslexia and whether or not a deficit in PA was necessary to cause dyslexia. Their first model, the single phonological deficit model, is similar to the broader phonological hypothesis and the model proposed by Ramus et al. (Reference Ramus, Rosen, Dakin, Day, Castellote, White and Frith2003). Wolf and Bowers's double-deficit hypothesis (Reference Wolf and Bowers1999) bears some resemblance to Pennington et al.’s second (single deficit subtypes model) and fourth model (multiple deficit and multiple predictor model).
To analyze individual cognitive profiles and to test the fit of single and multiple deficit models, the researchers first counted the cognitive deficit(s) in individual cases in PA, language skill (L), and processing speed and/or naming speed (PS/NS), before exploring the fit of individual reading scores with single and multiple predictor regression equations. When an individual satisfied both methods of prediction (i.e., only had the deficit(s) predicted by the model and fitted the corresponding regression equation best), the case was regarded as a good fit for this model.
PA was the best predictor of reading performance in both samples (accounting for 54.6% and 47.6% of the variance of reading skill in the US sample and the international sample, respectively) followed by L (40%) and PS/NS (34.8%) in the US sample, and by NS (27.4%) and L (10.9%) in the international sample. No significant differences were found in terms of significance of relative importance of predictors when looking at the effect of English versus Norwegian in the international sample. The best fitting multiple predictor models included PA, L, PS/NS, PA × L in the US sample (accounting for 67% of variance in reading skill), and PA, NS, PA × NS in the international sample (accounting for 51.9% of variance in reading skill).
Twenty-four percent to 28% of dyslexic cases fitted the single predictor models in Pennington et al.’s samples, and 11%–22% fitted the multiple predictor models. Contrary to their expectations, the hybrid model rather than the multiple deficit model was found to be the best-fitting model, accounting for 39%–46% of dyslexic cases in the two samples. Pennington et al. concluded that the relationship between cognitive predictors and reading skill in both samples was probabilistic, not deterministic.
SI ORTHOGRAPHY
SI is part of the Western Malayo-Polynesian subgroup of the Austronesian languages and is a standardized dialect of the Malay language (Sneddon, Reference Sneddon2003). Nationwide, about 23 million Indonesians use SI as their primary language while over 140 million others speak SI as a second language (Lewis, Simons, & Fennig, Reference Lewis, Simons and Fennig2013). SI possesses a highly transparent orthography with an almost one-to-one correspondence between graphemes and phonemes in both the reading and spelling direction, including a close correspondence between letter names and letter sounds (Winskel & Widjaja, Reference Winskel and Widjaja2007). The alphabet overlaps with the 26 letters of the English alphabet, with the letter <x> only being used in loan words. SI has five pure vowels (monophthongs): <a>, <i>, <u>, <e>, and <o>. There are six vowel phonemes as the letter <e> has two phonemic forms: /ə/ and /e/. There are three diphthongs (<au>, <oi>, and <ai>), five digraphs (<gh>, <kh>, <ng>, <ny>, and <sy>), and only few consonant clusters (Chaer, Reference Chaer2009). SI possesses a rich transparent system of morphemes and affixations, with about 25 derivational affixes (Prentice, Reference Prentice and Comrie1987). Colloquial spoken SI often uses nonaffixed forms. The affixes have at least one semantic function and differ depending on the word class of the stem (Winksel & Widjaja, Reference Winskel and Widjaja2007). The syllable is a salient unit in the SI orthography, in which multisyllabic forms make up the majority of words; monosyllabic words are uncommon. The syllable structures are simple and have clear boundaries (Prentice, Reference Prentice and Comrie1987; Winskel, Reference Winskel2013). Syllabic stress is regular and mostly falls on the penultimate or final syllable (Gomez & Reason, Reference Gomez and Reason2002). Indonesian children need to be able to interpret long words from an early age as instructions in primary-school books already contain words with derivational affixes (Winskel & Widjaja, Reference Winskel and Widjaja2007).
Formal reading instruction primarily focuses on teaching about correspondences between whole spoken and written syllables rather than between graphemes and phonemes, reflecting the earlier mentioned salience of the syllable in the SI language (Winskel, Reference Winskel2013). Reading instruction typically starts with the introduction of the alphabet, where students are trained to memorize the letter names. Subsequently, they are taught to combine consonants (C) and vowels (V) to form syllables with a simple CV pattern, such as b+a, b+i, b+u, b+e, and b+o, producing the syllables ba, bi, bu, be, and bo. Next, the students are instructed to combine these syllables to create words, such as i+bu to form the word ibu (mother). Once V and CV syllables are mastered, CVC syllable patterns and more complex CV combinations are taught (Dewi, Reference Dewi2003; Winskel & Widjaja, Reference Winskel and Widjaja2007).
ASSESSING READING IN SI
Recently, Jap et al. (Reference Jap, Borleffs and Maassen2017) developed an assessment battery to evaluate reading acquisition in SI and to identify struggling readers. Moreover, the authors proposed preliminary criteria for the categorization of beginner readers based on the outcomes from 139 first- and second-grade students for reading and decoding fluency (i.e., word and pseudoword reading, respectively), spelling (writing to dictation), and orthographic knowledge (orthographic choice task; OCT). Boets, Wouters, van Wieringen, de Smedt, and Ghesquiere (Reference Boets, Wouters, van Wieringen, de Smedt and Ghesquiere2008) used the OCT as a passive spelling test, which is supported by studies showing that spelling relies more on orthographic representations in memory than reading (Bekebrede, van der Leij, & Share, Reference Bekebrede, van der Leij and Share2009).
The assessment battery of Jap et al. (Reference Jap, Borleffs and Maassen2017) tested the abovementioned skills, in addition to phonological awareness (phoneme deletion), RAN, verbal fluency, verbal short-term memory (digit span), basic mathematics, and nonverbal intelligence. Measures consisted of either existing tasks whose instructions were translated while maintaining the original task content (e.g., Wechsler Intelligence Scale for Children—Revised, digit span, Wechsler, Reference Wechsler1974; RAN, van den Bos, Reference van den Bos2003) or newly created tasks modeled on existing tasks with their content being drawn from commonly used Indonesian textbooks for first grade (e.g., EMT [1-min reading test], Brus & Voeten, Reference Brus and Voeten1979).
THE PRESENT STUDY
In the present study, we largely replicate part of Pennington et al.’s (Reference Pennington, Santerre-Lemmon, Rosenberg, MacDonald, Boada, Friend and Olson2012) study to analyze individual profiles of young readers of SI categorized as “typical readers” and “at risk of dyslexia,” using the categorization criteria and a large part of Jap et al.’s assessment battery. The proposed categorization criteria are described in more detail in the Method section, as well as the tasks used in the present paper's analyses.
Our study addresses the following questions: which profiles of cognitive predictors of reading are found among young readers of SI classified as being at risk of dyslexia? Which theoretical model provides the best fit for the data obtained? In other words, does a single deficit suffice to identify a risk of dyslexia in SI or does it take multiple deficits that necessarily include a deficit in PA? To investigate these questions, we used only slightly adjusted versions of Pennington et al.’s (Reference Pennington, Santerre-Lemmon, Rosenberg, MacDonald, Boada, Friend and Olson2012) models and hypotheses:
Model 1. Single predictor model, single phonological deficit: A deficit in PA is necessary and sufficient to be at risk of dyslexia.
a. The large majority of at-risk cases will have a single phonological deficit and will fit the single PA regression equation best. The remaining at-risk cases will not fit any other single or multiple linear regression equation.
b. PA as a single predictor in a regression equation will optimally predict individual differences in reading skill and other predictors will lack incremental validity beyond PA.
Model 2. Single predictor model, single deficit subtypes: Other deficits besides PA, such as deficits in VWM or NS, are sufficient to identify a risk of dyslexia.
a. The large majority of at-risk cases will have a single deficit in PA, NS, or VWM, and will fit the corresponding regression equation best. The remaining cases will not fit a multiple deficit model.
b. At the group level, other predictors besides PA will have substantial incremental validity in predicting individual differences in reading skill in multiple linear regressions.
Model 3. Multiple predictor model, phonological core, multiple deficit: A single PA deficit is necessary but not sufficient to be at risk of dyslexia; there must be at least two deficits, one of which is in PA:
a. The large majority of at-risk cases will have at least two deficits, one being a deficit in PA, and will fit the multiple regression equation best. The remaining cases will not fit a single deficit model.
b. At the group level, PA will be the strongest predictor of individual differences in reading skill but other predictors will have some incremental validity.
Model 4. Multiple predictor model, multiple deficit: A single deficit is not sufficient to be at risk of dyslexia; any combination of two deficits is sufficient:
a. The large majority of at-risk cases will have at least two deficits that do not necessarily include a PA deficit, and will fit the multiple predictor regression equation best. The remaining cases will not fit a single deficit model.
b. At the group level, all predictors will have substantial incremental validity in predicting individual differences in reading skill in multiple linear regressions (same as 2b).
Model 5. Hybrid model: There are multiple pathways to being at risk of dyslexia, some involving single deficits and some multiple deficits.
a. Substantial numbers of at-risk cases will fit single deficit models and substantial numbers multiple deficit models.
b. At the group level, all predictors will have substantial incremental validity in predicting individual differences in reading skill in multiple linear regressions (same as 2b and 4b).
Similar to Pennington et al. (Reference Pennington, Santerre-Lemmon, Rosenberg, MacDonald, Boada, Friend and Olson2012), the models are partly nested: Model 1 is incorporated in Model 2, Model 3 in Model 4, and the Models 2 and 4 in Model 5, except that they are each restricted to a subset of at-risk readers.
Following Pennington et al. (Reference Pennington, Santerre-Lemmon, Rosenberg, MacDonald, Boada, Friend and Olson2012), we applied the “counting deficits” method and regression fit to further analyze the cognitive profiles obtained in our sample and test the fit of the various predictive models to the data. Deficits were counted in PA, VWM, and NS. We opted for abovementioned skills as previous research classified PA, VWM, and NS as skills fundamental to reading acquisition (de Jong & van der Leij, Reference de Jong and van der Leij1999; Wagner & Torgesen, Reference Wagner and Torgesen1987) and core predictors of reading skills (Tilanus et al., Reference Tilanus, Segers and Verhoeven2013). We used the cutoff of the 10th percentile suggested by Pennington et al. to determine the presence of a deficit in PA (using the phoneme-deletion task), VWM (Wechsler Intelligence Scale for Children digit span forward), and NS (RAN digits and letters). Different from Pennington et al. is that the cutoff in our paper was based on the subsample's mean (four subsamples in total; see Table 1) instead of a control mean.
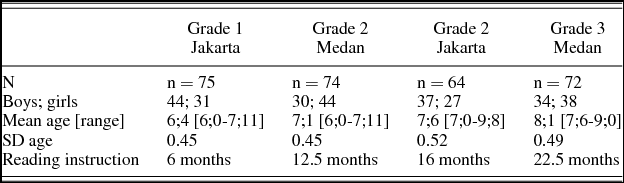
Demographics of the two samples

All scores were standardized within the subsample (e.g., Grade 2 Medan) to enable comparison between samples. Moreover, additional factor scores were created based on RAN digits and letters, which were used as a combined NS score in the analyses. Similar to Pennington et al., three single predictor equations predicting reading performance were used, and the best multiple predictor equation with the optimal combination of predictors. The case was regarded as a good fit when an individual only had the deficit(s) predicted by the model and fitted the corresponding regression equation best (i.e., yielded the lowest standardized residual).
METHOD
Samples
The children participating in this study were recruited from two schools: the first sample consisted of first and second graders from an Indonesian private primary school in West Jakarta and the second sample of second and third graders from a similar school in Medan.
The Jakarta sample was tested 1 month after the beginning of the second semester, at which point the first graders had received approximately 6 months and the second graders approximately 16 months of formal reading instruction (Table 1), and the Medan sample mid-first semester (i.e., after about 12.5 and 22.5 months, respectively). As all children were tested within 1 week, the duration of reading instruction was the same for all children within their grades. The students all had a middle socioeconomic background and were fluent in SI, including a small number of bilingual students who spoke regional languages at home (e.g., Batak, Javanese, and Sundanese). At both schools, education was provided in SI.
Measures and procedure
The tasks presented are part of a larger test battery developed in Jap et al. (Reference Jap, Borleffs and Maassen2017). The tasks used in the present study are fully described below.
Word reading
The student was shown 100 lowercase bisyllabic and multisyllabic words (with a maximum of four syllables) printed on an A4-size laminated sheet of paper and was asked to read these words from top to bottom as fast and as accurately as possible. Reading fluency was defined as the number of words correctly read within 1 min.
Pseudoword reading
The student was shown 100 lowercase bisyllabic and multisyllabic pseudowords printed on an A4-size laminated sheet of paper and was asked to read these words from top to bottom as fast and as accurately as possible. The pseudowords were created by changing one or more letters of every word used in the word-reading task while keeping the number of letters and syllables constant. Decoding fluency was defined as the number of pseudowords correctly read within 1 (Jakarta) or 2 min (Medan).
Writing to dictation (active spelling test)
Twenty words varying in phonological structure and length were presented orally in isolation and in sentence context. The students were instructed to write down each word using the correct spelling. For the Jakarta sample, all words were taken from a Grade 1 SI textbook. For the Medan sample, task complexity was increased by replacing several words from the original task with bisyllabic and multisyllabic words (with a maximum of five syllables) taken from Grade 2 and 3 textbooks. There was no time limit. The spelling score was calculated as the number of correct items.
OCT (passive spelling test)
The OCT consisted of 20 bisyllabic and trisyllabic items, each containing one word and two pseudowords, all three as close to pseudohomophones as possible in the highly transparent SI language. The students were asked to underline the existing word in each row of three, with one practice trial. There was no time limit. The test score was calculated as the number of correct items.
Phoneme deletion
The student was asked to repeat a pseudoword articulated by the researcher, after which (s)he was instructed to leave out a particular phoneme from the repeated pseudoword. The location of the phoneme deletion varied between word-initial, word-final, and middle position. The task consisted of 20 words and three practice trials, with a cutoff rule of five consecutive incorrect answers. The phoneme deletion score was calculated as the number of correct answers.
RAN
The student was shown five columns of 10 digits or letters printed on an A4-size laminated sheet of paper and asked to name these from top to bottom as fast and as accurately as possible. Prior to the test, the student practiced using the last column while the rest of the items were covered with a white sheet of paper. The RAN scores were calculated as the number of items per second named by the student.
Digit span forward
The student needed to repeat spans of numbers of increasing lengths. The task consisted of eight levels of span length with two trials per level and was preceded by two example trials. The cutoff rule was an incorrect answer in two trials with the same span length.
Raven's Coloured Progressive Matrices (CPM)
The standard score on this test was used to compare the student's score to the average score in its grade in order to exclude below-average intellectual ability as a causal factor of possible reading and spelling problems.
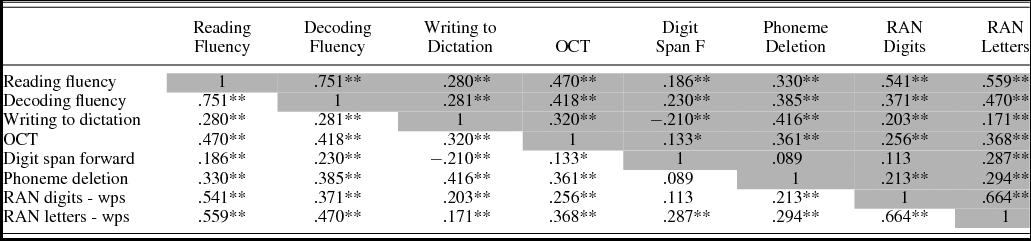
As reading research has shown that slowed reading speed rather than low accuracy is the most marked problem in dyslexic readers in other transparent orthographies, we accordingly took reading and decoding fluency as the main components of our test battery. Word reading and decoding fluency were found to be significantly correlated to each other in our sample (r = .751 at α = 0.01 in Table 2), with the strong reading–decoding correlations indicating that the knowledge and cognitive processes underlying these word-level skills are similar (Ehri, Reference Ehri, Reid and Wearmouth2002) and that the tests appear to be measuring the same construct (Lee, Reference Lee2008). Moreover, all other reading-related skills tested correlated significantly with reading and decoding fluency.
Correlation of variables for the combined sample (n = 285)

Note: **Correlation is significant at the 0.01 level (2-tailed).
OCT = orthographic choice test; Digit span F = digit span forward; RAN - wps = rapid automatized naming score in words per second.
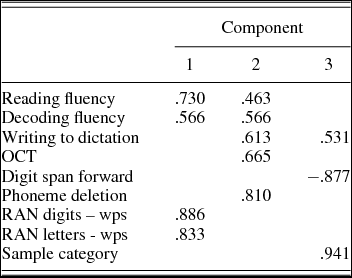
To further investigate the reliability of the measures used, we conducted a principal component analysis (PCA) on each subsample separately. As this resulted in similar factor structures, we decided to present the PCA results for the combined sample (Table 3) with sample category (i.e., Jakarta or Medan) as an additional variable to account for differences between samples. The analysis including nine variables resulted in a three-factor solution, with the first component being composed of both RAN tasks, in addition to a significant part of the reading and decoding fluency loadings. Given their loadings, this factor could be earmarked as a component reflecting the automaticity and some degree of verbal skills required to complete these tasks. The second component was composed of phoneme deletion and both spelling tasks, and in addition by part of the reading and decoding fluency loadings. Successful performance on all of these tasks required phonological skills.
Rotated component loadings for nine variables in the combined sample

Note: Factor loadings < .30 are suppressed.
RAN - wps = rapid automatized naming score in words per second.
Sixty-one out of 72% of the variance was explained by the first two components. The variable sample category loaded on a third component, together with digit span forward and part of the writing to dictation loading. The stable pattern of components in all subsamples and in the combined sample supports the construct validity of the measures used and therewith the reliability of the test battery. Moreover, the structure found is in line with the factor structure presented by Jap et al. (Reference Jap, Borleffs and Maassen2017) for second grade including a larger set of variables.
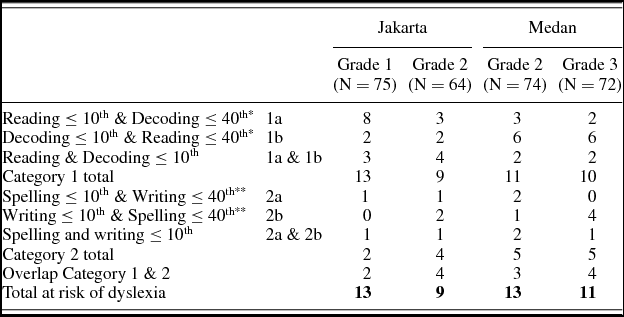
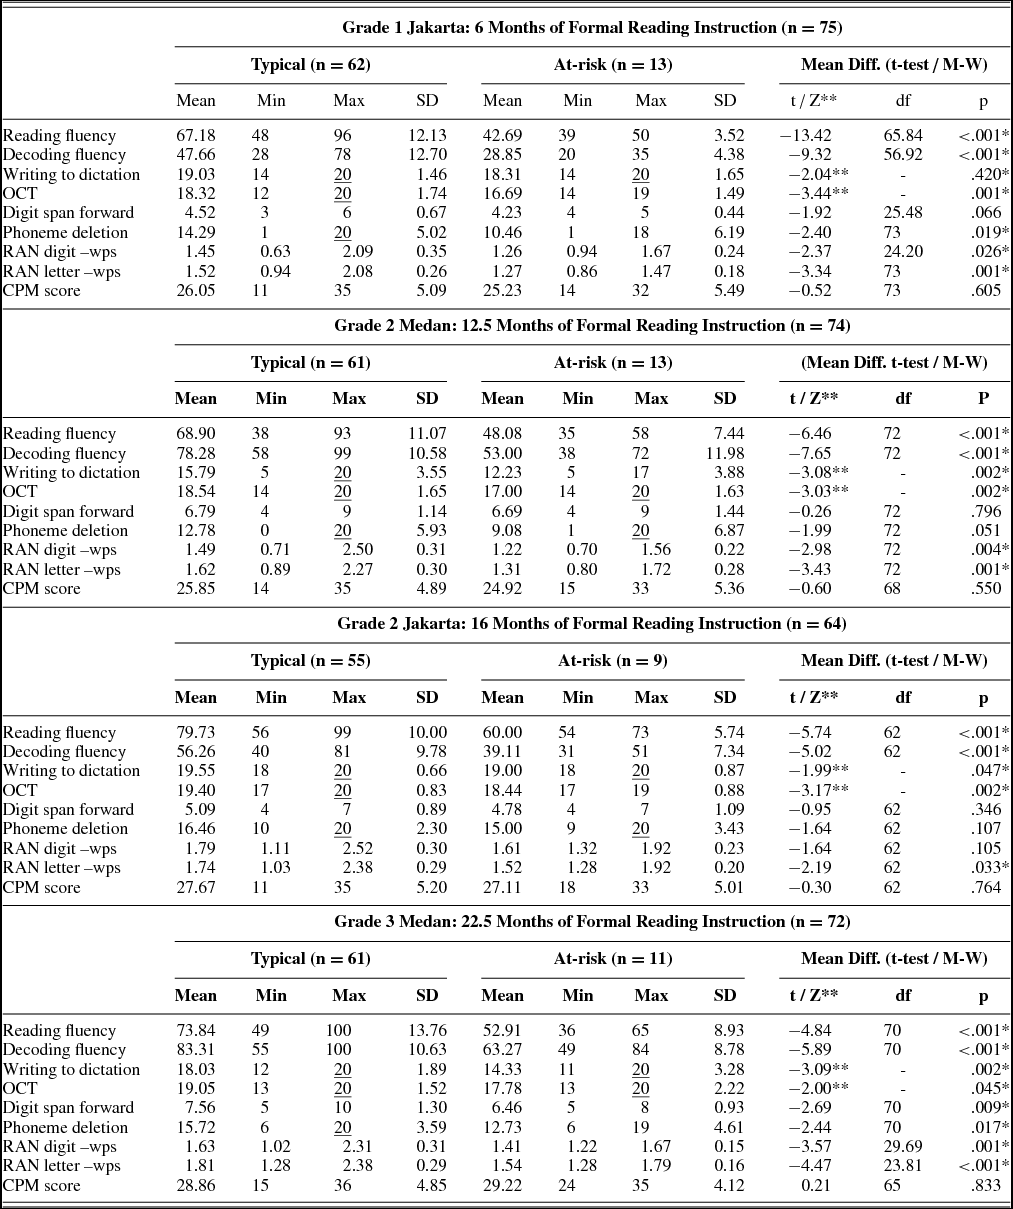
As shown in Table 5 (see Results section), scores on the OCT and writing to dictation tasks were close to ceiling, especially among typical readers. This was not the case for the other measures included. Using a nonparametric test, the mean differences between typical and at-risk readers on these spelling and orthographic knowledge tasks were still significant. Hence these tasks still had added value in distinguishing between typical and at-risk readers, although they played a much smaller role in the categorization of at-risk individuals than reading and decoding fluency as shown in Table 4.
Numbers of students classified as at risk of dyslexia per sample and grade

Note: *Excluding Reading & Decoding ≤ 10th; **Excluding Spelling & Writing ≤ 10th.
Descriptive statistics and t-test / Mann-Whitney U-test results for the typical and at-risk readers per sample and grade

Note: *Mean difference is significant at the 0.05 level; CPM = Raven's Coloured Progressive Matrices;
OCT = orthographic choice test; RAN wps = rapid automatized naming score in words per second.
Underlined are those maximum scores that equal the task's absolute maximum.
** Due to ceiling effects, a non-parametric test (i.e. Mann-Whitney U-test) was used to assess group differences in OCT and writing to dictation scores.
Criteria for the categorization
Using similar dyslexia criteria to those proposed for young Dutch language learners (van der Leij et al., Reference van der Leij, van Bergen, van Zuijen, de Jong, Maurits and Maassen2013), we categorized individual students as being at risk of dyslexia using the following criteria describing two at-risk categories for dyslexia in SI (see Jap et al., Reference Jap, Borleffs and Maassen2017). The cutoff values for these percentile criteria were calculated by using the means and standard deviations (with Z critical values) for each subsample (e.g., P10 = mean – 1.28 SD). The first category includes poor readers and/or decoders with scores:
a. ⩽ 10th percentile on reading fluency and ⩽ 40th percentile on decoding fluency.
or
b. ⩽ 10th percentile on decoding fluency and ⩽ 40th percentile on reading fluency.
The second category includes poor spellers combined with relatively poor reading and/or decoding skills. This category includes readers with scores:
⩽ 20th percentile on reading fluency and/or decoding fluency.
and
a. ⩽ 10th percentile on active spelling (writing to dictation) and ⩽ 40th percentile on passive spelling (OCT).
or
b. ⩽ 40th percentile on active spelling (writing to dictation) and ⩽ 10th percentile on passive spelling (OCT).
Table 4 lists the students who were identified as being at risk of dyslexia using these cutoff criteria.
As shown in Table 4, three children met the at-risk criteria solely based on spelling and orthographic knowledge. It is worth noting, however, that these three students in at-risk Category 2 not only did very poorly on the spelling and orthographic knowledge tasks (<10th percentile on the one, and <40th percentile on the other) but also had scores between the 12th and 18th percentile on reading fluency. Their scores were not low enough to be included in at-risk Category 1, but were, in combination with their low spelling and/or orthographic knowledge scores, poor enough to be viewed as at risk of dyslexia.
We will next present the variable descriptives and group comparison results, followed by the prediction of individual cases using the counting-deficits method and the prediction of individual cases based on the linear regression fit, and finally the overall model fit.
RESULTS
Table 5 lists the performance scores and results of the comparisons between the “typical” and “at-risk” groups for the first and second graders of the Jakarta and the second and third graders of the Medan sample. Outliers were moved to the end of the distribution, which was set at 2.3 SD from the within-subsample task mean. In addition, two participants were excluded because more than two of their task scores were regarded outliers (i.e., more than 2.3 SD below the within-subsample task mean).
It is important to note that while the at-risk group scored lower on numerous variables, the group had average or above average nonverbal intelligence (as tested with the CPM), and that group scores were not significantly different across grades. All four subsamples showed significant group variations in reading and decoding fluency, writing to dictation and orthographic knowledge (OCT). This is unremarkable because these four variables are part of the criteria used for the categorization of readers. In addition, after 6 months of reading instruction (Grade 1 Jakarta), the at-risk group scored significantly lower on phoneme deletion and both RAN tasks. At 12.5 months (Grade 2 Medan), the at-risk group scored significantly lower on both RAN tasks. After 16 months (Grade 2 Jakarta), the at-risk group had significantly lower scores on RAN letters only. Finally, after 22.5 months of reading education (Grade 3 Medan), group differences were found on all tasks except for the CPM nonverbal intelligence test. As shortly noted earlier, especially among typical readers, the mean task scores across grades on the OCT and writing to dictation came close to these tasks’ absolute maximum score (i.e., underlined maximum scores in Table 5) even though task complexity had been increased for the Medan sample. Nonetheless, the mean differences between typical and at-risk readers were still significant as shown by the Mann–Whitney U test results.
Predicting individual cases: Counting deficits
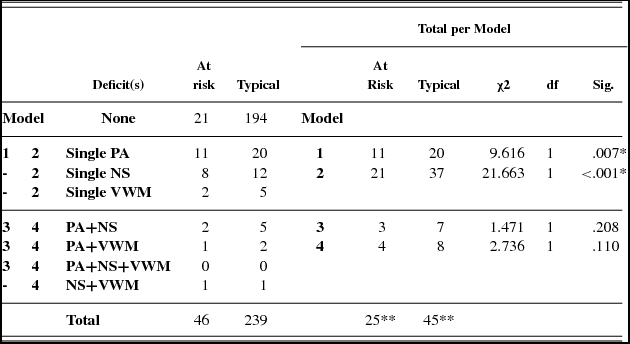
We next combined the Jakarta and Medan samples including both typical and at-risk readers from all grades. We first applied the counting-deficit method on each subsample separately, but as this resulted in similar patterns of deficits, we decided to present a cross-tabulation of the results of the combined sample (Table 6). Note that the single phonological deficit model (Model 1) is a subset of the single deficit subtypes model (Model 2). The phonological core, multiple deficit model (Model 3) is a subset of the multiple deficit model (Model 4). The chi-squares show that the categorical variables model (Model X vs. total) and dyslexia (at-risk vs. typical reader) are associated for Model 1 and Model 2 in the combined sample; for example, the proportion of at-risk children with a single deficit according to these models (21 out of 46) is higher than the base rate (46 at risk and 239 typical readers). Using Fisher's exact test, this difference was significant for Models 1 (p = .007) and 2 (p < .001).
Cross-tabulation counting-deficits method for the combined sample

Note: PA = phonological awareness; NS = naming speed; VWM = verbal working memory.
Model numbers in first two columns indicate which rows belong to which model.
* χ2 significant at the 0.05 level; **Sum of children included in models 2 and 4.
With both samples combined, 46 at-risk cases were identified, of which 54% (25/46) had one or more deficits, compared to 19% (45/239) of the typical readers. Of the at-risk cases with deficits, 65% (14/25) had single or multiple deficits including PA, 44% (11/25) including NS, and 16% (4/25) including VWM; 16% (4/25) had multiple deficits and 84% (21/25) a single deficit.
Predicting individual cases: Linear regression fit
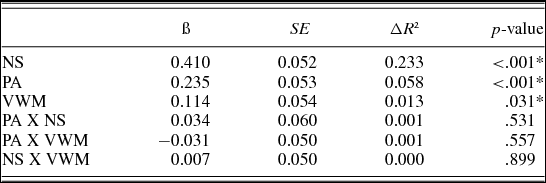
A factor score was created for reading and decoding fluency and used as the dependent variable in the linear regression. We next used the combined sample including both typical and at-risk readers from all grades, for which three single predictor regression equations were fit with PA, NS, or VWM as predictor. The strongest single predictor was NS (accounting for 23.3% of the variance in reading and decoding skill), followed by PA (10.8%) and VWM (6.2%). Then we determined the best multiple predictor equation for the combined sample (Table 7). The full model fit, as indicated by R² was .306. The single predictors NS, PA, and VWM together resulted in an R² of .305. The ΔR²s for the interaction variables were nonsignificant, while the added value of VWM in the multiple predictor equation was significant but small. We therefore decided to continue with the three single predictor regression equations and a multiple regression model including PA and NS (PA + NS). The interaction PA × NS × VWM was not included because there was no individual with all three deficits (see Table 6).
Linear regression equations for the combined sample (with factor score reading/decoding fluency as the dependent variable)

Note: PA = phonological awareness; NS = naming speed; VWM = verbal working memory.
* Significant at the 0.05 level
Overall model fit
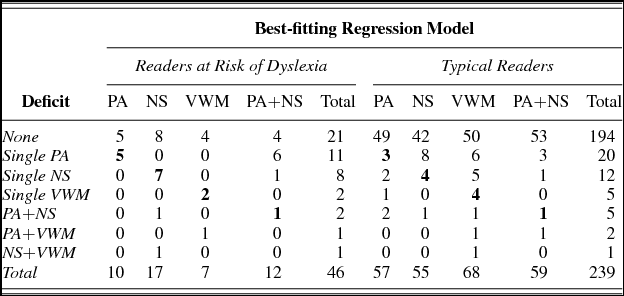
As mentioned above, 54% of the at-risk cases identified had one or more deficits (25/46). The cross-tabulation of the overall model fit (Table 8) shows that for these 25 at-risk cases, the individual prediction by a given model with the deficit threshold set at the 10th percentile corresponded in 60% (15/25) to the best fitting regression equation, as calculated by adding together the bold-faced entries in Table 8. Hence, 33% (15/46) of the total number of at-risk cases may be regarded “a good fit” to one of Pennington et al.’s predictor models. Taking a closer look at the cases where threshold and regression models did not fit, we found that the majority either had no deficit or fitted the multiple predictor regression model best but had a single PA deficit only. A smaller number of at-risk cases fitted the single predictor NS or VWM regression model but had multiple deficits, or they fitted the multiple predictor regression model best while having a single NS deficit.
Cross-tabulation of the overall model fit based on number of deficits and regression fits of individual cases

Note: PA = phonological awareness; NS = naming speed; VWM = verbal working memory.
As expected, the large majority of typical readers had no deficits (194/239, or 81%) based on the 10th percentile cutoff. Of the 45 cases that did have one or more deficits (45/239, or 19%), 12 (27% of 45) coincided with the regression model and cross-tabulation. Similar to the at-risk readers, there was considerable heterogeneity in terms of regression model fits.
Considering the five models one by one, we could quickly reject Model 1 (single phonological deficit), as, contrary to the large majority it predicts, only 11% (5/46) of the at-risk cases had a PA deficit and fit this model best (Table 8). Besides, some of the remaining cases did fit the multiple regression equation. Moreover, rather than PA, NS predicted reading and decoding fluency best. As only 30% (14/46) of all at-risk cases had a (single or multiple) deficit involving PA, a deficit in PA appeared not to be necessary to be at risk of dyslexia in SI, nor was a single deficit in PA sufficient given that 8% (20/239) of all typical readers also had a single deficit in PA.
Model 2 (single deficit subtypes) provided a good fit in 30% (14/46) of the at-risk cases, including 5 with the abovementioned single PA deficit. Some of the remaining at-risk cases did fit the multiple regression equation. Although NS and VWM had incremental validity in predicting individual differences in reading skills beyond PA, we can still reject Model 2; a deficit in VWM or NS was not sufficient to be at risk of dyslexia either as 7% (17/239) of the typical readers also had a single deficit in NS or VWM.
Models 3 and 4 (phonological core, multiple deficit and multiple deficit, multiple predictor, respectively) can also be rejected because they only provided a good fit to one of the at-risk cases (1/46; 2%). As the at-risk subgroup with a single deficit outnumbered the subgroup with multiple deficits, we concluded that a second or third deficit was not necessary to be at risk of dyslexia in SI.
Encompassing all four models and combining all at-risk cases shown to be a good fit to any of these, the hybrid model provided a good fit to 33% (15/46) of the at-risk cases. Nonetheless, even this fifth model did not come close to accounting for the majority of at-risk readers. Substantial numbers of these cases fitted the single deficit models, but, contrary to what the hybrid model predicted, only a few fitted the multiple deficit models.
DISCUSSION
Although children with dyslexia exhibit common phonological deficits in different languages and predictors of reading skills are relatively universal (Ziegler & Goswami, Reference Ziegler and Goswami2005), their precise weights vary depending on the transparency of the orthography. Due to the complex interplay of multifactorial causes and risk factors (Peterson & Pennington, Reference Peterson and Pennington2015), no consensus has yet been reached about the cross-linguistic validity of single and multiple deficit models of dyslexia.
We adopted Pennington et al.’s approach (Reference Pennington, Santerre-Lemmon, Rosenberg, MacDonald, Boada, Friend and Olson2012) to study the individual predictor profiles in our 285 young learners of SI and assessed the feasibility of their multiple-case approach to dyslexia in this highly transparent orthography. Using a newly developed reading assessment battery and preliminary criteria for the identification of readers at risk of dyslexia in SI, we evaluated the children's reading and related abilities and marked them as typical readers or readers at risk of developing dyslexia.
We reached a similar conclusion as Pennington et al. in their paper, namely, that the relationship between predictors and reading skill in SI is probabilistic, not deterministic. Accounting for 33% of the at-risk cases that satisfied both methods of individual prediction (i.e., classification of deficits and regression analysis), the hybrid model also proved the most valid for our data. Still, a few critical notes are required here. When comparing our results with the results obtained by Pennington et al. (Reference Pennington, Santerre-Lemmon, Rosenberg, MacDonald, Boada, Friend and Olson2012), the hybrid model accounted for 39%–46% of dyslexic cases in Pennington et al.’s samples and thus was their best fitting model, but the number of cases that fitted the single predictor models (24%–28%) and the multiple predictor models (11%–22%) were both substantial. Our data, however, showed that 30% of the at-risk cases fitted the single predictor models but only 2% the multiple predictor model. Accordingly, none of Pennington et al.’s models was sufficiently supported by our results to confirm their validity in our SI sample.
Fifty-four percent of the children we classified as at risk of dyslexia had one or more deficits, with 84% having a single deficit in PA, NS, or VWM, and 16% having multiple deficits, which prompts the conclusion that there are multiple pathways to being at risk of dyslexia in SI; the remaining 46% were at risk without any deficits in PA, NS, or VWM. The percentage of dyslexic children with one or more deficits in Pennington et al.’s samples was 68%–78%. Loosening our rather strict cutoff at the 10th percentile would have resulted in deficit numbers closer to the ones obtained in Pennington et al.’s samples and would probably have led to a higher fit between the deficits and the regression models, but would not have allowed for comparison to the original study. A possible explanation for the lower numbers obtained could be that our test results might have had a higher “noise” level when compared to the testing conducted by Pennington et al., who used highly optimized tasks that provide enough variance and that have already been used in previous studies. The reading assessment battery and categorization criteria we used are recent and will require further optimization and validation.
Although only 3 out of 46 children met the at-risk criteria solely based on spelling and orthographic knowledge, we believe that there are enough grounds to maintain our current criteria. Several studies, including some conducted in transparent orthographies, have demonstrated that children with reading difficulties are often poor in both reading and spelling (de Jong & van der Leij, Reference de Jong and van der Leij2003; Eklund et al., Reference Eklund, Torppa, Aro, Leppänen and Lyytinen2015; Pennington & Lefly, Reference Pennington and Lefly2001; Puolakanaho et al., Reference Puolakanaho, Ahonen, Aro, Eklund, Leppänen, Poikkeus and Lyytinen2008; van Bergen, de Jong, Plakas, Maassen, & van der Leij, Reference van Bergen, de Jong, Plakas, Maassen and van der Leij2012). In line with that, we found the three students to be poor spellers, as well as relatively poor readers (scores below the 18th percentile on reading fluency). Moreover, about a third to a quarter of the children with severe reading problems in our sample also had severe difficulties in spelling and/or orthographic knowledge (see Table 5). Spelling, in addition to reading, therefore plays an important role in determining a targeted treatment plan after the dyslexia diagnosis has been confirmed.
It is worth mentioning, however, that the results we obtained may have been influenced by the level of the task content. Even though task complexity had already been increased for the Medan sample, the mean task scores across grades on the OCT and writing to dictation came close to these tasks’ absolute maximum score (see Table 4), especially among typical readers. We consequently propose to further increase the complexity of these spelling tests for future use to augment the discriminatory potential of these spelling measures.
Another limitation of our study worth noting is the smaller sample size compared to Pennington et al. Moreover, our samples consisted of students from middle-class families, speaking SI as their first language, and all attending an elementary school in two of Indonesia's largest cities. Eleven percent of the variance (see Table 3 for PCA components) was explained by the sample category (i.e., Jakarta or Medan) component. As such, the test scores we acquired may not be representative of young learners of SI in other regions and will be less generalizable than Pennington et al.’s data derived from a cross-sectional and a longitudinal study. To collect more generalizable data, assessments need to be conducted in other parts of the country, including a larger variety of ethnic groups and different socioeconomic backgrounds. Nonetheless, the results we obtained do highlight the wide variation in individual cognitive profiles in both typical and at-risk readers of this highly transparent orthography. Most important, the present set of data will contribute to improving the discriminatory power of the assessment of reading acquisition and the early detection of reading difficulties in beginner learners of SI.
The difference between studies on the relative weight of the predictors of reading may relate to the transparency of the orthography but also to the developmental phases of reading. Consistent with a multiple deficit hypothesis, the causes of dyslexia in SI seem complex and multifactorial. NS was the main predictor of reading and decoding fluency in SI, followed by PA and VWM. The importance of NS as a predictor of reading fluency has earlier been shown for other transparent orthographies such as Dutch (de Jong & van der Leij, Reference de Jong and van der Leij1999), Greek (Georgiou et al., Reference Georgiou, Parrila and Papadopoulos2008), and Finnish (Lepola et al., Reference Lepola, Poskiparta, Laakkonen and Niemi2005). In Pennington et al.’s samples, PA was the strongest single predictor of reading skill, followed by either language skills or processing speed/NS. Pennington et al. found no significant differences in terms of significance of relative importance of predictors when looking at the effect of the opaque English orthography versus the more transparent Norwegian writing script in the international sample, although it is worth noting that Pennington et al. only looked at data from kindergarten and first grade and not from older ages. Furnes and Samuelsson (Reference Furnes and Samuelsson2010) also drew a sample from the same international twin study used by Pennington et al., this time following individuals from Scandinavia (Norway and Sweden), Australia, and the United States from kindergarten through second grade. The authors concluded that whereas PA as a predictor of reading skill in the Scandinavian sample was limited to the end of first grade, it remained a significant predictor in the two English-speaking samples. NS was similarly predictive of reading at first and second grade across orthographies. When analyzing our data further per subsample with stepwise multiple linear regression including PA, NS, and VWM, we found a similar pattern for Grades 1 and 2 in Jakarta. While PA and NS were both significant predictors of reading and decoding fluency in first-grade Jakarta (PA: t = 2.09, p = .040; NS: t = 3.24, p = .002; partial correlation PA = .240, NS = .326), only NS remained a significant predictor in second grade (PA: t = 0.99, p = .323; NS: t = 6.17, p < .001; partial correlation PA = .127, NS = .617). However, the sizes of these subsamples are small, and both PA and NS remained significant predictors of reading and decoding fluency in Grades 2 and 3 in Medan.
Based on our classification criteria, 16% of our sample was found to be at risk of dyslexia. Depending on the definition, orthography, and criteria used, the prevalence of dyslexia in Western populations varies between 5% and 10%, and up to 17.5% for English speakers (Gilger, Pennington, & Defries, Reference Gilger, Pennington and Defries1991; Habib, Reference Habib2000; Shaywitz, Reference Shaywitz1998). The children who were categorized as at risk in our sample may have been behind in reading, decoding, and/or active and passive spelling, but it is important to bear in mind that they may not necessarily be dyslexic or develop dyslexia in the future. To the best of our knowledge, there currently is no other standardized, validated, and published test battery available yet for the assessment of early reading and spelling skills in SI than the one recently developed by Jap et al. (Reference Jap, Borleffs and Maassen2017). We acknowledge the relatively limited reliability statistics that are currently available for the measures used in this paper. However, strong correlations between reading fluency, decoding fluency, and the reading related skills, in addition to a reoccurring factor structure in the four subsamples (see Jap et al., Reference Jap, Borleffs and Maassen2017, for additional factor analyses conducted on the Jakarta sample), provide support for the reliability of our test battery. Future research dedicated toward further investigation of the reliability of these measures will have to point out how the assessment battery and the at-risk criteria may be further improved, and the reading-related cognitive tasks (e.g., phoneme deletion, RAN, and digit span) can provide valuable information to support this diagnostic process. Clearly, more research is needed using larger samples to further increase our understanding of dyslexia in the highly transparent SI language. We hope that the present study will turn out to be another step forward in the field of reading research in Indonesia.
ACKNOWLEDGMENTS
The author B. A. Jap is supported by an Erasmus Mundus grant for the International Doctorate for Experimental Approaches to Language and Brain (IDEALAB) by the European Commission (2012–1713/001–001-EMII EMJD).
The authors thank the students, their parents, and schools for their cooperation. Moreover, the authors thank Debby A. Daulay and Ade R. Siregar (University of Sumatera Utara, Medan, Indonesia) for providing access to the schools and assisting during data collection in Medan. Some of the data used is part of the project of the Science, Technology and Society (STS) Research Group Universitas Tarumanagara on Handling Children with Reading Difficulties, which used the same test battery. We thank the STS Research Group members who were involved in the data collection in Jakarta.