Introduction
Proper oocyte maturation is associated with the differentiation of surrounding somatic cumulus cells that form the structure called the cumulus–oocyte complex (COC) (Nagyová, Reference Nagyová2012; Kempisty et al., Reference Kempisty, Ziółkowska, Piotrowska, Zawierucha, Antosik, Bukowska, Ciesiółka, Jaśkowski, Brüssow, Nowicki and Zabel2013; Zhao et al., Reference Zhao, Ren, Du, Hao, Liu, Qin, Wang and Zhu2014). The bidirectional communications as well as paracrine interactions between these two populations of cells are important prerequisites for COC maturation and cumulus cells expansion.
Estrogen receptors (ERs) belong to the family of transcription factors that can bind to DNA-hormone response elements and activate the transcription of target genes (Kawashima et al., Reference Kawashima, Okazaki, Noma, Nishibori, Yamashita and Shimada2008; Motola et al., Reference Motola, Popliker and Tsafriri2008). ERs are also involved in the transduction of extracellular signals into transcriptional responses. It is well known that ERs modulate hormone metabolism in the ovary and in follicles, as well as are responsible for the maintenance of hormonal homeostasis in females (Soboleva et al., Reference Soboleva, Pleasants, van Rens, van der Lende and Peterson2004; Knapczyk et al., Reference Knapczyk, Duda, Durlej, Galas, Koziorowski and Slomczynska2008). Moreover, oocytes participate in ER activity by the synthesis and transfer of steroids during oogenesis and folliculogenesis (Schams & Berisha, Reference Schams and Berisha2002; Cardenas & Pope, Reference Cardenas and Pope2005). Usually, ER gene-encoded proteins are located, similarly to other steroid receptors, in the cell nucleus. The estrogen-related receptors (ERR) belong to the family of steroid/thyroid/retinoid receptors and are homologous to estrogen receptors. However, ERRs are unable to activate target gene transcription in response to estrogens. Doege et al. (Reference Doege, Inoue, Yamashita, Rhee, Travis, Fujita, Guarnieri, Bhagat, Vanti, Shih, Levine, Nik, Chen and Abeliovich2012) described an essential role of ERRβ in somatic cell reprogramming and induction of transcription at endogenous pluripotency loci such as NANOG, OCT4, SOX2, KLF4 and MYC. Moreover, Luo et al. (Reference Luo, Sladek, Bader, Matthyssen, Rossant and Giguère1997) demonstrated that ERRβ is crucial for placental development as well as the death of homozygous null mutants due to defective diploid trophoblast proliferation. Therefore, the relationship between expression of ERRs and proliferative activity of cells still needs future investigation.
Progesterone (P4) plays a substantial role in folliculogenesis, as well as in embryogenesis and maintenance of pregnancy. Recently, it was reported (Fair & Lonergan, Reference Fair and Lonergan2012) that P4 also regulates important steps in oocyte maturation and ovulatory follicle development. Proteins encoding progesterone receptors (PGRs) appear to be distributed in the cell nucleus (classic form of PGR) or in the cell membrane as a progesterone receptor-membrane component (PGRMC1) (Elassar et al., Reference Elassar, Liu, Scranton, Wu and Peluso2012; Saint-Dizier et al., Reference Saint-Dizier, Sandra, Ployart, Chebrout and Constant2012; Slonina et al., Reference Slonina, Kowalik and Kotwica2012). Although the role of estrogen and progesterone receptors in the reproductive cycle and ovulation in mammals has been described, it is still not fully known whether ERs, PGRs or PGRMC1s are expressed in cumulus cells or whether they are involved in gap-junction communication (GJC) activity in porcine COCs. Moreover, it remains unclear whether the expression and/or cellular distribution of these steroid hormone receptors is associated with the proliferative capacity of cumulus cells.
Therefore, the aim of our study was to analyze the expression and distribution of ERRs, PGR and PGRMC1 proteins in porcine cumulus cells with relation to the real-time proliferation and the time-dependence of in vitro cultivation.
Materials and methods
Animals
Forty-four puberal cycling crossbred Landrace gilts with a mean age of 170 days (standard error (SE) ± 2) and weight of 98 kg (SE ± 2) were used in this study. Follicles were collected only from ovaries where corpora lutea were present. The animals used in the experiments were not synchronized. The gilts were all kept under identical conditions.
Collection of porcine ovaries and cumulus-oocyte complexes (COCs)
The ovaries and reproductive tracts were recovered immediately after slaughter and transported to the laboratory within 10 min at 38ºC in 0.9% NaCl. To provide optimum conditions for subsequent oocyte maturation in vitro, the ovaries of each animal were placed in 5% fetal bovine serum (FBS; Sigma-Aldrich Co., St. Louis, MO, USA) in phosphate-buffered saline (PBS) (Al-Aghbari & Menino, Reference Al-Aghbari and Menino2002; Nascimento et al., Reference Nascimento, Albornoz, Che, Visintin and Bordignon2010). Single large follicles (>5 mm) were opened by puncturing with a 20-G needle connected to a 5 ml syringe and COCs were liberated in a sterile Petri dish and then were recovered. After washing three times with modified PBS supplemented with 36 μg/ml pyruvate, 50 μg/ml gentamycin, and 0.5 mg/ml bovine serum albumin (BSA) (Sigma-Aldrich, St. Louis, MO, USA) the COCs were selected under an inverted microscope (Zeiss, Axiovert 35, Lübeck, Germany), counted, and morphologically evaluated with special care, using the scale that was suggested by Jackowska et al. (Reference Jackowska, Kempisty, Antosik, Bukowska, Budna, Lianeri, Rosińska, Woźna, Jagodziński and Jaśkowski2009). Only grade I COCs with homogeneous ooplasm and uniform and compact cumulus cells were considered for use in the following steps of the experiment, resulting in the use of at least 300 grade I COCs.
Assessment of oocytes using the brilliant cresyl blue (BCB) test
To perform the BCB staining test, COCs were washed twice in modified Dulbecco PBS (DPBSm; Sigma-Aldrich, St. Louis, MO) that was supplemented with 50 IU/ml penicillin, 50 μg/ml streptomycin (Sigma-Aldrich, St. Louis, MO, USA), 0.4% [w/v] BSA, 0.34 mM pyruvate, and 5.5 mM glucose (DPBSm). Thereafter, the COCs were treated with 26 μM BCB (Sigma-Aldrich, St. Louis, MO) and diluted in DPBSm at 38.5°C and 5% CO2 in air for 90 min. After treatment, the oocytes were transferred to DPBSm and washed twice. During the washing procedure, the oocytes were examined under an inverted microscope and were classified as either being stained blue (BCB+) or remaining colorless (BCB−). Only the BCB+ COCs were used in the ongoing experimental steps.
In vitro cumulus cell cultivation using a real-time cell analyzer (RTCA)
The cumulus cells (CC) were separated from COCs after using bovine testicular collagenase (50–200 units/ml in Hank's balanced salt solution (HBSS); Sigma-Aldrich, St. Louis, MO, USA) for 10 min at 38ºC and then cultured for 96 h in separate cultures. Cell cultures were transferred into an E-Plate 48 in an RTCA (Roche-Applied Science, GmbH, Penzberg, Germany), consisting of an RTCA Analyzer, an RTCA SP Station and RTCA Software. The CC were then cultured in 200 μl of culture medium that consisted of TCM-199 and l-glutamine (Gibco BRL Life Technologies, Grand Island, NY, USA) and was supplemented with 2.2 mg/ml sodium bicarbonate (Nacalai Tesque, Inc., Kyoto, Japan), 0.1 mg/ml sodium pyruvate (Sigma-Aldrich, St. Louis, MO, USA), 10 mg/ml BSA (Sigma-Aldrich, St. Louis, MO, USA), 0.1 mg/ml cysteine (Sigma-Aldrich, St. Louis, MO, USA), and 10% (v/v) filtered porcine follicular fluid and gonadotropin supplements at final concentrations of 2.5 IU/ml human chorionic gonadotropin (hCG) (Ayerst Laboratories, Inc., Philadelphia, PA, USA) and 2.5 IU/ml eCG (Intervet, Whitby, ON, Canada), respectively. The CC were cultured for 0–96 h at 38.5C under 5% CO2 in air. After 96 h of IVC, the CCs were treated with trypsin (0.25% trypsin in a balanced salt solution, Sigma-Aldrich, St. Louis, MO, USA). Thereafter, the cumulus cell layers were removed by vortexing and pipetting in 1% sodium citrate buffer and by mechanical displacement using a small-diameter glass micropipette. After cultivation the proliferation index was determined, and the CCs were also analyzed using a confocal microscope.
The cell index (CI) was evaluated at four steps of cultivation (0 h–96 h, 0 h–9 h, 8 h–62 h, 58 h–96 h) to determine the relative and quantitative changes in electrical cell impedance. The cell status was determined using RTCA software.
Confocal microscope analysis of protein levels and distribution in CCs
At 0 h and at 96 h of culture, CCs were collected, fixed using acetone-methanol (1:1) for 10 min at –20°C and were washed three times in PBS/PVP (0.2%). To block non-specific binding, the samples were incubated in 3% BSA in PBS with 0.1% Tween-20 for 30 min at room temperature (RT). The CC were incubated for 1 h at RT with a rabbit polyclonal anti-PGR antibody (Ab) (H-22), rabbit polyclonal anti-PGRMC1 (Ab) (Ser 279/282), rabbit polyclonal anti-ERRγ (Ab) (H-38) and rabbit polyclonal anti-ERRβ/γ (Ab) (H-66) (Santa Cruz Biotechnology, Santa Cruz, CA, USA). The antibodies were diluted 1:500 in PBS with 1.5% BSA and 0.1% Tween-20. After several washes with PBS containing 0.1% Tween-20, the samples with the primary antibodies anti-PR, anti-PGRMC1, anti-ERRγ and anti-ERRβ/γ were incubated for 1 h at RT with a fluorescein isothiocyanate (FITC)-conjugated goat anti-rabbit IgG Ab diluted 1:500 in PBS containing 0.1% Tween-20. After being washed in PBS containing 0.1% Tween-20, the CCs were stained with 0.1 μg/ml 4′,6-diamino-2-phenylindole (DAPI; Santa Cruz Biotechnology, Santa Cruz, CA, USA) in mineral oil, mounted in an antifade medium on glass slides and examined with an LSN 510 confocal system with an Olympus FluoView 10i microscope. FITC was excited at 488 nm using an argon laser, and the emission was imaged through a 505–530 nm filter. All confocal microscopic images were analyzed using Imaris 7.2 software (BitPlane, Zurich, Switzerland).
Statistical analysis
One-way analysis of variance (ANOVA) and a subsequent Tukey post test were used to compare the results of real-time quantification of the proliferation index. The results quantifying the cell proliferation index were obtained using an RTCA system. The differences were considered to be significant at *P < 0.05, **P < 0.01 and ***P < 0.001 for the RTCA analyses and were evaluated by comparing the results obtained in five replicates of identical recovered CC. The statistical calculations were applied to compare the results in each investigated group to the highest proliferation index at the respective time point. The software program GraphPad Prism version 4.0 (GraphPad Software, San Diego, CA) was used for the statistical calculations. To analyze the fluorescence intensity of normalized protein expression levels, the Imaris 7.2 software (BitPlane, Zurich, Switzerland) (Olympus FluoView 10i), was applied.
Results
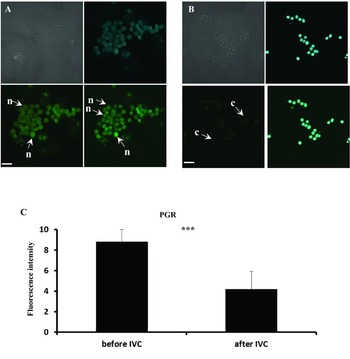
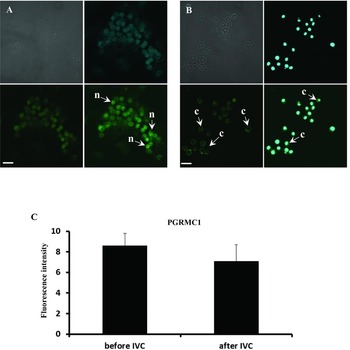
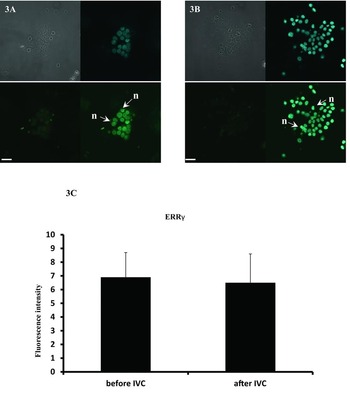
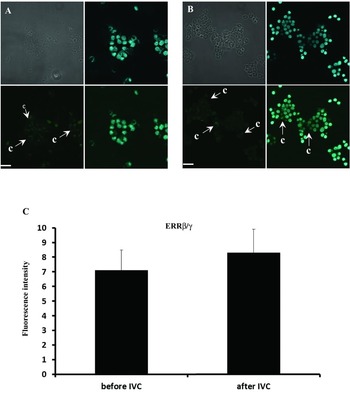
Based on confocal microscopic observations, the expression and cellular distribution of PGR, PGRMC1, ERRγ and ERRβ/γ proteins, were analyzed. The confocal microscopic figures consist of four images: phase contrast, DAPI-stained cell nucleus, fluorescence observation of antibody staining, and both DAPI and antibody stained CCs, respectively. We found a significantly higher (P < 0.001) PGR expression in control cells (at 0 h, i.e. before IVC) compared with that after 96 h of IVC (Fig. 1 A–C). At 0 h, the PGR protein was distributed in the nucleus; after 96 h of culture, it was detectable also in the cytoplasm. The PGRMC1 protein was expressed in cells of the nucleus and cytoplasm. However, in control cells this protein was localized in the cell nucleus, whereas after 96 h of culture a significant cytoplasmic distribution of PGRMC1 was observed (Fig. 2 A–C). Regarding ERRγ, the expression level of this protein was similar at 0 h and at 96 h of culture, and in both cases a nuclear distribution of ERRγ was found (Fig. 3 A–C). The expression level of ERRβ/γ was similar in cells at 0 h and after 96 h of culture and the receptor was always distributed only in the cytoplasm (Fig. 4 A–C; Fig. 6).
Confocal microscopic observation of PGR protein levels and cellular distribution in porcine CCs at 0 h and after 96 h of culture. The CCs that were collected at 0 h (control), (A) and after 96 h (B) of culture were stained with DAPI in mineral oil following staining for porcine PGR (rabbit polyclonal anti-PGR Ab). Secondary antibodies were labeled with FITC, which emits a green fluorescent signal after excitation at 488 nm. Scale bars represent 10 μm. The fluorescence intensity of antibody staining is presented (C). n, nucleolar localization, c, cytoplasmic localization. ***P < 0.001.

Confocal microscopic observation of PGRMC1 protein levels and cellular distribution in porcine CCs at 0 h and after 96 h of culture. The CCs that were collected at 0 h (control), (A) and after 96 h (B) of culture were stained with DAPI in mineral oil following staining for porcine PGRMC1 (rabbit polyclonal anti-PGRMC1 Ab). Secondary antibodies were labeled with FITC, which emits a green fluorescent signal after excitation at 488 nm. The scale bars represent 10 μm. The fluorescence intensity of antibody staining is presented (C). n, nucleolar localization, c, cytoplasmic localization.

Confocal microscopic observation of ERRγ protein levels and cellular distribution in porcine CCs at 0 h and after 96 h of culture. The CCs that were collected at 0 h (control), (A) and after 96 h (B) of culture were stained with DAPI in mineral oil following staining for porcine ERRγ (rabbit polyclonal anti-ERRγ Ab). Secondary antibodies were labeled with FITC, which emits a green fluorescent signal after excitation at 488 nm. The scale bars represent 10 μm. The fluorescence intensity of antibody staining is presented (C). n, nuclear localization, c, cytoplasmic localization.

Confocal microscopic observation of ERRβ/γ protein levels and cellular distribution in porcine CCs at 0 h and after 96 h of culture. The CCs that were collected at 0 h (control), (A) and after 96 h (B) of culture were stained with DAPI in mineral oil following staining for porcine ERRβ/γ (rabbit polyclonal anti-ERRβ/γ Ab). Secondary antibodies were labeled with FITC, which emits a green fluorescent signal after excitation at 488 nm. The scale bars represent 10 μm. The fluorescence intensity of antibody staining is presented (C). n, nucleolar localization, c, cytoplasmic localization.

The RTCA analyzing system was applied to investigate the real-time proliferation of CCs and to determine the CI during 96 h of culture. When analyzing the CI between 0 h and 96 h of cultivation, we found differences in the proliferation index at two of the five investigated time points (P < 0.01) (Fig. 5 A). Although soon after 8 h of IVC, a significant increase in proliferation was detected (Fig. 5 B, C), no differences in the proliferation index were observed from 0–8 h and 8–62 h. However, an increased change in the proliferation index was observed between 58 h and 96 h of culture, in two of the five groups investigated (P < 0.001) (Fig. 5 D). Figure 5 represents various stages of cell proliferation during 96 h of culture, including the following stages: lag phase, log phase (with increased proliferation index), medium replacement and proliferation index differences.
Cell proliferation index of cumulus cells cultivated for 96 hours. The cumulus cells were immediately transferred into an E-Plate 48 of a real-time cell analyzer (RTCA, Roche-Applied Science, GmbH, Penzberg, Germany). The experiment consisted of five replicates involving cultivation of the separated population of collected cells at the same time. At every step of the experiment, the cells proliferation index was assessed in real-time in vitro cultivation for the time periods of 0–96 h (A), 0–9 h (B), 8–62 h (C), and 58–96 h (D). The differences were considered to be significant at the level of *P < 0.05, **P < 0.01 and ***P < 0.001. The rows A, B, C, D and E described five times replicated RTCA assay with using collected populations of cultured cumulus-enclosed oocytes cells.

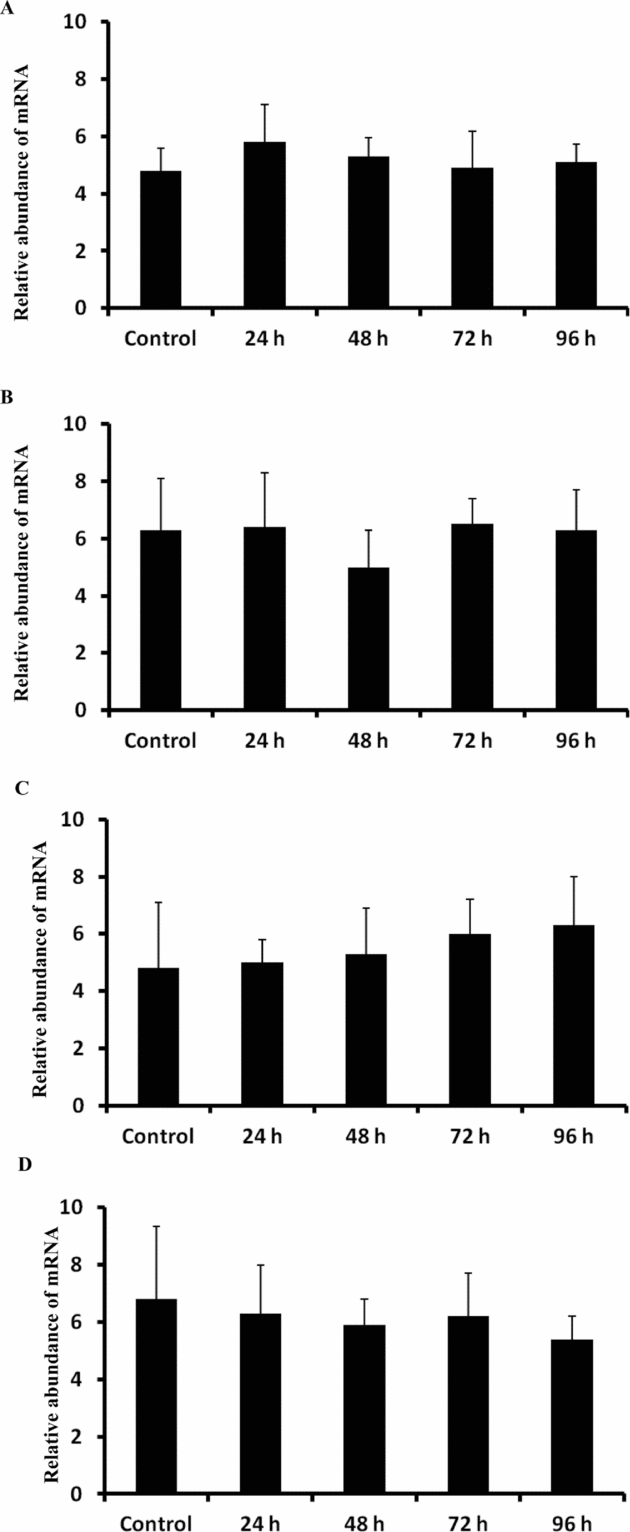
Relative abundance of PGR, PGRMC1, ERRγ and ERRβ/γ transcripts in porcine cumulus cells analyzed in control (at 0 h) and after 24 h, 48 h, 72 h and 96 h of IVC. Porcine cumulus cells were isolated from COCs of pubertal gilts and immediately used to isolate RNA, which was reverse-transcribed into cDNA. The relative abundance of PGR (A), PGRMC1 (B), ERRγ (C) and ERRβ/γ (D) mRNAs was evaluated by qRT-PCR analysis before (at 0 h) and after 24 h, 48 h, 72 h and 96 h of IVC.

Discussion
Several studies have found that the bidirectional communication between oocytes and the surrounding somatic CC is responsible for proper maturation of COCs (Pant et al., Reference Pant, Reynolds, Luther, Borowicz, Stenbak, Bilski, Weigl, Lopes, Petry, Johnson, Redmer and Grazul-Bilska2005; Bagg et al., Reference Bagg, Nottle, Armstrong and Grupen2009; Li et al., Reference Li, Mao and Xia2012). Such experiments have been performed using enclosed or separated oocyte models (Feng et al., Reference Feng, Shi, Yang and Wang2013; Mao et al., Reference Mao, Li, Bian, Han, Guo, Xu, Zhang and Xia2013). However, oocytes separated from CC have only a small chance to mature in vitro and reach the MII stage because of the lack of several important substances transferred by the GJC (Hirao, Reference Hirao2011; Gomez et al., Reference Gomez, Kang, Koo, Kim, Kwon, Park, Atikuzzaman, Hong, Jang and Lee2012; Ju & Rui, Reference Ju and Rui2012). One important indicator of the maturation of COCs is the process of cumulus expansion (Qiu et al., Reference Qiu, Lu, Ji, Song, Lu, Zhang and Lu2008; Procházka et al., Reference Procházka, Petlach, Nagyová and Nemcová2011; Nagyová, Reference Nagyová2012). It is still not fully known whether cumulus expansion is associated with the proliferation of these cells. There is also a lack of data which demonstrates that the surrounding CC may have a maturation potential and accumulate, similarly to oocytes, amounts of mRNA or proteins during IVM. In the present study, we investigated the protein expression and cellular distribution of estrogen (ERRγ, ERRβ/γ) and progesterone receptors (PGR, PGRMC1) in relation to the real-time proliferation of CC before and after IVC. Additionally, the real-time proliferative ability of CCs in culture is presented for the first time. We observed that the expression of these proteins was either decreased (PGR) or unchanged when comparing the time-window before and during the 96-h IVC. Hence, we hypothesize that CC do not accumulate a large amount of proteins during cultivation compared with cumulus–oocyte complexes. However, the proteins differ regarding their cellular distribution. In the case of PGR and PGRMC1, both proteins were distributed before IVC in the cell nucleus and after 96 h of cultivation in the cytoplasm. The nuclear localization of PGR in CC recovered from follicles of cycling puberal gilts before IVC may display a normal level of P4 in follicular fluid, and therefore proper availability of agonist as well as the mechanism of ligand-receptor binding. This part of our experimental results shows that steroid hormone receptors might be distributed in the cell nucleus or cytoplasm, which may be related to ligand availability in a cultivation environment, too. Similar results were obtained by Shimada et al. (Reference Shimada, Yamashita, Ito, Okazaki, Kawahata and Nishibori2004) where the expression of two PGR isoforms (PRA and PRB) in porcine CC in relation to meiotic resumption and in vitro proliferation were investigated. They found that the PRB protein was up-regulated in the first 8 h of IVC and reached its maximum at 4 h–12 h of cultivation. The PRA protein predominated in CCs at 20 h. Moreover, an increased proliferative activity of CCs was observed during the first 10 to 20 h of IVC. It has been suggested that the binding of progesterone to related receptors as well as GJC activity has an effect on the proliferative activity of CCs (Shimada et al., Reference Shimada, Yamashita, Ito, Okazaki, Kawahata and Nishibori2004). Furthermore, these findings could be associated with the shift from PRB to PRA, which may play an important role in the proliferation and differentiation of CCs. Contrary to their findings, we did not observe any correlation between the proliferation of CCs and the expression of PGR, which could be explained by the time-dependent down-regulation of PGR expression. Moreover, after 96 h of IVC, PGR was transferred from the nucleus to the cytoplasm, which suggested that the P4 hormone-receptor binding might activate a negative feedback that leads to the inhibition of PGR expression. Additionally, PGR translocation from nucleus to cytoplasm during culture points to a reduction in P4 concentration in the culture. At present, there is only one report (Aparicio et al., Reference Aparicio, Garcia-Herreros, O’Shea, Hensey, Lonergan and Fair2011) that indicated the expression of PGRMC1 as a non-genomic progesterone receptor in bovine COCs and separated CC. Using western blotting and immunofluorescence assays, the authors observed the expression of both genomic (PGR) and non-genomic (PGRMC1) receptors. They concluded that the expression of PGRs is mediated by P4 binding, which leads to the activation of an intracellular signaling pathway that activates both nuclear and membrane PGRs. These results and our findings demonstrated that both of these mechanisms influence CCs and oocytes in the process to achieve the developmental capacity.
The effect of estradiol-17beta (E2) on the nuclear and cytoplasmic maturation of porcine oocytes has been previously analyzed (Dode & Graves, Reference Dode and Graves2003). These authors observed an increase in ER protein levels during in vitro cultivation, with a maximum at 24 h in oocytes and 36 h in CCs. Our results did not indicate an increase in ERR protein expression after 96 h of IVC, which is, similar to PGRs, not associated with the log phase of CC proliferation. However, this difference may be partially explained by different cultivation times and the time-dependent expression of steroid hormone-receptor proteins, respectively. Only few data indicated the role of ER expression in the maturation and differentiation ability of COCs or of separated CCs. In one of the experiments performed by Kawashima et al. (Reference Kawashima, Okazaki, Noma, Nishibori, Yamashita and Shimada2008), the effect of LH, FSH, as well as time-dependent supplementation with P4 and E2 was investigated. These authors found that optimal COC expansion, and which is associated with oocyte maturation, is modulated by specific gene expression patterns in CCs. It is also related to the effectiveness of hormone stimulation, ligand binding and the activation of intracellular signal transduction pathways.
In the present study, the expression of PGR, PGRMC1, ERRγ and ERRβ/γ proteins was analyzed in relation to the proliferation ability of CCs, as determined by the proliferation index. Although it is recognized that cumulus expansion is one important factor that triggers the MII stage, no current data indicate whether porcine CC surrounded oocytes may proliferate in vitro. We found that their proliferation index increased substantially time-dependently during cultivation. However, the increased proliferation index was not associated with PGR, PGRMC1, ERRγ and ERRβ/γ protein expression; because the detected protein levels were lower after 96 h of IVC than before. Although the present study was the first one to analyze the real-time proliferation of CCs in vitro, this model can be valuable studying the cumulus expansion process in COCs during cultivation.
Acknowledgements
This study was made possible by grant number 2011/03/B/NZ4/02411 ‘OPUS’ from the Polish National Centre of Science.
Conflict of interest statement
The authors declare no conflict of interests.