


INTRODUCTION
Over the last 25 years there have been very large changes in the methods of cultivating soil for the potato crop. Systems that involve ploughing, bed-forming, bed-tilling and stone- and clod-separation prior to planting have changed the timing, depth and frequency of soil cultivations. Increased tractor power has allowed growers to cultivate in more marginal conditions and to greater depth but have increased the likelihood that the soil at the interface between worked and unworked soil will be above its plastic limit. As a consequence, it will respond to the shear force of any implement by compressing, becoming more dense and be described as compacted. This increase in bulk density is a potential impediment to root growth as reported by Boone et al. (Reference Boone, Bouma and De Smet1978) and Feddes et al. (Reference Feddes, De Graff, Bouma and Van Loon1988) but the frequency and significance of differences in soil bulk density in potato crops are far from clear. Reports of experiments using artificially compacted soils often show very large reductions in yield due to compaction (Timm & Flocker Reference Timm and Flocker1966; van Loon et al. Reference van Loon, de Smet and Boone1985) but effects of subsoiling (and other treatments aimed at removing or ameliorating compaction) frequently appear to be small. There has been limited study of the effect of soil resistance (Ω) on root growth in potatoes, but in other crops root growth has been shown to slow at Ωs known to occur in soils in which potatoes are grown (Gooderham Reference Gooderham1973; Loboski et al. Reference Loboski, Dowdy, Allmaras and Lamb1998). Thus, it seems clear that changes in soil bulk density can have large effects on crop growth and yield in potatoes but there is little understanding of the cause and extent of these effects. As a result, there is limited information to guide soil management and as the surface soil appears well-cultivated, many growers are unaware of changes in bulk density deeper in their soils caused by their cultivations.
The present paper reports the results of experiments and commercial field sampling over much of the potato production area in the UK that studied the relationship between root growth and soil Ω, the soil Ωs prevailing in soils growing potatoes, the causes of change in soil Ω and the effectiveness of cultivation treatments aimed at removing soil compaction.
MATERIALS AND METHODS
General methodology
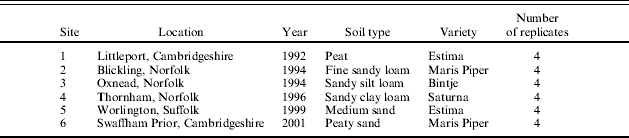
The results contain data collected from three main sources: fully replicated, randomized block design field experiments (Expts), replicate blocks in commercial crops (Sites) and areas of commercial fields where different cultivation treatments were carried out, usually unreplicated strips. Tables 1 and 2 give details of the Expts and Sites used in the study. All fields containing Expts and Sites were autumn-ploughed. Sites were bed-formed, stone-separated and planted over a short period of 1–3 days. Experimental fields at Cambridge University Farm (CUF) and Deben Farms were ridged up (Expts 1 and 5) or power harrowed flat (Expts 3 and 4) prior to hand planting. Experiments 1 and 3 were irrigated using overhead booms (RST Irrigation) attached to Perrot hosereels. In Expt 4, drip irrigation was applied with T-Tape (T-Systems) and in Expt 5 spray irrigation was applied using solid-set sprinkler irrigation (Wright Rain Portagrid).
List of experiments, location, year, soil type, variety and experimental treatments

List of commercial Sites, location, year, soil type, variety and number of replicates
Irrigation treatments were scheduled using the CUF irrigation scheduling model (M. A. Stalham, unpublished) based on a modified Penman–Monteith evapotranspiration (ET) equation using the grass reference crop ET0 calculations of Allen et al. (Reference Allen, Pereira, Raes and Smith1998). The model takes account of changing leaf area index, stomatal conductance and canopy surface roughness on the demand side and root growth and limiting soil moisture deficit (SMD) based on soil water tension and rooting depth on the supply side (Stalham & Allen Reference Stalham and Allen2004). The ‘limiting SMD’ was defined as the point when the ratio of actual to potential ET (adjusted for canopy cover and height) fell below 1·0 (Stalham & Allen Reference Stalham and Allen2004, Reference Stalham and Allen2005). Meteorological data were collected at CUF using an electronic logger (Delta-T Devices Ltd or Schlumberger) attached to an anemometer (Vector Instruments), thermistors measuring dry and wet bulb temperature (Grant Instruments), a screened relative humidity sensor (Skye Instruments Ltd) and a pyranometer measuring total incident global radiation (Kipp & Zonen BV). The Meteorological Office MORECS service was used to supply ET data for scheduling irrigation in experiments and commercial Sites outside CUF.
Experimental design and replication
Experimental treatments are detailed in Table 1. Experiments 1, 2 and 4 were fully randomized block designs with three replicates in Expts 1 and 4 and four in Expt 2. Experiment 3 consisted of four replicates in a randomized split-plot design with compaction×irrigation as main plots and varieties as sub-plots. Experiment 5 was a split-plot design with mulch covering as main plots and variety×physiological age as sub-plots with three replicates. There were four replicate areas at each commercial Site (Table 2). The assessment of different cultivation equipment in commercial fields was performed mostly on unreplicated adjacent strips.
Specific experiments
Experiment 2
In Expt 2, plants were grown in a series of 1·1 m long, 100 mm internal diameter, grey plastic irrigation pipes. Half of these ‘tubes’ were loosely packed with an oven-dried soil which had been sieved to remove peds larger than 4 mm, resulting in a bulk density of 1·22 t/m3, close to the value achieved under field conditions with clod-free soil at Cambridge. The compacted treatment was consolidated by applying a force of 500 N to an iron disc packer when packing successive 100 mm increments of soil. The 36 tubes comprising the compacted treatment had a mean bulk density of 1·39 t/m3 (s.e.=0·018 t/m3).
The tubes were filled to the rim with water and left to stand until this had drained into the soil. Further additions were made over a period of 3 days until water was observed draining out of the base of the tube. The tops of the tubes were then covered with sheet polythene to eliminate evaporation and left to drain and reach field capacity over the next 5 days. The tubes were then re-weighed to determine the quantity of water held at field capacity. Uncompacted tubes contained 27·3 m3/m3 water (volumetric basis) and 28·2 m3/m3 (s.e.=1·15 m3/m3) in the compacted treatment. Following packing and wetting, soil resistance was determined in four different positions in each of four replicate tubes using the penetrometer (see later description). These tubes were subsequently repacked as above since the path of the penetrometer may have left a channel through which roots could grow preferentially.
The tubes were planted with a single 25–30 mm Cara tuber and covered with fertilizer-enriched soil to a depth of 80 mm. Water was then applied to bring the top layer of soil up to field capacity. The tubes were spaced as in Table 3 and supported vertically in frames within 1 t potato boxes. Plants were exposed to natural light and rainfall conditions. Two irrigation regimes were imposed: a fully irrigated ‘wet’ treatment replacing the potential ET on a daily basis assuming complete crop cover and secondly a restricted ‘dry’ regime. Some irrigation was essential for growth in the ‘dry’ treatment given the paucity of rainfall throughout July and August. Therefore, from 42 days after emergence in the ‘dry’ treatment, irrigation was continued with the same frequency and amount as the fully irrigated treatment but no attempt was made to bring the soil back to field capacity.
Date of planting and seed spacing in experiments and commercial sites
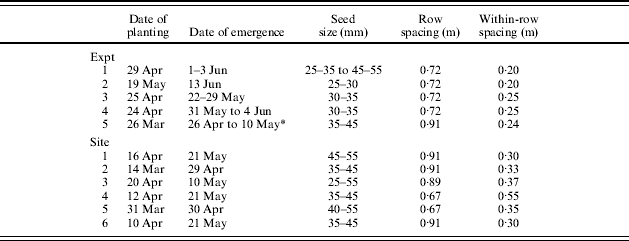
* Physiologically old seed emerged 14 days earlier than young seed.
Experiments 3 and 4
The soil was irrigated to field capacity 2 days prior to being compacted. In Expt 3, a 5 t tractor was driven over the soil so that all four wheels passed over the entire area of the plot four times. The compacted plots were power harrowed 2 days after compaction, to a depth of 50 mm, to allow shallow planting using hand dibbers. In Expt 4, compaction of the soil surface was carried out as in Expt 3. Compaction at depth was achieved by excavating the soil to 0·3 m depth using a JCB digger, driving on the dug-out plot as for surface compaction, then replacing the soil over the compacted layer. In view of the difficulties experienced in obtaining adequate depth of soil coverage when planting into a shallow seedbed in Expt 3, an additional 0·1 m of top soil was deposited on all plots which was then power harrowed to form a seed bed. The compaction depths were therefore 0·1 and 0·4 m from the soil surface. A dug-out control was included in order to separate the effects of soil disturbance from the effects of deep compaction but it had no significant effect compared with uncompacted soil; therefore the results are not presented.
Rooting depth determinations
At emergence, profile pits were excavated using a JCB digger or spade to a depth of 1·2–1·5 m spanning four rows (three rows at Sites 4 and 5). The width of the pit can be estimated from Table 3. The soil underneath each row was then excavated by hand using a spade to determine the maximum depth of rooting. On each occasion on which measurements were made, a fresh face of the root pit was prepared by excavating back two plants from each of the rows. Starting at emergence and continuing every 1–2 weeks, the depth of the ten longest roots in each pit was measured until maximum rooting depth was reached. The difference in mean maximum rooting depth between samplings was used to calculate root growth rates. Since the roots were not extracted from the face of the root pit, it was actually the rate of increase in rooting depth rather than the extension rate of individual roots that was being measured. It proved too time-consuming to remove roots to determine their length and many breakages occurred whilst attempting to do so. Whilst total root length is important with respect to the absorbing potential of the rooting system, the rate of downward progress of the rooting front ultimately determines the efficiency with which subsoil water is used by the crop.
Rooting density
In Expt 2, six destructive harvests were taken at emergence and 21, 42, 62, 85 and 111 days after emergence. Three days prior to harvest, irrigation was stopped to permit the soil to dry out and make extraction easier. Tubes were tapped with a mallet to loosen the soil/tube interface and the entire root/soil core extracted onto a bench. Loose soil was knocked off roots and the length of the longest root measured. The root network was divided into 0·2 m segments vertically and root length density estimated by washing the roots carefully to remove soils and debris and drying at 90°C for 48 h, then using the relationship between root length and root dry weight derived by Stalham & Allen (Reference Stalham and Allen2001).
Root core samples in Expts 3 and 4 were taken by driving a 60 mm window gouge auger (Eijkelkamp) down to a depth of 1·0 m using percussion hammer drill (Atlas Copco Cobra) then extracted using a ball clamp jack (Eijkelkamp). Two cores were taken from each plot, one from the ridge and one from the furrow. Samples were divided into 0·1 m (Expt 3) or 0·2 m (Expt 4) depths and placed in plastic bags and either frozen or kept below 4°C for subsequent analysis. Roots were separated from soil by washing over two fine mesh grids (1·0 and 0·2 mm) and Newman's (Reference Newman1966) grid intersection technique as modified by Marsh (Reference Marsh1971) and Tennant (Reference Tennant1975) used to estimate total root length per sample (Stalham & Allen Reference Stalham and Allen2001).
Soil resistance readings
The relationship between root growth rates and Ω was established using measurements of Ω taken using an Eijkelkamp Penetrograph penetrometer (60° cone tip with 100 or 200 mm2 basal area, 8 mm diameter shaft). Within replicated experiments, at least 20 readings of Ω were taken in each plot. In commercial fields containing Sites, four random locations were marked out after planting and c. 30–40 penetrometer readings taken to a depth of 0·8 m over an area of c. 4 m wide×10 m in length. Soil resistance was measured at field capacity in all soils because of the effect of water content on soil strength. Occasionally, the top 0·1 m was drier than field capacity, but this was above the planting depth of the seed tubers (typically 0·09–0·15 m) where root elongation was not measured. The readings of Ω were averaged for each location and the assumption made that Ω at each depth did not change during the season until the roots had penetrated that layer of soil. The high stone content in the soil of two of the compaction experiments (Expts 3 and 4) prevented the measurement of penetration Ω using the penetrometer.
Crop sampling
Most experiments only had a single final harvest. Harvest areas comprised 6–12 plants taken from guarded harvest rows and surrounded by at least one plant within the row. Tubers were dug by hand fork and graded into 10 mm increments. The proportion of ground cover was estimated using grids that comprised a multiple of the plant spacing and row width (Burstall & Harris Reference Burstall and Harris1983). Leaf appearance was followed in Expts 1, 3 and 4 by tagging two plants in each plot. Leaves were numbered acropetally and every fifth leaf tagged with coloured wire to aid the counting. The number of leaves greater than 5 mm was recorded. In Expts 3 and 4, the length of tagged leaves was also measured.
Survey of compaction in commercial fields
Over the period 1992–2004, a penetrometer was used in 602 commercial fields to measure soil Ω soon after planting on a range of soil types throughout the UK. The Ωs were classified by limits equivalent to root growth rates.
Statistics and analysis
Statistical analysis of experiments was carried out using the statistical package, Genstat 5, Release 6.1 (Payne et al. Reference Payne, Baird, Cherry, Gilmour, Harding, Kane, Lane, Murray, Soutar, Thompson, Todd, Tunnicliffe, Webster and Welham2002). The degrees of freedom (d.f.) are presented in the relevant Table or Figure. In all Figures, the error bars represent one standard error (s.e.). In the cultivation observations, most treatments were not replicated across fields, but at least 20 readings of Ω were taken in each cultivation regime. The s.e.s, therefore, show only the variation encountered within each treatment and do not permit statistical comparisons between treatments.
RESULTS
Relationship between rate of root penetration and soil resistance
The mechanical resistance to root penetration is most accurately represented by penetrometer measurements in soils with weak, massive or single-grain structures (Ehlers et al. Reference Ehlers, Köpke, Hesse and Böhm1983; Vepraskas & Miner Reference Vepraskas and Miner1986). For such soils, two stone-free sands and a peaty sand soil, there were close decreasing exponential relationships between root growth rates and penetrometer resistance (Fig. 1). A common regression also fitted the data closely and in such soils root growth rates decreased rapidly with an increase in Ω. The most rapid rates of root growth measured (c. 20 mm/day) were comparable to the maximal growth of other temperate crop species, e.g. winter wheat (Gregory et al. Reference Gregory, McGowan, Biscoe and Hunter1978). The relationship suggests that root growth rates would halve as Ω increased to 1 MPa. At a Ω of ⩾3 MPa growth rates would be very slow.
Root growth rate in relation to penetrometer resistance (Ω) in structureless soils. (a) Expt 5, y=22·17e−0·956x, R 2=0·85; (b) Site 1, y=21·87e−0·595x, R 2=0·83; (c) Site 5, y=20·76e−0·813x, R 2=0·85; (d) combined data from Expt 5 and Sites 1 and 5, y=21·82e−0·799x, R 2=0·79.

For well-structured soils, the relationships were less close and invariably negatively linear. Figure 2 presents the individual and combined results for two Expts and four Sites and shows considerable range in growth rates at any Ω. Maximal rates were again c. 20 mm/day close to the soil surface and often minimal at Ωs above 3 MPa. At this resistance, some roots were observed to have been able to penetrate further than others through burrows or voids between peds and were extending freely into deeper horizons particularly in subsoils where cultivation had not disturbed these channels. Such growth contributes to the broader range of rates found in these well-structured soils compared with structureless soils and contributes to variation in root length density with depth.
Root growth rate in relation to penetrometer resistance (Ω) in structured soils. (a) Expt 1, y=18·8−4·82x, R 2=0·69; (b) Expt 2, y=10·7−2·18x, R 2=0·47; (c) Site 2, y=16·0−3·67x, R 2=0·53; (d) Site 3, y=17·2−5·07x, R 2=0·64; (e) Site 4, y=14·9−3·84x, R 2=0·75; (f) Site 6, y=18·7−7·89x, R 2=0·70; (g) combined data from Expts 1 and 2 and Sites 2, 3, 4 and 6, y=16·3−4·08x, R 2=0·63.

The results in Figs 1 and 2 suggest that at some point between Ωs of 3 and 4 MPa, most roots cease to grow or are growing so slowly as to add little to root function. Figure 3 shows the significant negative linear relationship between root growth rate and Ω for all Ωs less than 3 MPa. This suggests that root growth rates reduce from c. 20 mm/day in intensively-cultivated surface horizons to 2 mm/day at a Ω of 3 MPa.
Root growth rate in relation to penetrometer resistance (Ω) for all soils in Expts 1, 2 and 5 and Sites 1–6. Data restricted to resistance readings ⩽3 MPa. Linear relationship: y=18·1−5·41x, R 2=0·62.

Effect of compaction on crop growth and yield
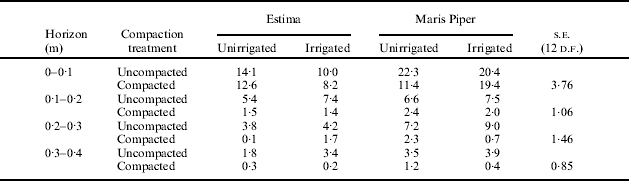
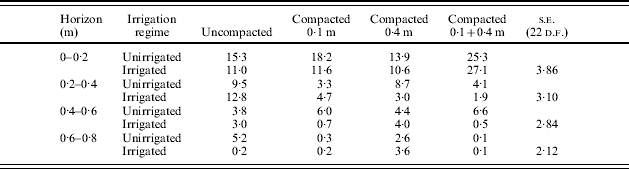
In Expt 4, compaction at 0·1 m delayed emergence slightly, reduced the length of the mainstem, reduced initial rate of leaf appearance, leaf length and rooting depth compared with uncompacted soil and deeper compaction at 0·4 m (Table 4). Shallow compaction reduced rooting density in all horizons in both Expts 3 and 4 (Tables 5 and 6). This effect was particularly severe in the horizons between 0·1 and 0·4 m in Estima in Expt 3. Irrigation increased rooting density in uncompacted soils but sometimes reduced it in compacted soils. Deeper compaction had no effect on maximum depth of rooting in Expt 4 but slightly reduced rooting density. Compaction reduced root length in all horizons in Expt 2, particularly below 0·4 m (Fig. 4).
Root length 85 days after emergence in Expt 2. Uncompacted (□); compacted (■). Irrigated treatments only. s.e. based on 9 d.f.

Effect of compaction depth on plant emergence, mainstem length, rate of leaf appearance, maximum size of leaf and maximum rooting depth in Expt 4. s.e. based on 22 d.f.

Effect of compaction and irrigation regime on root length density on 20 July (km/m3) in Expt 3
Effect of compaction depth and irrigation regime on root length density (km/m3) on 31 July in Expt 4
Compaction reduced early ground cover considerably in Expts 3 and 4 but only in Expt 3 did it restrict ground cover throughout the season (Figs 5 and 6). Irrigation had little effect on the reduction in both varieties. The effects of deep compaction in Expt 4 were much less severe than shallow compaction.
Effect of soil compaction depth and irrigation regime on proportional ground cover in Expt 3. (a) Estima; (b) Maris Piper. Uncompacted, unirrigated (■); uncompacted, irrigated (□); compacted, unirrigated (▲); compacted, irrigated (△). s.e. based on 12 d.f.

Effect of soil compaction depth and irrigation regime on proportional ground cover in Expt 4. Unirrigated, uncompacted (■); unirrigated, 0·10 m (□); unirrigated, 0·40 m (▲); unirrigated, 0·10+0·40 m (△); irrigated, uncompacted (●); irrigated, 0·10 m (○); irrigated, 0·40 m (
 ); irrigated, 0·10+0·40 m (
). s.e. based on 22 d.f.

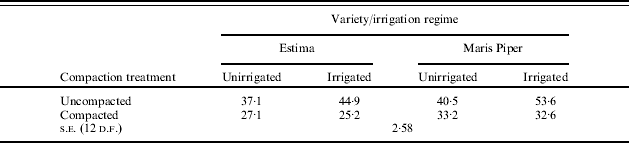
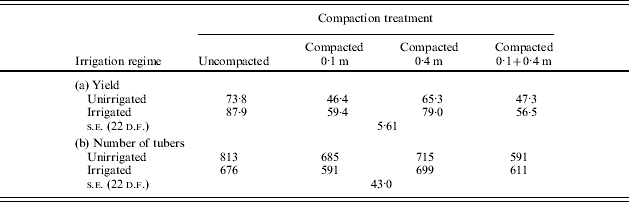
In both Expts 3 and 4 shallow compaction reduced number of tubers >10 mm, total and graded yields (Tables 7 and 8). The use of irrigation only increased yields in uncompacted soils in Expt 3, while in Expt 4 the effect of irrigation was much greater in uncompacted soils and those with deep compaction than where shallow compaction occurred.
Effect of soil compaction depth and irrigation regime on tuber total yield (t/ha) on 22 September in Expt 3
Effect of soil compaction depth and irrigation regime on (a) tuber total yield (t/ha) and (b) number of tubers (000/ha) on 1 October in Expt 4
Survey of compaction in commercial fields
The penetrometer survey of 602 commercial fields over the period 1992–2004 measured soil Ω soon after planting on a range of soil types throughout the UK. The Ωs were classified by limits equivalent to growth rates of less than a quarter of maximal rates (<5 mm/day), half to quarter (10–5 mm/day), three quarters to half (15–10 mm/day) and full to three quarters (20–15 mm/day, derived from Fig. 3). Table 9 summarizes the results for each year, showing the average depth at which each resistance limit was exceeded and the proportion of fields with Ωs ⩾3 MPa in the profile. On average, two thirds of fields had soil Ωs ⩾3 MPa in the potential zone for root growth and in some years, notably 1992, relatively close to the soil surface. The increase in Ω with depth began at relatively shallow depths and a halving of root growth rate would have occurred at 0·42 m, on average, but at only 0·28 m in 1992.
Survey of 602 commercial fields during 1992–2004 showing depths (mm) where soil resistance (Ω) exceeded the threshold for each root growth rate class and the proportion of fields with resistances ⩾3·0 MPa. Depths relative to top of planted ridge

These results suggest that for the majority of potato crops in the UK, rate (and ultimate depth) of rooting are restricted by soil conditions and many fields have Ωs at depths which are likely to prevent further root growth. Thus, rooting depth is likely to be much less than desirable, c. 1 m (Stalham & Allen Reference Stalham and Allen2001) and lead to inefficiencies in water and nutrient utilization.
The widespread occurrence of such serious compaction was somewhat surprising and in parallel with further sampling post-planting, the effects of all operations in the cultivation and planting of the potato crop on soil resistance were evaluated. The main findings are summarized in the order of working.
Previous cropping
The majority of the soils examined had Ωs ⩾3 MPa at c. 0·6 m, thus confirming the survey results, but prior to any cultivation the upper horizons were frequently variable. A major contributor to this was the previous crop, particularly its harvesting, and Fig. 7 illustrates the effect of sugar beet and wheat in two halves of a large field of uniform sandy clay loam soil. Sugar beet harvesting had materially increased Ω in the upper horizons but below c. 0·5 m both subsoils were initially hard enough to minimize root penetration. Below c. 0·7 m, Ω began to decline.
Effect of previous cropping on soil resistance (Ω) prior to spring cultivation on a sandy clay loam soil. Sugar beet (■); winter wheat (□).

Ploughing
This operation is carried out at various times from early autumn to spring and inevitably occurs at a wide range of soil water contents. If soils are at, or above, field capacity, smearing and compaction are to be expected. Figure 8 shows the effect of delaying ploughing over the winter period on a sandy loam soil. Ploughing in December in wet and non-drying conditions increased soil Ω at plough depth, 0·25–0·35 m, compared with earlier ploughing when the entire soil profile was dry (October) and where the top soil was dry (April).
Effect of time of ploughing on soil resistance (Ω) in a sandy loam soil. October (■); December (□); April (▲). Depths relative to ploughed surface.

Bed-forming
The creation of deep (0·40–0·60 m) beds as preparation for stone- and clod-separation has been a major change in cultivation techniques in the last 25 years. There is little flexibility in timing for this operation, which, with the exception of a few areas of heavy soil, is carried out in spring. The likelihood of the soil being wet (close to or above field capacity) is, therefore, very high, especially at the operational depth of the shares. Figure 9 shows the serious compaction at the base of the furrows, 0·30–0·45 m, created by bed-forming in wet conditions rather than earlier, drier conditions.
Soil resistance (Ω) in a clay soil in April 1994 following bed-forming at three different times. Bed-formed in late September 1993 (dry) (■); late October 1993 (wet) (□); April 1994 (wet) (▲). Depths relative to top of bed.

Bed-tilling
The cultivation of beds prior to stone separation is common practice and more than one pass is sometimes used. A number of tine designs are used in the powered rotary cultivators and Fig. 10 shows their effect on a clay loam soil. All tines increased soil Ω just below the planting depth and for L-shaped tines to a level at which root growth would be seriously slowed.
Soil resistance (Ω) following the use of three different types of bed-tiller working on a clay loam soil compared with zero bed-tilling. L-shaped blade (■); straight rod-type tines (□); ‘pick’ tines (▲); no bed-tilling, de-stoned only (△). Depths relative to top of planted ridge.

De-stoning
This operation is now almost universally used in preparing soil for potato planting and operates at a considerable depth (0·3–0·5 m) in the beds. It is, therefore, inevitable that the soil moisture content at the depth of working will be higher than at the soil surface. Consequently, there is a great risk of compacting the soil at the depth of the leading share, which will become closer to planting depth as a result of the operation. Figure 11 shows that de-stoning loosened the soil in the top 0·15 m of the finished ridge but increased Ω at 0·20 m compared with bed-tilling alone. Increasing the working depth of de-stoners can increase the depth of seedbed without creating compaction but ultimately a severe increase in soil Ω occurs (Fig. 12). In this case, seedbed depth was only increased by c. 0·10 m by working the separator 0·23 m deeper and a large increase in soil Ω was created at 0·30 m, which extended for a further 0·10 m. The deepest working depth created more clods, which were placed in the wheelings, leaving an uneven bed for planting.
Soil resistance (Ω) in bed-tilled beds pre- and post-de-stoning in a sandy loam. Beds (■); de-stoned beds (□). Depths relative to top of planted ridge.

Effect of de-stoning depth on soil resistance (Ω) in beds prior to planting. 0·20 m (■), 0·25 m (□), 0·31 m (▲), 0·43 m (△) below top of bed-tilled bed. Depths relative to top of de-stoned bed.

Soil water content and timing of operation
Figure 13 shows the effect of delaying a re-start to planting after rainfall on a fine sandy loam soil. An attempt to continue was made the next day and produced serious increases in soil Ω from 0·15 to 0·45 m which were completely avoided by waiting a further 3 days for the soil to dry.
Effect of delay in planting after rainfall on soil resistance (Ω) post planting in a sandy loam soil. 1-day delay (■); 4-day delay (□). Depths relative to top of ridge.

Practices aimed at removing compaction
Subsoiling is frequently practised in an attempt to disturb compacted layers and create lower and less changeable soil Ωs in the profile. It can be carried out in the previous crop prior to any specific operation for potatoes, conducted within the planting cultivations or it can be attempted post-planting if respecting the row arrangement of the plants. Figure 14 presents the results of subsoiling in autumn and spring on a clay loam soil which had a serious compacted layer at 0·5 m following cereals. In the autumn, when the soil was dry, subsoiling removed the compacted layer and reduced Ωs from ⩾3 MPa to <2 MPa across the width of the bed. In the spring, the same operation did not remove the compaction beneath the rows nor appreciably change Ω in the 0·4–0·5 m horizon as the soil at this depth was above its plastic limit when subsoiled. The Ωs in the upper horizons were reduced as the soil was drier at the time of subsoiling.
Profile soil resistance (MPa) in a clay loam following planting. (a) unsubsoiled; (b) subsoiled dry (September); (c) subsoiled wet (April). 0–1·5 (
); 1·5–2·0 (
); 2·0–2·5 (
); 2·5–3·0 (
); 3·0–3·5 (■). Depths relative to planted ridges.

Subsoiling carried out post-planting is aimed at removing compaction created during the cultivation and planting operation, often within wheelings, and has to be restricted to tines running along the furrows. Figure 15 shows the results of post-planting subsoiling in a sandy soil at 0·55 m using tines positioned in the centre furrow of a pair of ridges within a bed and another in the wheeling between beds. In the centre of the bed, subsoiling removed compaction below 0·45 m both above the depth of compaction and, importantly, some 0·20 m below the depth of the tine as a consequence of the ‘unloading’ of the soil deep in the profile. However, ‘unloading’ suggests that soils recover from high to low density due to relief in compaction below the depth of cultivation which can occur in sands to a limited degree. More probably, the apparent improvement is caused by a change in the datum reference point owing to a rise in the bed surface or some loss in friction on the penetrometer shaft. Underneath the wheeling, similar effects from 0·45 m down to 0·75 m were found and compaction was also reduced slightly above 0·45 m as a consequence of the movement of the subsoiler through the soil.
Effect of post-planting subsoiling in wheeled and centre furrows of beds on soil resistance (Ω) in a sand soil. Centre furrow, not subsoiled (■); centre furrow, subsoiled (□); wheeled furrow, not subsoiled (▲); wheeled furrow, subsoiled (△). Depths relative to top of planted ridge.

DISCUSSION
Unless roots are growing entirely within voids or continuous cracks in the soil, they must exert forces on soil particles to displace them. The mechanical resistance (Ω) to root growth is the reaction pressure of the soil and this will increase as the strength of the soil increases as it dries or its bulk density is increased by compaction. Direct measurement of the forces exerted by roots is difficult but accurate measurement of soil Ω can be obtained by use of a cone penetrometer. Such instruments do not act exactly as roots do and a number of reports show that resistance to them may be several times greater than the pressure exerted by root tips in penetrating soil (Eavis Reference Eavis1967; Stolzy & Barley Reference Stolzy and Barley1968; Whiteley et al. Reference Whiteley, Utomo and Dexter1981; Misra et al. Reference Misra, Dexter and Alston1986; Bengough & Mullins Reference Bengough and Mullins1988). However, roots, unlike penetrometer probes, are flexible and by exploiting planes of weakness can grow in soil horizons that have Ωs greater than the maximum axial pressures which they can exert. In addition, the progress of individual roots is frequently aided by the secretion of mucilage lubricants and the shedding of root cap cells (Bengough & McKenzie Reference Bengough and McKenzie1997). Soil Ω readings taken with a penetrometer must, therefore, be interpreted with caution but do allow study of the relationship between root penetration and soil Ω.
The results demonstrate the effects of increasing soil Ω on root growth, which have great significance for potato production as they will affect water and nutrient uptake and thereby yield. The relationships between rate of root growth and soil Ω on different soils were close and some of the reasons for variation have been considered already. There is one other major reason why no close unique relationship across soil types might exist between instantaneous root elongation rate and Ω. When roots grow through hard soil into looser soil, their elongation rates do not immediately increase to that of roots grown entirely in loose soil (Bengough & Young Reference Bengough and Young1993). Instead, the elongation rate remains slower for several days before eventually increasing. Boone et al. (Reference Boone, Bouma and De Smet1978) observed compensatory increases in root growth of potatoes once a plough pan had been crossed, although root growth had been slowed within the pan. There were only three soils in Figs 7–15 that had a high Ω horizon with lower Ωs above and below and in two of these soils the area of highest Ω was deep (0·65 m). Overall, the results show crops rooting freely near the soil surfaces at Ωs <1 MPa and reducing with depth until rates were low or zero at resistances ⩾3 MPa. This agrees with the limited published literature on potatoes (Bishop & Grimes Reference Bishop and Grimes1978; Boone et al. Reference Boone, Bouma and De Smet1978; Heap Reference Heap1993; Heap et al. Reference Heap, McPharlin and Stevens2001) and other crops (Vepraskas Reference Vepraskas1988; Loboski et al. Reference Loboski, Dowdy, Allmaras and Lamb1998).
The survey of commercial fields revealed a remarkably high frequency of serious soil Ωs (>2 MPa) at relatively shallow depths. A substantial majority of soils in all seasons had soil Ωs ⩾3 MPa (i.e. where most root growth would cease) within the expected rooting range of the crop. On these soils, crops would have shallower roots than desirable and therefore restricted access to water and nutrients. The effect of increasing soil Ω is most severe close to the seed tuber as this depth should have relatively rapid rates of root growth and within a fixed period of root growth (Stalham & Allen Reference Stalham and Allen2001) any loss of penetration cannot be subsequently recovered. In a small number of fields, only the top 0·12–0·16 m of the ridge had sufficiently loose soil to produce maximal growth rates (15–20 mm/day). In such fields, the rate of growth of roots would be restricted as soon as they were produced below the seed tuber by the resistance of the soil.
It might be expected that the seasons where shallow compaction was more evident would have had difficult planting periods with substantial rain events or more prolonged rainfall making the soils wetter than suitable for cultivation. However, it is difficult to generalize about the relationship between the incidence of compaction and rainfall at planting owing to variation in patterns of rainfall and planting date in the different production areas of the UK that were sampled. Whilst the British Potato Council estimates that on average three quarters of the UK's potato area is planted between 24 March and 11 May (R. Burrow, personal communication), the early areas of Cornwall and Pembrokeshire could be planting 2 months earlier, whereas the frost risk to crops planted in north Cambridgeshire or Lincolnshire combined with the high soil water-holding capacities means that crops are often planted well into May in many years. Late planting also often occurs in northern England and much of Scotland. Nevertheless, there were obvious differences in Ω between wet and dry planting seasons. For example, 1993, 1994 and 1998 were wet springs across much of the UK and compaction was observed in many fields at shallow depths, with typically only 0·12–0·16 m of loose soil being available for maximal root growth rates (Table 9). Additionally, these three seasons had a very high proportion of fields with Ωs ⩾3 MPa (Table 9) within the rooting zone. In contrast, generally dry springs across all surveyed areas such as 1995 and 1996 resulted in a much deeper (0·29–0·32 m) loose profile in the ridge or bed. In some dry springs, such as 1996, there were fewer fields with totally restrictive rooting depth (Ω>3 MPa), mainly as a consequence of a preceding dry autumn and winter period. However, in 1995 there were many fields observed to have restricted rooting profiles at depth as subsoils were much wetter in spring following a wet autumn which restricted subsoiling or the benefits from deep cultivation. In spring 2000, which was generally wet across all the regions surveyed, the substantial rainfall total for April occurred within short periods at the beginning, middle and end of the month, with 2 weeks of drying in between. This allowed cultivation to take place under optimum conditions, providing sufficient time was left after each rainfall event. Superficial drying meant that seedbeds were often compaction free to considerable depth (e.g. >0·3 m) but severe compaction (>3 MPa) was more widespread and occurred at shallower depths in 2000 than in any other season despite autumn and winter 1999 being substantially drier than average.
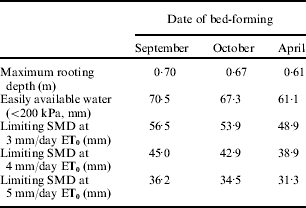
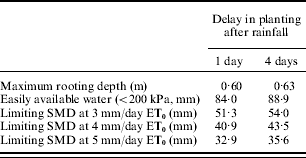
The significance of these effects for crop growth can be illustrated by their effects on water availability and thereby the need for irrigation. If the rate of growth of roots is reduced by increased soil Ω, the slower growth rate will reduce root zone depth whilst elongation continues but may not significantly decrease maximum rooting depth if the effect is temporary, i.e. a thin pan exists which slows growth but does not reduce root growth once the root tips have passed it. However, all temporary effects on root growth rates will reduce the amount of soil water available to the crop and thereby increase its likely need for irrigation as the limiting SMD will be reduced. The scale of the effect on crop growth will be determined by the evaporative demand placed on the crop (Stalham & Allen Reference Stalham and Allen2004, Reference Stalham and Allen2005). The potential effects on root penetration have been quantified using the growth rates in Fig. 2 g for the resistances shown in Figs 9 and 13. In the first example, bed-forming in September produced a 0·1 m increase in maximum rooting depth compared with the same operation carried out in April, resulting in a considerably increased limiting SMD (Table 10). In the second example, delaying planting also resulted in increased maximum depth of rooting and increased limiting SMD (Table 11).
Effect of date of bed-forming on maximum rooting depth and limiting SMD at differing daily ET0 rate. Data calculated from resistance measurements presented in Fig. 9
Effect of delaying planting following rainfall on maximum rooting depth and limiting SMD at differing daily ET0 rate. Data calculated from resistance measurements presented in Fig. 13
Once root penetration has ceased, differences in maximum rooting will affect irrigation need and efficiency of water used. If rooting depth is recorded, then shallower-rooted crops will simply require more frequent, smaller applications than deeper-rooted ones and in the first example would amount to one or two additional applications per annum. If rooting depth is not recorded in the scheduling process and the assumed depth is for uncompacted soil, then irrigation will be delayed beyond the effective limiting SMD and the crop will suffer a restriction in growth. Such effects on water availability and crop productivity will also occur during root penetration but within a short timeframe and are unlikely to be detected by observation or conventional systems. As the causes of these effects are the result of only small shifts in commercial practices, they represent a sample of the variation in soil conditions found in current potato crops. The examples chosen are by no means extreme: where Ωs increase significantly at shallower depths (<0·3 m) then the effective water supply is reduced by a third. It is, therefore, difficult to escape the conclusion that variation in soil conditions is a major contribution to lost yield potential in potato crops (Allen et al. Reference Allen, Allison, Sparkes, Sylvester-Bradley and Wiseman2005). This effect is, as yet, largely unrecognized by growers and being the consequence, in large part, of the almost universal adoption of a system of production, it will be relatively slow to change.
The use of powered cultivators in beds ultimately separated of stones and clods is now almost universally adopted in the UK but not in many other countries, notably the USA. The system is expensive of time and energy but produces fine soil aggregates to planting depth with serious risks of compaction deeper in the profile. As Stalham et al. (Reference Stalham, Allen and Herry2005) showed, all components of the system can cause serious compaction and the risks are exacerbated where cultivations are attempted in late February and March. These risks are the result of growers seeking to maximize the area covered by their machines and operating over as long a period as possible. They will only be removed if growers appreciate the significance of compaction and exercise greater patience in organizing their planting schedule. For some soils, a review of the justification for all operations in preparing soils is overdue. There is evidence that delaying planting of maincrop varieties from early March to mid-April does not jeopardize yield (Jones Reference Jones1981) unless the variety is very indeterminate, e.g. Maris Piper or Cara. Soil temperatures in March and early April are often too cold for sprout growth to occur except for short periods of the day, so early planting (e.g. 1 March) often leads to emergence taking 9–10 weeks rather than 4–5 weeks from mid-April plantings, effectively gaining little more than a week in emergence compared with planting 6 weeks later. Such early planting may lead to restricted leaf canopies especially in determinate varieties, e.g. Estima, Lady Rosetta. Consequently, such early planting may restrict yields. In recognition of these risks, there is a move by larger growers towards operating for 24 h per day, providing scope to delay planting until soil conditions become more favourable without undue delay in average planting date.
In Expt 4, emergence was delayed by shallow compaction where planting depth was the same for all treatments. In practice, the effect will be more serious as the uneven planting depth in compacted or cloddy seedbeds is always a contributory factor in lengthening the period of emergence. Compaction or capped ridges also cause stems to thicken or become fasciated (split), which can worsen into coiled sprout or little potato disorder, thereby delaying or even preventing emergence. These effects on emergence ultimately impact on many aspects of crop uniformity and quality, such as tuber size, shape and freedom from common scab and growth defects (e.g. Van Loon & Bouma Reference Van Loon and Bouma1978). Compaction also slowed the rate of leaf appearance and expansion leading to a later achievement of full ground cover or a reduced peak ground cover (or both) and advanced the onset or rate of senescence. As a consequence of these effects on leaf growth, tuber yields were reduced.
The effects of compaction on water use have implications for nutrient uptake, especially nitrogen, and thereby the extent and duration of canopy growth. Many growers respond to problems of compaction by top-dressing nitrogen and increasing the amount of irrigation applied. The results of Expts 3 and 4 at CUF show that irrigation cannot eliminate the effects of compaction and, as in Maris Piper in Expt 3, may actually increase their severity. In Expt 3, irrigation failed to increase the maximum ground cover attained in either variety grown in compacted soil and in Maris Piper irrigation severely reduced maximum ground cover and delayed its attainment. This may have been a consequence of waterlogging when large doses of irrigation were applied to soil with impeded drainage. By contrast, in Expt 4, small regular doses of irrigation increased the rate of increase in ground cover in crops growing in shallow-compacted soil but did not eliminate the detrimental effects of compaction completely. In both experiments it would appear that nitrogen uptake was reduced by compaction. The overall effects of the reduced size and longevity of the leaf canopy significantly decreased the yield of crops grown in compacted soil owing to a reduction in absorbed radiation. Van Loon & Bouma (Reference Van Loon and Bouma1978) and Young et al. (Reference Young, Bengough, Mackenzie and Dickson1993) also suggested that yield decreases due to compaction were attributable principally to a reduction in leaf area and light absorption.
In view of the clear effects of compaction on growth and yield, it is surprising that the results of experiments on subsoiling are so variable (Stalham et al. Reference Stalham, Allen and Herry2005). In their thorough review of results relating to potatoes, they found only 28 experiments out of 83 showed a significant yield increase as a consequence of subsoiling or reducing traffic, with three experiments showing a significantly reduced yield. In the situations where there was a significant increase in yield from subsoiling (>0·3 m depth as opposed to shallow-tillage or zero traffic experiments), the benefits were small, averaging 5 t/ha, and achieved from pre-planting subsoiling rather than post-planting. Compared with the large significant effects of compaction on yield, these differences are small. In the experiments in which cultivation was carried out below 0·3 m (i.e. subsoil depth), most authors did not establish that compaction was present prior to cultivation and the reader is left to assume that it was. Many reports fail to detail tractor tyre pressures and wheel loadings, the combined effect of which influences the degree and depth of compaction. Only a third of authors (Ross Reference Ross1986; Marks & Soane Reference Marks and Soane1987; Ibrahim & Miller Reference Ibrahim and Miller1989; O'Sullivan Reference O'Sullivan1992; Pierce & Burpee Reference Pierce and Burpee1995) stated that compaction was present prior to subsoiling treatments and most supported these statements by presenting data relating to soil Ω or bulk density. Researchers who stated that they had a compaction problem usually observed a decrease in soil Ω following subsoiling and three quarters of those authors found a yield increase in response to subsoiling. As information on soil conditions during subsoiling, subsequent weather (especially rainfall) and the details of tine depth in relation to soil conditions are frequently lacking, it is less surprising that the effects of subsoiling appear to be small. Unless subsoiling breaks a compacted layer, there is no intrinsic merit in the operation and growers and researchers need to be more effective in relating their cultivations to soil conditions. As Fig. 14 shows, subsoiling in dry conditions is an effective way of reducing soil Ω and leads to improvements in yield and quality.
There is an urgent need for a better understanding of the relationship between root function (i.e. growth and uptake ability) and soil conditions so that more accurate advice can be given to growers to optimize their cultivations. This will reduce over-cultivation with its attendant problems, such as slumping of the ridge, as well as compaction. Since there is a relatively defined sequence in most current UK potato planting operations, there is, unfortunately, considerable opportunity for ‘recreational’ cultivation, i.e. for a machine to be used purely because it is in the field along with its operator. All cultivations need to be given more consideration by growers in order to improve the energy and labour efficiency of planting.
The authors thank the growers who supplied fields for experiments and access to their commercial crops (Ouse Bridge Farms Ltd, Upton Farms Ltd, Deben Farms Ltd, B & C Potatoes, Crane & Sons, C A Strawson Farming and Lord's Ground Partnership). Sponsorship for experiments was provided by Cambridge University Potato Growers Research Association, Potato Marketing Board and the Perry Foundation.



