I. INTRODUCTION
Electromigration in flip-chip solder joints has become inevitable in recent years because of the miniaturization trend to meet the demand for higher performance in portable electronics.Reference Chen, Tong and Tu1 Many efforts have been made to investigate this emerging issue.Reference Chen, Huang and Zhou2–Reference Lin, Hu, Tsai, Kao and Tu10 Serious crowing effect in the chip end plays a crucial role in the failure mechanism during electromigration,Reference Chao, Chae, Zhang, Lu, Im and Ho5, Reference Shao, Liang, Lin and Chen11 causing void formation in solder joints with thin-film under bump metallizations (UBMs) or dissolution of UBMs in solder joints with thick-film UBMs at high current-density regions.Reference Lin, Hu, Tsai, Kao and Tu10, Reference Alama, Wua, Chan and Tu12, Reference Nah, Paik and Suh13
Moreover, it is interesting that thermomigration (TM) also occurs during the accelerated electromigration test for flip-chip Pb-containing solder joints.Reference Ye, Basaran and Hopkins6, Reference Huang, Gusak, Tu and Lai7, Reference Hsiao and Chen14 Typically, the applied current ranges from 0.4 to 2.0 A and thus serious Joule heating takes place during the electromigration test. The resistance of the wiring trace on the Si side is much longer than that on the substrate side. Non-symmetrical Joule heating builds up a temperature gradient across the solder joints. For Pb-containing solder, Pb atoms move to the cold end on the substrate side. On the other hand, Sn atoms migrate to the hot end on the Si side. At tested temperatures higher than 100 °C, Pb atoms appear to be the dominant diffusion species, causing void formation on the chip end. Because of environmental concerns, the microelectronic industry replaces the eutectic SnPb solder with Pb-free solders. However, only few studies address the thermomigration issue in Pb-free solders.Reference Chen, Chen and Tu15, Reference Hsiao and Chen16 In particular, the thermomigration of Cu and Ni UBMs are not clear.
In this study, we examine the thermomigration and electromigration behaviors in eutectic SnAg solder joints with Cu and Ni UBMs. It is found that thermomigration of Cu dominates the failure mechanism at high stressing currents, instead of electromigration damage of solder alloys. Copper atoms, or Cu6Sn5 intermetallic compounds (IMCs), migrate to the cold end and serve as the dominant diffusion species during electromigration, and voids form in the original location of Cu UBM. On the other hand, the thermomigration of Ni appears much slower than that of Cu. Theoretical calculations were carried out, which agreed with the observed phenomena.
II. EXPERIMENTAL
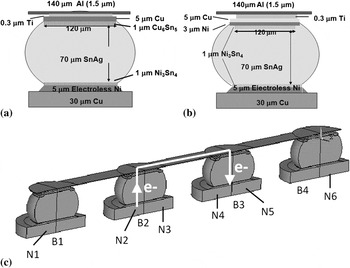
The dimensions of the flip-chip joints used in this study are shown schematically in Figs. 1(a) and 1(b). The bump has a dimension of 130 μm in width and 75–80 μm in height, with an UBM opening of 100 and 110 μm in diameter for Cu UBM and Cu/Ni UBM, respectively. A 0.3-μm Ti layer was sputtered as an adhesion/diffusion barrier layer between the UBM and the Al trace. The solder joints consist of eutectic SnAg solder bumps with electroplated 5-μm Cu UBMs or with electroplated 5-μm Cu/electroplated 3-μm Ni UBMs, as shown in Figs. 1(a) and 1(b), respectively. The electromigration test layout consisted of four bumps. An Al trace of 2550 μm long, 100 μm wide, and 1.5 μm thick connected the four bumps together. The four bumps were denoted as “Bump 1” through “Bump 4,” as shown in Fig. 1(c). Six Cu nodes were fabricated on a FR5 substrate, and they are labeled as Nodes “N1” through “N6.” The dimension of the Cu lines on the substrates was 30 μm thick and 100 μm wide.
Schematic diagrams of (a) a SnAg solder joint with a 5-μm Cu under bump metallization (UBM), (b) a SnAg solder joint with a 5-μm Cu/3-μm Ni UBM, and (c) cross-sectional view of the test layout. The electron flows are indicated by the arrows.

To facilitate the observation of electromigration and thermomigration behaviors, the joints were polished laterally to approximate their centers. After polishing, the widths of the Al traces and the Cu lines also decreased accordingly. Desired electric currents were applied through Nodes N3 and N4. Therefore, Bumps 1 and 4 did not yet carry current. However, they have almost the same Joule heating as Bumps 2 and 3 because the Al trace and the Si die possess excellent ability for heat conduction. The applied current was 0.55 A at 150 °C on a hot plate, which corresponds to an average current density of 9.7 × 10³ A/cm2 in the UBM opening. The temperature distribution in the solder bumps during the current stressing was measured by a QFI infrared (IR) microscope, which has a temperature resolution of 0.1 °C and a spatial resolution of 2 μm. The IR measurement was performed before the electromigration test. During the temperature measurement, the flip-chip package was stressed by 0.55 A on a hot stage maintained at 100 °C, and the polished bump surface was placed facing the IR microscope. The temperature measurement was then performed to record the temperature distribution (map) after reaching a steady state. Because the hot stage for the IR microscope can be heated only up to 110 °C, the temperature measurement was performed at 100 °C. Kelvin probes were used to monitor the resistance changes for both Bumps 2 and 3.Reference Hsiao, Liang, Ku, Chen and Yao17 Thus, the electromigration damage can be monitored in situ, and the current can be terminated as soon as the resistance increases to the desired value. The changes in surface microstructure were examined by using a scanning electron microscope (SEM), using either secondary image mode or backscattered electron image (BEI) mode. Next, to identify the Cu thermomigration phenomenon, focused ion beam (FIB) was used to etch a surface at the interface between the Si side and the solder to analyze the interfacial damage caused by thermomigration.
III. RESULTS AND DISCUSSION
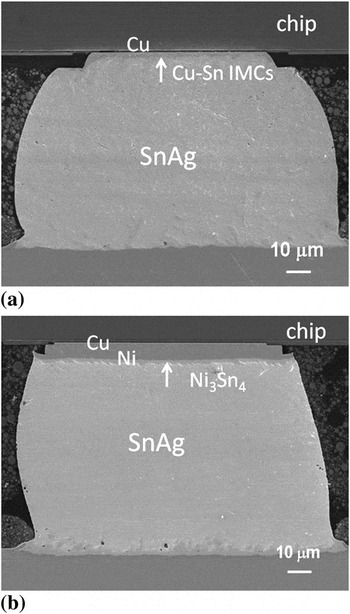
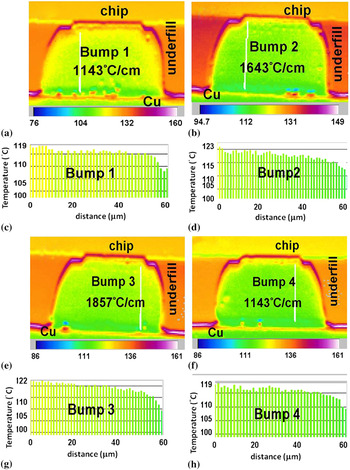
Before current stressing, the IMCs on the chip side attach to UBMs very well. Figures 2(a) and 2(b) show the cross-sectional SEM images for the microstructures and the SnAg/Cu and SnAg/CuNi bumps, respectively, before current stressing. Interfacial IMCs are labeled by arrows in the figures. Cu–Sn IMCs form in the SnAg solder bump with a Cu UBM on the chip side, and there are about 3.18 μm Cu UBMs left for the as-fabricated bumps. On the other hand, Ni3Sn4 IMCs form in the solder/chip interface in the SnAg solder bump with a Ni UBM. The electromigration damage generally occurs on the chip side due to serious current crowding.Reference Nah, Kim, Lee and Paik9, Reference Shao, Liang, Lin and Chen11 Although there were no currents passing through Bumps 1 and 4, the temperature measurement by the IR microscope indicates that they have almost the same Joule heating effect as Bumps 2 and 3. Therefore, they are quite suitable to serve as control samples to inspect thermomigration simultaneously during the accelerated electromigration test. Figures 3(a), 3(b), 3(e), and 3(f) show the temperature distributions for the four bumps with Cu UBMs stressed at 0.55 A through Nodes 3 and 4 at 100 °C. The average temperature was 116.0 °C for Bump 1, 118.5 °C for Bump 2, 118.0 °C for Bump 3, and 115.8 °C for Bump 4. The mean value was obtained by averaging the temperatures in an area of 50 × 50 μm2 around the center of the bump. Figures 3(c), 3(d), 3(g), and 3(h) present the temperature profile along the white line in Figs. 3(a), 3 (b), 3(e), and 3(f), respectively. Since the Al trace serves as the major heating source,Reference Chiu, Shao, Chen, Yao and Hsu8, Reference Nah, Kim, Lee and Paik9 the temperature in the solder close to the chip end was higher than those close to the substrate end. Therefore, a huge thermal gradient was built up across the solder bump during the stressing by high current density. The thermal gradient is defined here as the temperature difference between the two ends of the white line divided by the length of the line, which was 70 μm. The measured thermal gradient reached 1143 °C/cm for Bump 1, 1643 °C/cm for Bump 2, 1857 °C/cm for Bump 3, and 1143 °C/cm for Bump 4.
Back-scattered scanning electron microscope (SEM) images for solder bumps before current stressing. (a) SnAg bump with a Cu UBM. (b) SnAg bump with a Cu/Ni UBM.

Temperature distributions in the four bumps with Cu UBMs. (a) Bump 1, no current; (b) Bump 2, with upward electron flow of 0.55 A; (c) temperature profile along the white line in (a); (d) temperature profile along the white line in (b); (e) Bump 3, with downward electron flow of 0.55 A; (f) Bump 4, no current; (g) temperature profile along the white line in (e); and (h) temperature profile along the white line in (f). The temperature gradients are labeled on the bumps.

It is noteworthy that the real temperature increases and thermal gradients during thermomigration tests may be higher than the values in Figs. 3(a)–3(f). Because of the heating capability of the IR hot stage, the hot stage can be maintained up to 100 °C. However, the thermomigration tests were carried out at 150 °C. Because both the wiring traces and the solders are metals and their resistivity increases with the increase in temperature, the Joule heating effect will be more pronounced at 150 °C. In addition, Hsiao et al. reported that the temperature gradient increases with the applied current and the heating power (I 2R).Reference Hsiao, Liang, Ku, Chen and Yao17 Therefore, it is expected that the thermal gradient will be higher at 150 °C than that at 100 °C.
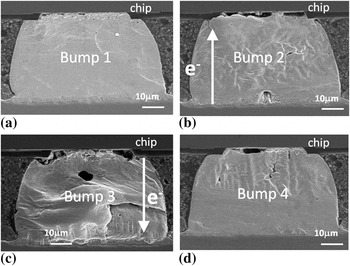
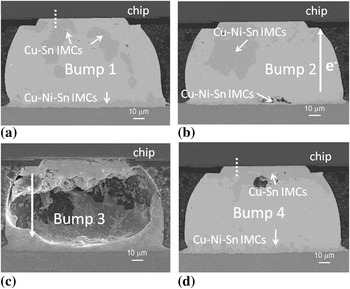
The huge thermal gradients trigger thermomigration in the joints. We found that voids formed in the chip end for all the four bumps after the current was applied through Bumps 2 and 3 for 76 h, as shown in Figs. 4(a)–4(d). The current was terminated when the resistance of Bump 3 reached 4.0 times its original value. Voids formed in the cathode/chip end for Bump 3 because both electromigration and thermomigration forces move the Cu atoms to the substrate side in this bump, as depicted in Fig. 4(c). Therefore, the largest voids formed in Bump 3. Nevertheless, it was observed that serious damage also occurred in the anode/chip end of Bump 2 with the formation of large voids. Its resistance also increased to 2.0 times its original value. It is reported that Sn atoms migrate to the hot end, which is the chip side in this test structure.Reference Huang, Gusak, Tu and Lai7 The voids accumulate in the interface of the solder and the Si chip. For the Pb-free solder in this study, it is also expected that Sn atoms would migrate to the hot end on the Si side because Sn has a positive heat transport number.Reference Hsiao and Chen16, Reference Huntington19 In addition, the electromigration force also pushes the Sn atoms to the anode on the Si side. Thus, the voids in the chip side for Bump 2 are not accredited to electromigration or the thermomigration of the solder.
Cross-sectional SEM images showing the microstructures of the four bumps after the current stressing of 0.55 A through N3 and N4 at 150 °C for 76 h. (a) Bump 1, (b) Bump 2 with a resistance increase of 200%, (c) Bump 3 with a resistance increase of 300%, and (d) Bump 4. Voids formed in the chip side in all the four bumps.

Instead, it is proposed that thermomigration of Cu6Sn5 IMCs dominates the failure mechanism in this stressing condition. The SEM images for Bumps 1 and 4 also support this assumption, as illustrated in Figs. 4(a) and 4(d). Only thermomigration takes place in these two bumps because there was no current passing through these two bumps. Yet, the thermal gradients were slightly smaller than those in Bumps 2 and 3. Thus, less damage and smaller voids occurred in these bumps. Furthermore, it has been found that the voids replaced the positions of Cu6Sn5 IMCs and Cu UBM. Therefore, Cu or Cu6Sn5 migrated to the substrate side under the huge thermal gradients in the four bumps.
The electromigration force also pushes the Cu and Sn atoms to the chip end for Bump 2. Hillocks might be formed in the chip end if only electromigration force is considered. However, voids formed in the anode/chip end, instead of hillocks, as shown in Fig. 4(b). Therefore, it is inferred that the thermomigration force overwhelms the electromigration force in the present stressing condition. To verify this point, theoretical calculations are performed. The electromigration force is represented asReference Huntington and Grone20

where Z* is the effective charge number of ions, ρ is the resistivity, j is the electric current density, e is the charge of an electron, and E is the electrical field. We assume that Cu atoms are the diffusion species for the migration of the Cu–Sn IMCs. The effective charge number is taken as 6.4 for Cu,Reference Lee, Hu and Tu21 resistivity as 1.67 × 10⁻⁸ Ω·m, and the current density as 9.7 × 10⁷ A/m2. Thus, the electromigration force is 1.66 × 10⁻¹⁸ N. The work done by the force in an atomic jump distance of 3 × 10⁻¹⁰ m is 4.98 × 10⁻²⁸ J. On the other hand, the thermomigration flux is given byReference Shewmon22, Reference Ragone23
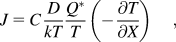
where Q* is the molar heat of transport, C is the concentration, D is the diffusivity, and kT is the thermal energy. The driving force of thermomigration is given by
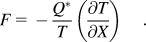
With a temperature difference across an atomic jump ΔT/Δx, the thermal energy change would be 3kΔT. When the thermomigration force balances with the electromigration force, we have

which yields ΔT = 1.2 × 10⁻⁵ k across an atomic jump. Therefore, the critical thermal gradient goes to 400 °C/cm. In other words, when the thermal gradient is greater than 400 °C/cm, thermomigration force on Cu atoms would be bigger than the electromigration force. Voids would form in the chip/anode end in Bump 2. Otherwise, voids would not be present in the chip/anode end for Bump 2. Instead, hillocks would form there. The results on the thermal gradient also agree with this calculation. As shown in Fig. 3, the thermal gradient in Bump 2 reached 1643 °C/cm, which is greater than the calculated critical gradient. Therefore, Cu atoms migrated toward the substrate side, which was against the direction of electrical current in Bump 2.
It is noteworthy that the critical thermal gradient varies with stressing current density and temperature. If the applied current decreases from 0.55 A to 0.4 A, the critical thermal gradient would also decrease to 290 °C/cm, given the temperature remains the same.
The results are quite reproducible, and other results also support that the Cu thermomigration dominates the failure mechanism in this stressing condition. The BEI images in Fig. 5 show the microstructures of the four solder bumps after stressing at 0.55 A at 150 °C for 82 h. Serious damages occur in Bump 3, as illustrated in Fig. 5(c). Although there are no obvious voids formed in the rest of the three bumps, spalling of the Cu–Sn IMCs are clearly observed. In Bump 1 in Fig. 5(a), where no currents passed through, the Cu UBMs were consumed completely, and the IMCs detached from the original interface in the chip side. They seem to be in the process of migrating to the substrate side under a huge thermal gradient. For Bump 4 in Fig. 5(d), Cu–Sn IMCs in the chip side also started to migrate to the substrate end due to thermomigration. In Bump 2, although the electromigration force pushes the Cu atoms upward to the chip end, spalling of Cu–Sn IMCs still took place at the right-hand side of the upper interface. This finding also implies that the thermomigration force is greater than the electromigration force acting on the Cu atoms.
Cross-sectional backscattered electron images showing the microstructures of another set of bumps after the current stressing at 0.55 A through N3 and N4 at 150 °C for 82 h. (a) Bump 1, (b) Bump 2 with a resistance increase of 100%, (c) Bump 3 with a resistance increase of 350%, and (d) Bump 4. Consumption of Cu UBM and spalling of Cu–Sn IMCs were observed in Bumps 1, 2, and 4.

The Ni metallization on the substrate side may affect the IMC composition on the chip side during thermomigration tests. For the as-fabricated sample in Fig. 2(a), no Ni atoms could be detected on the chip side using the EDS in SEM. Yet, in Bump 2 with upward electron flow, the Ni atoms in the substrate metallization were migrated to the chip side by electron wind force after the current stressing. Therefore, the IMCs on the chip side were transformed into ternary Cu–Ni–Sn IMCs, as labeled in Fig. 5(b). The Ni concentration was measured to be 14.9 at%. In Bumps 1 and 4 after the current stressing, no Ni atoms were detected in the Cu–Sn IMCs on the chip side. This may be because the the Cu atoms on the chip side migrated to the substrate side owing to the built-in thermal gradient. The Cu atoms transformed the Ni–Sn IMCs on the substrate side into Cu–Ni–Sn IMCs. Because the diffusion of Cu in the SnAg solder is faster than that of Ni, the Ni atoms stayed on the substrate side and were not able to diffuse to the chip side for bumps 1 and 4, as labeled in Figs. 5(a) and 5(d).
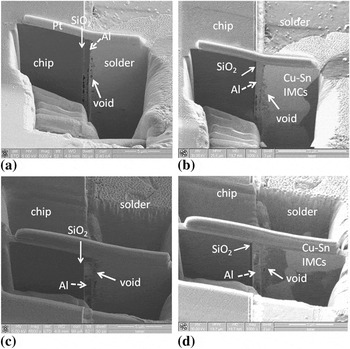
FIB was used to further examine whether there are voids in the interface of the solder and the Si chip for the samples in Fig. 5. Figure 6(a) depicts SEM images for the interface of the bump in Fig. 5(a), in which the Cu–Sn IMCs started to move to the substrate by thermomigration. The etched position is illustrated by the dotted line in Fig. 5(a). It is found that numerous tiny voids formed at the interface. An FIB ion image was adopted to examine the interface, so that the solder and the IMCs could be distinguished, as shown in Fig. 6(b). It is observed that the voids were located between the SiO2 and the Cu–Sn IMCs. Some of them occurred in the Al trace. It is speculated that the IMCs are in the process of migrating thermally toward the substrate (cold) side; thus, voids start to nucleate in the interface. The interface microstructure in Bump 4 in Fig. 5(d) was also inspected by FIB, and the etching location is labeled by the dotted line in Fig. 5(d). The SEM image in Fig. 6(c) also reveals void formation at the interface. Its ion image is shown in Fig. 6(d). Some of the IMCs in the interface spalled into solder, causing void formation at the original location of the IMCs. The FIB resulting from both bumps indicated that thermomigration of Cu took place and voids started to nucleate at the original location of the Cu UBMs.
Microstructures at the interface of the chip and the solder after the current stressing of 0.55 A through Bumps 2 and 3 at 150 °C for 82 h. (a) SEM image for Bump 1, (b) ion image for Bump 1, (c) SEM image for Bump 4, and (d) ion image for Bump 4.

In addition to electromigration and thermomigration forces, chemical potential may also play a role in Cu migration. The Cu on the chip end may migrate to the substrate end to form ternary Cu–Ni–Sn IMCs, which have a lower free energy.Reference Kima, Kim, Ha, Noh, Koo, Park, Ko and Jung24 To examine whether chemical potential is able to influence the Cu diffusion in the present case, another set of solder joints was annealed at 165 °C on a hot plate for 90 h. This process takes Joule heating into consideration, and the annealing time is longer than the stressing time for the samples with a Cu UBM. Only chemical potential force exists during the annealing. It is found that the Cu6Sn5 IMCs grew thicker from 1.72 to 4.31 μm, but they did not detach nor migrate to the substrate side, as shown in Fig. 7. These results suggest that the force of chemical potential is negligible compared with the forces of electromigration and thermomigration in the present case.
Enlarged cross-sectional SEM images of the chip–solder interface for (a) the bump before aging and (b) the same bump after aging at 165 °C for 90 h. The Cu–Sn IMCs grew thicker, but no migration of Cu–Sn IMCs was observed.

It is noteworthy that thermomigration of Sn also takes place in all the four bumps. Hsiao et al. reported that the Sn atoms migrated toward the hot end in the SnAg solder joints under a large thermal gradient. The heat of transport is measured to be 1.36 kJ/mol for Sn. In the present study, the Cu atoms diffuse to the cold end in solder joints, which is inconsistent with the results for thermomigration on pure Cu.Reference Meechan and Lehman25 The results in Bumps 1 and 4 indicate that the voids appear in the chip side, which is the hot end. This finding implies that the thermomigration flux for Cu overwhelms that of Sn.
It is speculated that the high Cu solubility in Pb-free solder facilitates the occurrence of the serious thermomigration of Cu–Sn IMCs. Zeng and Tu reported that the solubility of Cu is 0.18 wt% in eutectic SnPb solder at 220 °C. However, it increases to 1.54 wt% in Pb-free solders at 260 °C.Reference Zeng and Tu26 Therefore, it is difficult to observe Cu thermomigration in the SnPb solder during the electromigration test of solder joints. Electromigration or thermomigration of Sn and Pb prevails in the SnPb solder joints. Yet, for Pb-free solders, thermomigration of Cu becomes obvious because of the high solubility of Cu. In some stressing conditions, the thermomigration flux of Cu may be greater than the electromigration or thermomigration flux of Sn. Therefore, we can observe the unique failure mode in Figs. 4 and 5.
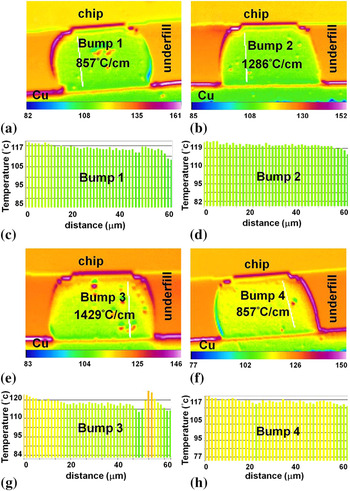
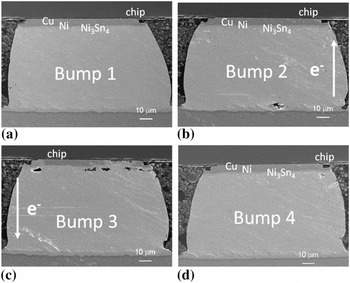
It is of interest that whether thermomigration of Ni would happen in a Pb-free solder joint because Ni is another important UBM material in the microelectronics packaging industry. It is reported that Ni atoms also migrate toward the cold end.Reference Cahn and Haasen27 Similar electromigration tests were performed in eutectic SnAg solder joints with an additional 3-μm Ni UBM on the 5-μm Cu UBM. The dimensions of the joints are similar to the ones with 5-μm Cu UBMs. Figures 8(a)–8(d) present the temperature distributions in Bumps 1 through 4, respectively. When they were stressed by 0.55 A at 100 °C, the measured thermal gradient was 857, 1286, 1429, and 857 °C/cm. The thermal gradients are slightly smaller than those in the bumps with a 5-μm Cu UBM. This phenomenon may be attributed to the 3-μm Ni relieving the local current crowding effect in solder.Reference Hsiao, Liang, Ku, Chen and Yao17 This 3-μm Ni UBM also lets the solder stay away from the Al trace, which serves as the major heating source. In addition, the electrical and thermal conductivities of the UBM materials also have effect on the temperature distribution.Reference Liang, Chang and Chen28 Thus, the thermal gradients in the Cu/Ni joints are smaller than those in joints with a 5-μm Cu UBM. After current stressing at 0.55 A at 150 °C for 180 h, the microstructures for the four bumps were observed and shown in Figs. 9(a)–9(d). Voids formed only in Bump 3, which had a downward electron flow. These voids are caused by electromigration and they formed in the interface of the solder and the Ni3Sn4 IMCs. The resistance of this bump increased to 1.5 times of its initial value. It is interesting that there were no damages or voids observed in Bumps 1, 2, and 4, except that the thickness of Ni–Sn IMCs increased from 0.9 μm to 1.7 μm. Thus, no thermomigration of Cu and Ni was found in the joints with Ni UBMs. The results also suggested that the Ni UBMs serve as an excellent diffusion barrier for Cu thermomigration.
Temperature distributions in the four bumps with Cu/Ni UBMs stressed at 0.55 A through N3 and N4 at 100 °C. (a) Bump 1: no current and a temperature gradient of 857 °C/cm; (b) Bump 2: with upward electron flow of 0.55 A and a temperature gradient of 1286 °C/cm; (c) Bump 3: with a downward current flow of 0.55 A and a temperature gradient of 1429 C/cm; and (d) Bump 4: no current and a temperature gradient of 857 C/cm.

Cross-sectional SEM images of the solder joints with Cu/Ni UBMs after the current stressing at 0.55 A through N2 and N3 at 150 °C for 180 h. (a) Bump 1, no current; (b) Bump 2, with an upward electron flow; (c) Bump 3, with a downward electron flow; (d) Bump 4, no current. Only electromigration damages were observed in the chip side of Bump 3.

Theoretic calculation also supports that Ni–Sn compounds do not migrate under the above thermal gradients. If we take the effective charge number of Ni to be 67,Reference Yeh and Huntington29 resistivity as 6.4 × 10⁻⁸ Ω·m, and the current density as 9.7 × 10⁷ A/m2, the electromigration force is estimated to be 6.7 × 10⁻¹⁷ N using Eq. (1). The work done by the force in an atomic jump distance of 3 × 10⁻¹⁰ m is 2.01 × 10⁻²⁶ J. When the thermomigration force is balanced with electromigration force, a temperature difference of ΔT = 2.415 × 10⁻⁴ k is needed across an atomic jump, which is equivalent to 8050 °C/cm. That is, it needs a thermal gradient over 8050 °C/cm to observe thermal migration of Ni atoms during electromigration. The thermal gradients in the four bumps are much smaller than this value in this study. Therefore, migration of Ni–Sn compounds was not observed in the SnAg solder joints.
On the basis of the above results, the following model is proposed to explain the interesting observation. Figures 10(a)–10(c) illustrate the atomic migration in the four bumps. The atomic flux due to chemical potential is not considered in this model. Figure 10(a) depicts the atomic migration in Bumps 1 and 4. Only thermomigration occurs in these two bumps because they were not subjected to current stressing. Copper atoms move to the cold end (substrate), whereas Sn atoms diffuse to the hot end (Si side). The flux of the Cu thermomigration is much larger than that of Sn, as illustrated by the length of the arrows in the figures. For Bump 2 with an upward electron flow, the thermomigration is the similar to that in Fig. 10(a). Electromigration force pushes the Cu and Sn atoms to the chip side, as presented in Fig. 10(b). However, voids are still observed in the chip side. The results indicate that thermomigration flux of Cu is larger than the sum of the fluxes of Cu electromigration, Sn electromigration, and Sn thermomigration. This is mainly because the Cu diffuses interstitially in Sn, and the diffusion rate is very fast. In addition, the built-in thermal gradient is very large. Figure 10(c) presents the atomic diffusion in Bump 3 with a downward electron flow. Both the electromigration and thermomigration forces push the Cu atoms to the substrate side. In addition, the electromigration force also causes the Sn atoms to drift to the substrate side. Therefore, the downward flux appears to be the largest among the four bumps, resulting in the biggest void formation in the chip side.
Schematic diagrams of the possible atomic fluxes of Cu- and Sn-caused electromigration and thermomigration. (a) Atomic fluxes in Bumps 1 and 4, which have no currents passing through: only thermomigration takes place. (b) Diffusion fluxes of Cu and Sn in Bump 2 with an upward electron flow. (c) Atomic fluxes of Cu and Sn in Bump 3 with a downward electron flow.

IV. CONCLUSION
In summary, thermomigration in Pb-free SnAg solder joints with Cu and Cu/Ni UBMs has been investigated during accelerated electromigration tests under 9.7 × 10³ A/cm2 at 150 °C. In solder joints with Cu UBMs, serious damage was observed in bumps subjected to the current stressing and in those not subjected to current stressing. The damage is attributed to thermomigration of Cu atoms. Theoretic calculations indicate that a critical thermal gradient of ∼400 °C/cm was needed to observe thermomigration during electromigration tests, above which the thermomigration force would be bigger than the electromigration force. It is proposed that Cu–Sn IMCs migrate toward the cold end on the substrate end and, thus, deplete the passivation opening. The thermomigration of the Cu–Sn has serious detrimental effect on the joints. Therefore, under stringent stressing conditions, thermomigration of Cu–Sn IMCs plays a crucial role on the failure mechanism. On the contrary, the critical thermal gradient of ∼8050 °C/cm was needed for the thermomigration of Ni atoms. Therefore, it is difficult to observe thermomigration in the electromigration test in solder joints with Ni UBMs. It also indicates that the Ni UBMs serves as an excellent diffusion barrier for Cu thermomigration.
ACKNOWLEDGMENTS
The authors thank the National Science Council of Republic of China for financial support through Grant No. 98-2221-E-009-036-MY3.