Breast cancer is an adverse life event with differing degrees of severity and can be experienced by the patient through a variety of sequelae, both positive and negative (Koutrouli, Anagnostopoulos, & Potamianos, Reference Koutrouli, Anagnostopoulos and Potamianos2012). The paradigm of suffering from a traumatic event has shifted and positive psychological changes as a result of experiencing a traumatic event have been recorded (Brunet, McDonough, Hadd, Crocker, & Sabiston, Reference Brunet, McDonough, Hadd, Crocker and Sabiston2010). Posttraumatic growth (PTG) was first coined by Tedeschi and Calhoun (Reference Tedeschi and Calhoun1996) and is increasingly used to describe the positive changes resulting from the personal cognitive and emotional efforts in the aftermath of struggling and coping with traumatic events. PTG has been described as perceived changes in the following areas: better interpersonal relationships, greater appreciation of life, and an increased sense of personal strength, greater spirituality, and positive changes in life priorities and life goals (Tedeschi & Calhoun, Reference Tedeschi and Calhoun2004).
Empirical findings provide significant evidence that PTG may occur in a wide variety of contexts (Konkolÿ Thege, Kovács, & Balog, Reference Konkolÿ Thege, Kovács and Balog2014). Cancer is for many a stressful life event; breast cancer in particular has been most frequently studied as a stressful life event, which involves the potential of severance and disruption in women’s lives.
Therefore, women’s struggles with this experience may result in the emergence of positive psychological changes, and breast cancer patients often report PTG (e.g., Cordova, Cunningham, Carlson, & Andrykowski, Reference Cordova, Cunningham, Carlson and Andrykowski2001; Danhauer et al., Reference Danhauer, Case, Tedeschi, Russell, Vishnevsky, Triplett and Avis2013; Soo & Sherman, Reference Soo and Sherman2015).
A variety of instruments have been proposed to assess the positive changes following adverse life events, such as the Stress Related Growth Scale (Park, Cohen, & Murch, Reference Park, Cohen and Murch1996), the Thriving Scale (Abraido-Lanza, Guier, & Colon, Reference Abraido-Lanza, Guier and Colon1998) and the Benefit Finding Scale (Antoni et al., Reference Antoni, Lehman, Kilbourn, Boyers, Culver, Alferi and Carver2001).
The measure most extensively used across a wide variety of research and in distinct populations is the Posttraumatic Growth Inventory (PTGI; Tedeschi & Calhoun, Reference Tedeschi and Calhoun1996). The PTGI is a self-reported measure used to assess positive changes in the aftermath of a traumatic experience. Recent studies show that the PTGI has acceptable psychometric properties, including reliability and validity (e.g., Palmer, Graca, & Occhietti, Reference Palmer, Graca and Occhietti2012). In addition, the fact that this instrument has been validated, translated, and adapted for a wide range of population allows for the comparison between our results and the results found in a large body of published PTGI studies (Anderson & Lopez-Baez, Reference Anderson and Lopez-Baez2011).
Furthermore, the validation process of the PTGI has been conducted with different populations within varying traumatic contexts, and different factor structures have been obtained among different samples across several countries and cultures (Ho et al., Reference Ho, Law, Wang, Shih, Hsu and Hou2013). Validation studies have been conducted with British college students (Linley, Andrews, & Joseph, Reference Linley, Andrews and Joseph2007), Latin immigrants (Weiss & Berger, Reference Weiss and Berger2006), refugees from former Yugoslavian countries (Powell, Rosner, Butollo, Tedeschi, & Calhoun, Reference Powell, Rosner, Butollo, Tedeschi and Calhoun2003), Italian adults (Prati & Pietrantoni, Reference Prati and Pietrantoni2014), Australian undergraduate students (Morris, Shakespeare-Finch, Rieck, & Newbery, Reference Morris, Shakespeare-Finch, Rieck and Newbery2005), and Japanese university studies (Taku et al., Reference Taku, Calhoun, Tedeschi, Gil-Rivas, Kilmer and Cann2007). Although the PTGI has been replicated and its factor structure has been examined in a wide array of studies in varying populations, the underlying factor structure across different validation studies is still controversial (Brunet et al., Reference Brunet, McDonough, Hadd, Crocker and Sabiston2010; Linley et al., Reference Linley, Andrews and Joseph2007).
A few studies reported that a single and general factor of PTG is the best way to define the construct, rather than a multi-factor version (e.g., Sheikh & Marotta, Reference Sheikh and Marotta2005). Other authors report using distinct models of factor solutions to understand PTG, such as the one-factor model (Taku, Cann, Calhoun, & Tedeschi, Reference Taku, Cann, Calhoun and Tedeschi2008), the three-factor model (Joseph, Linley, & Harris, Reference Joseph, Linley and Harris2004; Powell et al., Reference Powell, Rosner, Butollo, Tedeschi and Calhoun2003; Weiss & Berger, Reference Weiss and Berger2006), the four-factor model (Ho, Chan, & Ho, Reference Ho, Chan and Ho2004; Taku et al., Reference Taku, Calhoun, Tedeschi, Gil-Rivas, Kilmer and Cann2007), and the five-factor model (Anderson & Lopez-Baez, Reference Anderson and Lopez-Baez2008; Jaarsma, Pool, Sanderman, & Ranchor, Reference Jaarsma, Pool, Sanderman and Ranchor2006; Linley et al., Reference Linley, Andrews and Joseph2007; Morris et al., Reference Morris, Shakespeare-Finch, Rieck and Newbery2005; Teixeira & Pereira, Reference Teixeira and Pereira2013).
In regards to the sample of cancer patients, there are several studies that examine the psychometric properties of the PTGI specifically for this population in different countries. For instance, Ho et al.’s (Reference Ho, Chan and Ho2004) study examines a sample of Chinese cancer survivors (53.7% of whom are breast cancer survivors) and finds a suitable solution comprised of four factors. A study of cancer survivors in Taiwan and Hong Kong (Ho et al., Reference Ho, Law, Wang, Shih, Hsu and Hou2013) supports the 4-component solution obtained in the Chinese version (Ho et al., Reference Ho, Chan and Ho2004). The PTGI’s Dutch translation maintains the original 5-factor structure in a sample that consists of cancer patients, most of whom are women with breast cancer (Jaarsma et al., Reference Jaarsma, Pool, Sanderman and Ranchor2006). A study with 802 breast cancer patients suggests that all items loaded on a single factor (Bellizzi et al., Reference Bellizzi, Smith, Reeve, Alfano, Bernstein, Meeske and Ballard-Barbash2010). Brunet et al.’s (Reference Brunet, McDonough, Hadd, Crocker and Sabiston2010) study evaluates a sample of 470 breast cancer patients and finds that the five-factor model demonstrates a good fit for the data. In addition, the factor structure is invariant across age, treatment variables, and the time since diagnosis.
The PTGI validation processes, described above, reveal that the factor structure fits the data in different ways depending on the population. This distinction among the several versions may be due to cultural differences among populations and/or to the nature of the traumatic event (Taku et al., Reference Taku, Cann, Calhoun and Tedeschi2008).
In fact, the five-factor model is the most accepted and replicated solution (Taku et al., Reference Taku, Cann, Calhoun and Tedeschi2008). Furthermore, a study with 926 adults who experienced a range of stressfulness events, tested the latent factor structure of PTGI, comparing five models of the underlying structure, and concluded that five-factor model is best suited to characterize PTG as a multidimensional construct (Taku et al., Reference Taku, Cann, Calhoun and Tedeschi2008). Similarly, Linley et al. (Reference Linley, Andrews and Joseph2007) examined the three-factor and the five-factor models and supported that five-factor structure fit the data best.
Two Portuguese validation studies confirm the good fit of the original five-factor solution to data obtained from a sample of divorced adults (Lamela, Figueiredo, Bastos, & Martins, Reference Lamela, Figueiredo, Bastos and Martins2014) and from a sample of adult children of cancer patients (Teixeira & Pereira, Reference Teixeira and Pereira2013).
However, limit research exists concerning the differences between the PTGI factor structure in clinical and non-clinical populations. For example, Purc-Stephenson (Reference Purc-Stephenson2014) tested the invariance across two chronic illness samples and concluded that individuals diagnosed with arthritis and inflammatory bowel disease experience PTG in different ways. Furthermore, some studies have found that breast cancer women reported significantly higher levels of PTG, in comparison with healthy controls (Cordova et al., Reference Cordova, Cunningham, Carlson and Andrykowski2001; Martins da Silva, Moreira, & Canavarro, Reference Martins da Silva, Moreira and Canavarro2011). However, to the best of our knowledge, there is no another study that measures the invariance of PTGI between breast cancer sample and non-clinical sample.
The overall aim of the present study was to test the factor invariance and measurement invariance of PTGI in breast cancer and non-clinical sample. First, we seek to analyze the descriptive values, psychometric properties and the factor structure of the PTGI in a sample of Portuguese women with breast cancer. Second, our goal is to analyze the psychometric properties and the factor structure of the PTGI in a non-clinical Portuguese sample. We expect that the five-factor structure will be suitable for the data of the breast cancer sample and the non-clinical sample, concurring with Brunet et al. (Reference Brunet, McDonough, Hadd, Crocker and Sabiston2010) and Taku et al. (Reference Taku, Cann, Calhoun and Tedeschi2008). Furthermore, we aim to compare the factor structure of the PTGI for both groups. Finally, our goal is to examine the factorial invariance and the latent mean structures of the PTGI for the two distinct groups, in order to test if cross group comparisons can be conducted.
Method
Participants and procedures
This study includes two distinct Portuguese samples, a clinical sample of women with breast cancer and a non-clinical, or normative, sample.
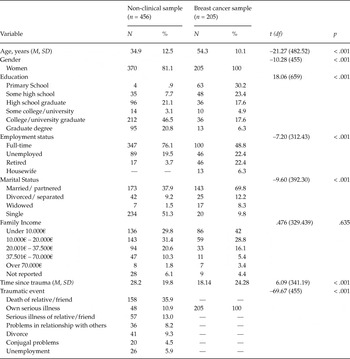
The non-clinical sample consists of 456 adults who have experienced any type of traumatic event within the previous 5 years prior to their participation in the study. We recruited the majority of the participants from the Internet, using Google Docs application (n = 318, 69.7%); however, 138 (30.3%) participants were also recruited from the community using snowball sampling. In both cases, participants were informed about the objectives and procedures of the study, the anonymity and confidentiality of data and the voluntary participation in the study. The mean age of the sample is approximately 35 years old (SD = 12.5). The majority of participants are female (n = 370, 81.1%), married or partnered (n = 173, 37.9%) and employed full-time (n = 347, 76.1%). Concerning participants’ education level, 212 (46.5%) are college or university graduates. In regards to family income, 143 (31.4%) participants earn €10.000–20.000 annually. The most common traumatic event that participants report is the death of a family member or a friend (n = 158, 35.9%), followed by the serious illness of a relative or a friend (n = 57, 13%), and subsequently having a serious illness themselves (n = 48, 10.9%). The mean amount of time following the traumatic experience is 28.2 months (SD = 19.8).
In regards to the clinical sample, 205 Portuguese women diagnosed with non-metastatic breast cancer were recruited from five Portuguese hospitals located in Oporto and Lisbon. Initially, 213 were approached to participate, but 8 women refused to participate. The inclusion criteria for the study are a cancer diagnosis between stages I-III, a first diagnosis of breast cancer, being at least 18 years old, speaking and writing Portuguese fluently, and possessing no other physical or mental condition that could compromise their participation in the study.
The Portuguese Data Protection Authority and the Ethics Committee of each hospital approved this study. Data collection took place in a hospital setting, and the main researcher contacted participants during the treatment phase. Breast cancer patients completed voluntarily the questionnaire during an individual semi-structured interview where the objectives and procedures of the study were explained. The mean of age is 54.32 years old (SD = 10.05). The majority of participants are female (n = 205, 100%), married or partnered (n = 143, 69.8%) and employed full-time (n = 100, 48.8%). Concerning the education and income of participants, 48 (23.4%) participants have only completed primary school and possess a family income of less than €10.000 per year. Concerning the progression of breast cancer, 40 (19.5%) participants have stage I, 68 (33.2%) have stage II, and 31 (15.1%) have stage III.
Additionally, nearly half of participants have had a mastectomy (n = 93, 45.4%), and the majority of participants have undergone either one or more additional treatments, including chemotherapy (n = 165, 80.5%), hormonal therapy (n = 145, 70.7%), and/or radiotherapy (n = 137, 66.8%). When interviewed, a majority of participants were being treated either using hormonal therapy (n = 120, 58.5%) or chemotherapy (n = 38, 18.5%). Participants report the diagnosis of breast cancer as the most traumatic event they experienced. The time since diagnosis was, on average, 18.14 months (SD = 24.28).
Table 1 presents socio-demographic characteristics for both groups. Additionally, it should be noted that all socio-demographic variables were statistically different between breast cancer and non-clinical group. However, both groups did not differ significantly on family income (see Table 1).
Socio-demographic characteristics from breast cancer and non-clinical sample

Materials
The Posttraumatic Growth Inventory (PTGI) (Tedeschi & Calhoun, Reference Tedeschi and Calhoun1996) is employed to measure the positive changes perceived in the aftermath of a traumatic event. This inventory consists of 21 items scored on a 6-point Likert-type scale, ranging from 0 (“I did not experience this change as a result of my crisis”) to 5 (“I experienced this change to a very great degree as a result of my crisis”). The operational definition of PTG was obtained through the sum of the scores of individual items. The PTGI is organized into five subscales which include Relating to Others (7 items - i.e.,“I have a greater sense of closeness with others”), New Possibilities (5 items - i.e., “I have established a new path for my life”), Personal Strength (4 items - i.e., “I now know better that I can handle life’s difficulties”), Spiritual Change (2 items - i.e., “I have stronger religious faith”), and Appreciation of Life (3 items - i.e., “I can better appreciate each day”).
In current study we used the Portuguese version that has been translated and adapted to a sample with Portuguese breast cancer women (Silva, Moreira, Pinto, & Canavarro, Reference Silva, Moreira, Pinto and Canavarro2009).
The PTGI demonstrates good internal consistency for the total scale (α = .90) and for the sub-scales (Relating to Others, α = .85; New Possibilities, α = .84; Personal Strength, α = .72; Spiritual Change, α = .85; and Appreciation of Life, α = .67). The PTGI also has an acceptable test-retest reliability of α = .71, as described in original study (Tedeschi & Calhoun, Reference Tedeschi and Calhoun1996). In a recent study with the goal of testing the factor structure of the PTGI, this inventory demonstrates strong internal consistency for the total scales (α = .94) and the sub-scales (α = .79 – .87) (Taku et al., Reference Taku, Cann, Calhoun and Tedeschi2008). Similar to the original version, PTGI demonstrates good psychometric properties among breast cancer samples (e.g., Brunet et al., Reference Brunet, McDonough, Hadd, Crocker and Sabiston2010), and Portuguese women with breast cancer (Silva et al., Reference Silva, Moreira, Pinto and Canavarro2009).
Data analysis
First, we performed Confirmatory Factor Analysis (CFA) on the total sample of breast cancer patients, and we subsequently performed another CFA on the total non-clinical sample, in order to examine both samples’ goodness-of-fit. For both samples we tested five-factor solution based on previous studies (Taku et al., Reference Taku, Cann, Calhoun and Tedeschi2008; Tedeschi & Calhoun, Reference Tedeschi and Calhoun1996).
Second, we constructed a combined database randomly composed of 40% (n = 187) of the non-clinical sample and 90% (n = 187) of the sample with breast cancer. This database was used for factor structure and measurement invariance. We chose the aforementioned percentages for the purpose of equalizing the proportions of participants in both samples and to prevent possible bias that could be caused by the difference in the total number of participants in the different samples.
Before conducting statistical analysis, the data were screened for potential outliers, missing data, and for multivariate normality (Marôco, Reference Marôco2010). Then, we performed descriptive analysis and preliminary psychometrics analysis. Next, we tested the factor structure, measurement invariance, and latent mean invariance using the maximum likelihood estimation covariance (IBM SPSS AMOS version 22.0).
We conducted a series of CFA in order to compare several different internal factor structures of PTGI, in the combined database. In accordance with previous studies, these models include, a one-factor model (Taku et al., Reference Taku, Cann, Calhoun and Tedeschi2008) (Model 1a), a three-factor model (Taku et al., Reference Taku, Cann, Calhoun and Tedeschi2008) (Model 1b), a four-factor model (Silva et al., Reference Silva, Moreira, Pinto and Canavarro2009) (Model 1c), and a five-factor scale based on the PTGI subscales (Taku et al., Reference Taku, Cann, Calhoun and Tedeschi2008; Tedeschi & Calhoun, Reference Tedeschi and Calhoun1996) (Model 1d).
The reliability of PTGI was tested by internal consistency and inter-item correlations of the different factors. Construct validity was assessed using the subscales of PTGI. Multiple model fit indices were used to evaluate model fit, including χ2 statistics, the Compared Fit Index (CFI), the Non-Normed Fit Index (NFI), and the Root Mean Square of Approximation (RMSEA), which showed values between .05 and .10 indicating an acceptable model fit (Hair, Black, Babin, Anderson, & Tathan, Reference Hair, Black, Babin, Anderson and Tatham2006). Moreover, values greater than .90 from the Incremental Fit Indices (CFI; NFI) indicate good fit, and χ2 statistics were used to assess model differences during invariance tests (Hair et al., Reference Hair, Black, Babin, Anderson and Tatham2006).
After conducting CFA, the best-fitting model was selected, and we utilized the best factor-structure of the PTGI we used multi-group CFAs through a stepwise procedure (Byrne, Reference Byrne2001) to establish the invariance of the PTGI across both groups. This procedure was initiated through the application of a baseline model with no constraints (Model 2a). Subsequently, we estimated successive models with distinct restrictions among them. Thus, equality constraints were applied for factor loadings (FL) (Model 2b), measurement intercepts (MI) (Model 2c), structural covariances (SC) (Model 2d), and measurement residuals (MR) (Model 2e). In all successive models, the invariance was measured using ∆χ2 and ∆CFI. Therefore, a ∆χ2 lower than the standardized χ2 for 1–α = .095 and a value of ∆CFI of less than .01 establish the invariance between the breast cancer patient sample and the non-clinical sample (Byrne, Reference Byrne2001).
Results
Factor structure of the PTGI for the total samples
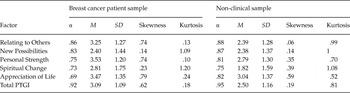
Table 2 summarizes the distributional properties, including the distribution patterns, means, standard deviations, and reliability coefficients of the total score of the PTGI and the subscales. We can assume that the sample exhibits normality, homoscedasticity, and linearity based upon the scores found in total samples of both groups. Based on this scores, participants reported high levels of PTG, with total score of 3.09 (SD = 1.09), with a range from 0 to 5, for breast cancer sample and total score of 2.50 (SD = 1.16), with a range from 0 to 5, for non-clinical sample. When comparing the means of both groups, the breast cancer patient sample reports the highest means in PTGI total score and all factors, with the dimension of “Relating to others” possessing the highest value. Cronbach’s alpha indicated moderate to high internal consistency for total scale and five factors (see Table 2). For the sample of breast cancer patients, the internal reliability coefficients (Cronbach’s alpha) is .92 for the total PTGI score, and range from .69 to .86 for subscales. For the non-clinical sample, Cronbach’s alpha for the total scale is high (α = .95) and for subscales ranged from .75 to .88.
Reliability coefficients, means (M), standard deviations (SD), and distribution for the breast cancer group and the non-clinical group in relation to each PTGI factor

Table 3 describes the goodness of fit of the factor structures for the sample of breast cancer patients and for the non-clinical sample. The reported results show that the five-factor structure (Taku et al., Reference Taku, Cann, Calhoun and Tedeschi2008) demonstrates an acceptable fit to the current data from the breast cancer patient sample and a good fit to the data of the non-clinical sample (see Table 3). The convergent validity (Average Variance Extracted [AVE]) is higher than .50 for each sub-scale and the composite reliability (CR) is higher than .70, with the exception of Spiritual Development, which has a CR of .68. Regarding discriminant validity, the subscales are well discriminated from each other, as the AVE of each subscale is larger than the square of the correlation inter-factors. Similar to the breast cancer patient sample, the non-clinical sample reports good psychometric properties. The AVE ranges from .64 to .73 and the CR ranges from .84 to .93. Thus, the scale has satisfactory reliability and convergent validity. Discriminant validity is also assured.
Fit indices for the total breast cancer patient sample and the non-clinical sample

Note: ** p < .001; CFI = Comparative Fit Index; NFI = Non-normed fit index; RMSEA = Root Mean Square Error of Approximation; CI = Confidence Interval 90%.
Confirmatory factor analyses for combined database
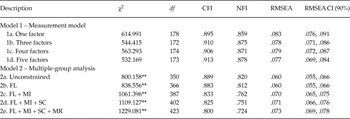
Table 4 describes the models of CFA for the combined total sample. First, for all models (Model 1a –1d), χ2 is significant, but does not meet the required cut-off criteria for a good fit, since the scores are not close to 1. However, the χ2 statistics are influenced by the size of the sample, and for that reason they are not considered to be a major indicator of model fit. Examining other fit indices, we see that the five-factor model (Model 1d) possesses the best fit for the data. This is demonstrated by the scores of the CFI and the NFI, which are close, to .90, in addition to the RMSEA, which is less than .08.
Goodness of fit statistics for the measurement models and factorial invariance

Note: ** p < .001. CFI = Comparative Fit Index; NFI = Non-normed fit index; RMSEA = Root Mean Square Error of Approximation; CI = Confidence Interval 90%; FL = Factor Loadings; FC = Factor Covariances; MI = Measurement Invariances; SC = Structural Covariances; MR = Measurement Residuals.
Multi-group factorial analyses
Multi-sample CFA results are seen in table 4 (Model 2a–2e). The baseline model (Model 2a), without constraints reveals acceptable fit indices for each subsample. The second model (Model 2b), which constrains the factor loadings, reveals no invariance between both groups.
The ∆CFI is lower than .01; however, the ∆χ2 (36.398) is higher than the standardized ∆χ2 for a confidence level of .95. This illustrates the non-invariance of the factor loadings for the PTGI structure when comparing the non-clinical sample with the sample of women diagnosed with breast cancer. In addition, subsequent models show ∆χ2 to be higher than the standardized ∆χ2, confirming that the procedural steps used to test for multi-group invariance are not necessary after verifying that model 2b is not invariant.
In order to examine the differences of factor weights between factorial structures of each group, we perform critical ratios for differences between parameters (model 2a) and we obtain significant differences on item 8 (2.48, p = .01), item 9 (2.42, p = .02), item 15 (2.73, p < .01), item 16 (2.80, p < .01), item 18 (3.69, p < .01) and item 21 (2.31, p = .02). The breast cancer group reported the higher scores on all these items.
Discussion
In current study, we first examine the psychometric properties of the five-factor solution for the total sample of breast cancer and for the total sample of non-clinical participants. Breast cancer participants reported higher levels of PTGI for total score and subscales, than non-clinical participants who have experienced any type of traumatic event. Previous research shows that breast cancer characteristics are associated with high levels of distress or even Posttraumatic Stress Disorder symptoms (Koutrouli et al., Reference Koutrouli, Anagnostopoulos and Potamianos2012). In fact, breast cancer is a life-threatening disease involving multiple stressors which may challenge core beliefs about the world and the future (Cordova et al., Reference Cordova, Cunningham, Carlson and Andrykowski2001). Thus, to deal with threat of the disease, the woman with breast cancer is led to engage in cognitive and interpersonal processes to reexamine and rebuild the core assumptions. This process may be an important determinant of the positive reappraisal and cancer-related growth (Cann et al., Reference Cann, Calhoun, Tedeschi, Kilmer, Gil-Rivas, Vishnevsky and Danhauer2010).
In addition, the scores of PTGI from breast cancer patients are lower than PTGI’ scores previously reported (Silva et al., Reference Silva, Moreira, Pinto and Canavarro2009), but higher than those reported in other studies with breast cancer (Cordova et al., Reference Cordova, Cunningham, Carlson and Andrykowski2001; Danhauer et al., Reference Danhauer, Case, Tedeschi, Russell, Vishnevsky, Triplett and Avis2013; Soo & Sherman, Reference Soo and Sherman2015) and cancer patients (Ho et al., Reference Ho, Chan and Ho2004; Jaarsma et al., Reference Jaarsma, Pool, Sanderman and Ranchor2006; Morris, Wilson, & Chambers, Reference Morris, Wilson and Chambers2013). The PTG reported by non-clinical participants were similar to the sample of students from the study from Taku et al. (Reference Taku, Cann, Calhoun and Tedeschi2008), but higher than normative sample from the study of Linley et al. (Reference Linley, Andrews and Joseph2007).
As hypothesized, the findings from several CFAs support the good fit of the original five-factor structure of the PTGI (i.e., relating to others, new possibilities, personal strength, spiritual change, and appreciation of life), which is consistent with other research that has found that the five-factor structure exhibits a better fit to the data from non-clinical populations, such as college students (Morris et al., Reference Morris, Shakespeare-Finch, Rieck and Newbery2005; Taku et al., Reference Taku, Cann, Calhoun and Tedeschi2008; Tedeschi & Calhoun, Reference Tedeschi and Calhoun1996), and adults who experienced a range of adverse life events (Prati & Pietrantoni, Reference Prati and Pietrantoni2014). Although our findings show that model fit indices are not very different from each other, they provide strong evidence that PTG may be conceptualized as a multidimensional construct with five distinct and correlated dimensions. The one-factor solution has the worse model fit indices. Furthermore, the three-factor and four-factor structures are not proven to be fitted solutions for the PTGI.
In addition, our results supported PTGI’s original five-factor structure (Taku et al., Reference Taku, Cann, Calhoun and Tedeschi2008; Tedeschi & Calhoun, Reference Tedeschi and Calhoun1996) for both samples, since this model exhibits a good fit to the data from breast cancer sample and from non-clinical sample. Despite the fact that PTGI has been validated for the Portuguese population (Lamela et al., Reference Lamela, Figueiredo, Bastos and Martins2014; Silva et al., Reference Silva, Moreira, Pinto and Canavarro2009; Teixeira & Pereira, Reference Teixeira and Pereira2013), this study is extremely relevant, since we apply the research instrument to the normative population. We should emphasize that the five-factor model fit well to breast cancer and non-clinical group, in spite of the fact that significant differences between both groups were found on several socio-demographic variables.
The current study also aims to examine the factor structure and the invariance of the PTGI among a non-clinical sample and a sample of breast cancer patients. The results of multi-group CFA confirm that the unconstrained model (Model 2a) shows equivalent model fit values between the two groups, proving that there is configurational invariance. This signifies that the version of PTGI for Portuguese women with breast cancer can be also applied to Portuguese women and men without oncological disease. The second model, which has factor loadings constraints, does not provide evidence for measurement invariance between both groups. In other words, the factor structure and other parameters (i.e., factor loadings, variances, and co-variances) are not invariant across the breast cancer patient sample and the non-clinical sample. Thus, PTG is measured with different factor weights in the groups being compared when using the five-factor model. According to this assumption, the PTGI can be used in clinical and non-clinical groups; however, to assess the factorial weights, the factor structure should be tested separately in each sample.
Finally, it is noted that breast cancer women reported higher factor weight on five items from Relating to Others and one item from Spiritual Change, when comparing with non-clinical sample, as shown by the results of critical ratios for differences. These findings suggested that the degree of proximity and intimacy with others and spiritual change are easily identified, in the context of individual experiences with breast cancer. This assumption, reported in this study, emphasizes the need for special attention to this phenomenon of changing relationship with others, during psychotherapy with breast cancer patients.
We should note several limitations of the current study. The major limitation is related to the significant differences of mean of age between both groups, which may limit the generalization of the results. Second, the most common traumatic event among the non-clinical sample is the death of a relative or a friend, while breast cancer was the only traumatic event we measure in the other sample. However, we do not compare the different events in relation to PTG. Further studies are needed to compare the differences of PTG with respect to different types of traumatic events and different types of cancer. In addition, we should note that the death of a relative or a close friend and breast cancer, are distinguishable from each other not only in nature as well as due to the characteristics inherent to each event. This difference, in turn, might compromise the comparison between the two groups. Third, the amount of time following the occurrence of the traumatic event is different between both groups, which may also cause a potential limitation. In the non-clinical sample, on average, approximately 28 months had passed since the traumatic event. This is 10 months more than the mean amount of time reported by breast cancer sample. We should acknowledge that the retrospective perception of PTG could be different from the PTG perceived directly following a traumatic experience. Regarding the sample characteristics, the non-clinical sample is characterized by higher levels of education and a more elevated socio-economic status, when compared to breast cancer patient sample. The diverse cultural and educational backgrounds of the samples, could also interfere with the PTGI scores and with the generalization of the results.
In accordance with PTG model (Tedeschi & Calhoun, Reference Tedeschi and Calhoun1996), the life crises experienced should be “seismic” enough to challenge the core beliefs, so that PTG can emerge. The severity and the stressfulness of the event should be assessed in further studies. An additional limitation is the cross-sectional design, which constrains our ability to evaluate PTG at different points of measurement. Therefore, we recommend future longitudinal studies using both samples.
In summary, the current study supports the consistency and the validity of the PTGI in a sample of breast cancer patients and in a non-clinical sample. The five-factor model proves to be well adjusted to both samples. The invariance of the PTGI across samples is still not confirmed. Prospective studies should continue to test the factor invariance of the PTGI across other oncological and clinical populations.