Implications
Concentrates are the most expensive feed input on dairy farms, due to the global cereal market and the relative cost of high quality forage. Strategies which can improve the efficiency of concentrate utilisation may lead to improvements in dairy farm profitability. This experiment identified variation in the response in milk production to concentrate input, based on the milk production capability of cows. The study highlighted potential gains in concentrate use efficiency with a concentrate feeding strategy that is based on a cow’s milk yield potential.
Introduction
High input or high cost dairy production systems are more sensitive to feed price and milk price fluctuations than low input systems, which utilise a larger proportion of grazed grass (Patton et al., Reference Patton, Shalloo, Pierce and Horan2012). In 2015, European dairy producers may become more exposed to periods of low milk price, as they enter into an unrestricted world market post-EU imposed milk quota. Correspondingly, global cereal price is likely to rise over time, due to an increasing global population coupled with increasing use of grain for biofuel production (Alexandratos and Bruinsma, Reference Alexandratos and Bruinsma2012). Dairy production systems which utilise large quantities of cereal-based concentrate feeds must ensure that the quantity and distribution of concentrate across a herd will maximise production efficiency per unit of concentrate offered.
Concentrates are conventionally offered to a herd at a flat rate (i.e. all cows in the herd receive a similar rate of concentrate input, regardless of milk production (MP)), as this method is a relatively easy to manage system on farm. Within any herd there is variation in MP, as a result of cow genotype (Veerkamp et al., Reference Veerkamp, Simm and Oldham1994), parity (Horan et al., Reference Horan, Dillon, Berry, O’Connor and Rath2005) and stage of lactation (Garcı́a and Holmes, Reference Garcı́a and Holmes2001). When allocating concentrate at a flat rate to the herd, the producer is at risk of under feeding cows with a larger feed demand, or over feeding cows, which have a lesser feed demand. Cows which are capable of large milk yields, partition a greater proportion of feed energy into MP (Veerkamp et al., Reference Veerkamp, Beerda and Van Der Lende2003) and may have a greater response to additional concentrate input. Cows which are less capable of large milk yields, partition excess energy into maintaining body fat reserves (Ferris et al., Reference Ferris, McCoy, Lennox, Catney and Gordon1999) and have a reduced response to concentrate (Horan et al., Reference Horan, Dillon, Berry, O’Connor and Rath2005). Offering concentrate based on the ability of a cow to produce milk (feeding to yield) may optimise concentrate utilisation efficiency and reduce the degree of over or under feeding. The present experiment is based on the hypothesis that cows in the high MP sub-group will have a different yield response to concentrate supplementation than cows in the low MP sub-group.
When previous studies compared flat rate concentrate feeding strategy with feeding to yield, there was no significant difference in mean MP between the two treatments (Taylor and Leaver, Reference Taylor and Leaver1984; Kellaway and Harrington, Reference Kellaway and Harrington2004). Previous experiments have based feeding to yield on MP during the first 14 days of lactation; and did not examine differences in MP between sub-groups in the feeding to yield treatment. MP during the first 14 days is subject to large variation as a result of metabolic changes which occur during the transition period (Drakley, Reference Drackley1999). In the present experiment the feeding to yield treatment used MP data measured during the 3rd and 4th weeks of lactation, as MP during this period has been shown to reflect the MP potential of dairy cows (Spahr et al., Reference Spahr, Shanks, McCoy, Maltz and Kroll1993). The present study aims to describe the differences in MP between the sub-groups within the feeding to yield treatment and those within the flat rate treatment.
There are also a dearth of experiments examining the effects of feeding to yield using grass silage plus maize silage as the basal diet. In Ireland maize silage production is increasing in popularity in winter MP systems. Cows offered a base diet of grass silage and maize silage have reduced substitution rates with concentrate and increased total dry matter intake (TDMI) compared to cows offered a base diet of grass silage only, due to increased fermentation rate within the rumen (Fitzgerald et al., Reference Ferris, Gordon, Patterson, Porter and Yan1999)
The objective of this experiment was to compare the effects of a feed to yield (FY) concentrate feeding strategy with conventional flat rate concentrate feeding, on TDMI, MP and energy balance, when autumn calved dairy cows were offered a grass silage and maize silage basal diet.
Material and methods
The study was carried out at Teagasc, Animal & Grassland Research and Innovation Centre, Moorepark, Fermoy, Co. Cork, Ireland (52°16' N, 8°25' W).
Cows and experimental design
Data were collected in two experiments, which were conducted between 24 October 2011 and 8 January 2012 (Year 1), and between 20 October 2012 and 5 January 2013 (Year 2). In both years cows remained on experimental treatments for 11 weeks. A total of 60 cows were included in the experiment in Year 1, and 48 in Year 2. Each year cows were blocked into three sub-groups based on: calving date, parity, and average milk yield, milk solids composition, BW and body condition score (BCS) data collected during the 3rd and 4th week of lactation. The resulting MP sub-groups were high MP (HMP, mean milk yield 27.9±4.0 kg in Year 1 and 25.8±2.5 kg in Year 2), medium MP (MMP, 24.7±3.7 kg in Year 1 and 22.4±2.35 kg in Year 2) and low MP blocks (LMP, 20.0±4.0 kg in Year 1 and 19.9±2.15 kg in Year 2). Cows from each block were randomly assigned to one of two concentrate feeding strategies, flat rate (FR) or FY. Cows on the FR treatment were offered a fixed rate of concentrate (5.5 kg dry matter (DM)/cow per day). The mean rate of concentrate was chosen based on the original diet formulation for 19.5 UFL (Unité Fourragère Lait; Jarrige, Reference Jarrige1989) estimated net energy intake, which included 16 kg DM of forage. Cows on the FY treatment were offered differing rates of concentrate based on the MP sub-group to which they had been categorised. High MP-FY cows were allocated 7.3 kg DM total concentrate/cow per day, MMP-FY cows were allocated 5.5 kg DM total concentrate /cow per day and LMP-FY cows were allocated 3.7 kg DM total concentrate/cow per day. The total quantity of concentrate offered to the FR treatment herd was the same as the total quantity of concentrate offered to the FY treatment herd during the experiment.
Treatment allocation and management
Cows were housed and offered access to the base diet in cubicle accommodation. The base diet consisted of 44.5% grass silage, 41.0% maize silage, 12.5% soya bean meal and 2.0% molasses (on a DM basis). The base diet was mixed using a horizontal paddle mixer wagon (Keenan, Borris, Carlow, Ireland). The base diet was offered ad libitum, allowing for 5.0% daily refusals in electronically controlled Griffith Elder Mealmaster individual feed bins (Griffith Elder and Company Ltd, Suffolk, England) as described by Lawrence et al. (Reference Lawrence, O’Donovan, Boland, Lewis and Kennedy2014). Concentrate offered in the parlour contained 25.0% wheat, 15.0% soya hulls, 10.0% extracted rapeseed, 10.0% extracted sunflower seed, 10.0% palm kernel expeller, 6.0% milk solids (lactose), 5.0% maize gluten feed, 5.0% citrus pulp, 5.0% soya bean meal, 4.0% oat feed, 0.5% palm oil, 4.0% magnesium and 0.5% protected trace elements, on a DM basis.
Pre-experimental and training period
Cows were trained to use the Griffith Elder Mealmaster system over a 5-day period, 3 weeks before the start of the calving period. Once training was completed the prepartum herd was offered 17 kg grass DM, which was grazed in situ daily and no concentrate. Concentrates were included in the postpartum diet and were increased to 5 kg over a 2-week period. Cows were housed fulltime from 1 week before the start of the experiment.
Animal measurements
Dry matter intake (DMI)
Individual fresh weight intake of the base diet was recorded daily using the Griffith Elder Mealmaster system, which used access controlled forage mangers that were mounted on weigh cells. Samples of maize silage, grass silage and soya bean meal were collected from the feed silos twice weekly and a sample of concentrate was collected from the milking parlour once weekly. The DM concentration of each feed sample was calculated by drying 100 g of the fresh sample at 90°C for 15 h in a forced air oven (Carbolite, Derbyshire, UK) to determine its constant dry weight (Beecher et al., Reference Beecher, Hennessy, Boland, O’Donovan and Lewis2013). The DM concentration of each feed ingredient was used to formulate the base diet on a DM basis and to calculate the total DMI from the fresh weight intakes recorded by the Griffith Elder Mealmaster system. Concentrate was allocated in the parlour using automated feeders which were controlled by electronic identification ear tags and a computer software package (FeedRite feeders, Milk Manager Software; Dairymaster, Causeway, Co. Kerry, Ireland). Feed troughs were monitored daily to ensure there were no refusals.
Milk yield and composition
Individual cow milk yields (kg) were recorded automatically at each morning (0730 h) and evening (1530 h) milking (Dairymaster). Milk fat, protein and lactose concentrations were determined once weekly from successive p.m. and a.m. milk samples. Fat, protein and lactose concentrations were measured using a Milkoscan 203 (AOAC 972.16; Foss Electric, Hillerød, Denmark). The equations which were outlined by Faverdin et al. (Reference Faverdin, Dulphy, Coulon, Verite, Garel, Rouel and Marquir2011) and adapted in Ruelle et al. (Reference Ruelle, Shalloo, Wallace and Delaby2015) were used in the present study to calculate weekly theoretical MP potential for the experimental period.
BW and BCS
BW was recorded once weekly using a portable weighing scale and Winweigh software package (Tru-test Limited, Auckland, New Zealand). BCS was recorded once weekly by one experienced observer using a 1 to 5 scale (1=emaciated, 5=extremely fat) with 0.25 increments (Edmonson et al., Reference Edmonson, Lean, Weaver, Farver and Webster1989). Change in BW and BCS were calculated as the differences in BW and BCS between the start (average of first 2 weeks) and end (average of final 2 weeks) of the study.
Blood samples
Blood samples were collected on a fortnightly basis from the 1st week of the experimental period until the end of the experimental period. The samples were taken immediately after the a.m. milking by venipuncture of the median coccygeal blood vessel, on the ventral aspect of the tail. Blood samples were collected in 10 ml lithium heparin vacutainers (Becton Dickson, Plymouth, UK). The samples were centrifuged within 2 h of collection using a swing head centrifuge (Sigma Laborzentrifugen, Osterode am Harz, Germany) set to 3000×g for 15 min at 5°C. The plasma was decanted into two 1.5 ml aliquots, which were labelled and stored at −20°C. The samples were defrosted and analysed for the metabolites glucose, non-esterified fatty acids (NEFA), beta-hydroxybutyric acid (βHBA) and urea by enzymatic colorimetry using suitable test kits (βHBA, urea and glucose kits supplied by ABX Mira, Montpellier, France; NEFA kits supplied by Wako Chemicals, GmbH, Nissanstraße, Germany) and an ABX Pentra auto analyzer (ABX Mira, Cedex, France).
Energy balance
The energy balance of each cow was calculated as the difference between energy intake and the sum of energy required for maintenance, MP, growth and a correction factor for the negative associative effects of concentrate on diet digestibility. The French net energy system as described by Jarrige (Reference Jarrige1989) and revised for Irish production systems by O’Mara (Reference O’Mara1996), was used in the present experiment. In this system, 1 UFL is the net energy content available in 1 kg of air-dry standard barley for MP (equivalent to 1.7 Mcal NEL, Jarrige, Reference Jarrige1989). Energy intake was calculated by multiplying the UFL value of each feed ingredient by the DMI of that ingredient. The correction factor was then deducted from the energy intake value to give net energy intake. The equations used to estimate energy requirement are listed in Lawrence et al. (Reference Lawrence, O’Donovan, Boland, Lewis and Kennedy2014).
Chemical analysis of feeds
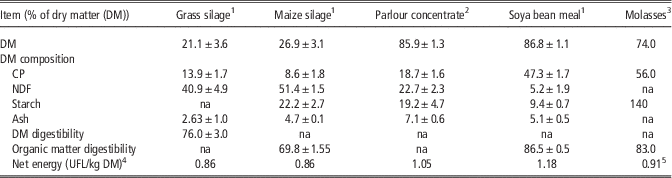
Analyses of CP, ash, dry matter digestibility, water soluble carbohydrate, lactic acid and NDF concentration, were carried out on fresh samples of grass silage, concentrate and soya bean meal using near IR reflectance spectroscopy (model 6500; FOSS-NIR System, Hillerød, Denmark). Maize silage samples were analysed by wet chemistry for CP, NDF, ADF, ash and starch. The N concentration was determined using a Leco FP528 N analyzer (AOAC 900.03; Leco Australia Pty Ltd, Castle Hill, New South Wales, Australia) with a method adapted by Sweeney (Reference Sweeney1989). CP was then determined as N concentration×6.25. NDF and ADF were analysed using the Ankom Fiber Analyzer (AOAC 2002.04; Ankom Technology Corporation, New York, NY, USA) using the procedure of Van Soest et al. (Reference Van Soest, Robertson and Lewis1991). Amylase and sulphite were used in the process of NDF analysis. Ash concentration was determined by placing samples in a muffle furnace for 16 h at 500°C (AOAC 942.05). Starch concentration was analysed by treating the sample with hot dilute hydrochloric acid. Following filtration and clarification, the optical rotation of the prepared solution was measured using an automatic polarimeter (Optical Activity Ltd, Ramsey, Cambridgeshire, UK). The chemical composition of the feed ingredients offered is described in Table 1.
Chemical composition of feed ingredients offered to all treatments in Year 1 and Year 2

Values presented are mean±SD.
1 n=44.
2 n=22.
3 Values from Sauvant et al. (Reference Sauvant, Perez and Tran2004).
4 1 UFL=1.7 Mcal NEL (Jarrige et al., Reference Jarrige1989).
5 Values from Jarrige et al. (Reference Jarrige1989).
Statistical analyses
Data preparation and preliminary investigations were performed using SAS (version 9.3; SAS Institute Inc., Cary, NC, USA, 2008; SAS Institute, 2011). The final statistical models were performed using mixed procedure analysis with the REML method. Initially, data were examined for outliers, by comparing the most extreme values of each response variable to three standard deviations of the mean. A minute number of data points which did not follow the empirical rule or were considered not biologically feasible were removed. The univariate procedure was used to determine the normality of data from each response variable by examining the residual error of the response variable by block regression. At this point, all data were considered normal and the residual errors of all data were normally, identically and independently distributed. Approximate F-tests were used to assess the significance of systematic effects and/or their interactions. Only effects with a P value of <0.06 were retained in the final model, with the exception of MP sub-group and concentrate feeding strategy, which were always fitted for the relevant traits regardless of significance. The final model for testing; average daily MP, milk composition, feed intake, BW, BCS and energy balance data, included terms for; MP sub-group, concentrate feeding strategy, year, week of experiment and days in milk as a covariate. Repeated measures were used with week of experiment as the repeated unit, block was included as the random factor and cow within lactation number was the most suitable subject. In all cases the heterogeneous first order auto regressive covariance structure provided the best fit based on the Bayesian coefficient. Least square means were calculated using the LSMEANS/PDIFF option, and statistical significance was determined following the Tukey–Kramer adjustment.
Results
DMI
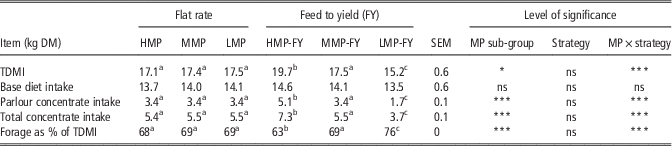
There was an interaction between MP and concentrate feeding strategy on TDMI, concentrate intake, and the percentage of forage and concentrate consumed (P<0.001, Table 2). On the FR treatment there was no difference in TDMI between MP sub-groups (17.3 kg DM). On the FY treatment, however, the TDMI of the HMP-FY treatment was (2.2 kg, P<0.05) greater than MMP-FY, and 4.5 kg, (P<0.001) greater than LMP-FY (15.2 kg DM). The TDMI of the HMP-FY treatment was 2.6 kg greater than HMP-FR (17.1 kg, P<0.05). The TDMI on the MMP-FY and MMP-FR treatments were similar (17.5 kg DM/cow per day). The TDMI of the LMP-FY treatment was 2.3 kg less than LMP-FR (17.5 kg, P<0.05).
The effect of concentrate feeding strategy and milk production potential on mean daily dry matter (DM) intake

HMP=high milk potential sub-group; MMP=medium milk potential sub-group; LMP=low milk potential sub-group; MP=milk potential; TDMI=total dry matter intake.
a,b,cValues within a row with difference superscripts differ significantly at P<0.05.
Values are mean; *P<0.05; ***P<0.001; ns P>0.05.
Total concentrate intake on the HMP-FY treatment was 1.9 kg DM greater (P<0.001) than on HMP-FR (5.4 kg DM/cow per day), and concentrate intake was 1.8 kg DM less (P<0.001) on LMP-FY than LMP-FR (5.5 kg/cow per day). The MMP-FR and MMP-FY treatments had the same total concentrate intake (5.5 kg DM/cow per day). The overall concentrate intake of the FY and FR treatments was the same.
The HMP-FR treatment had a greater (P<0.001) forage to concentrate ratio (2.1 kg forage DM/kg concentrate DM) than HMP-FY (1.7 kg forage DM/kg concentrate DM). The forage to concentrate ratio was greater on LMP-FY (3.2 kg forage DM/kg concentrate DM) than on LMP-FR (2.2 kg forage DM/kg concentrate DM, P<0.001). The MMP-FR and MMP-FY treatments had the same forage to concentrate ratio (2.2 kg forage DM/kg concentrate DM).
MP
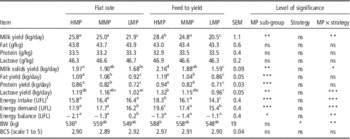
There was an interaction between MP and concentrate feeding strategy on milk yield (P<0.01), milk solids yield (P<0.05) and lactose yield (P<0.001; Table 3). The mean daily milk yield of cows on the HMP-FR and MMP-FR treatments were similar (25.4 kg) and greater (P<0.05) than the milk yield of the LMP-FR treatment (21.9 kg). On the FY treatment milk yield decreased as the rate of concentrate decreased. The HMP-FY treatment had a milk yield 2.6 kg greater than HMP-FR (P<0.01). There was no difference in MP between the MMP-FR and MMP-FY treatments (24.9 kg), or the LMP-FR and LMP-FY treatments (21.2 kg).
The effect of concentrate feeding strategy and milk production potential on milk production, energy balance, BW and body condition score (BCS)

HMP=high milk potential sub-group; MMP=medium milk potential sub-group; LMP=low milk potential sub-group; MP=milk potential.
a,b,cValues within a row with different superscripts differ significantly at P<0.05.
1 1 UFL=1.7 Mcal NEL (Jarrige et al., Reference Jarrige1989).
Values are mean; *P<0.05; **P<0.01; ***P<0.001; ns P>0.05.
Milk solids yield (MSY) was 0.29 kg greater (P<0.05) on HMP-FR than LMP-FR, and the MMP-FR treatment was not different from HMP-FR or LMP-FR. The MSY was greatest overall on the HMP-FY treatment, which was 0.19 kg greater than the HMP-FR treatment (P<0.01), 0.27 kg greater than the MMP treatments and on an average 0.52 kg greater than the LMP treatments (P<0.01). The HMP-FY treatment had a milk lactose yield which was 0.36 kg greater (P<0.001) than LMP-FY (0.96 kg), and MMP-FY was similar to both sub-groups. There was no significant difference between MP sub-groups on the FR treatment. The MMP-FR and MMP-FY treatments had similar milk lactose yields and the LMP-FR and LMP-FY sub-groups had similar lactose yields.
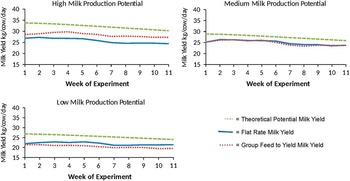
The milk fat and protein yields of cows fed the HMP treatments were (0.09 and 0.08 kg, respectively) larger than cows fed, the MMP treatments which were (0.25 and 0.18 kg, respectively) larger than that from cows fed, the LMP treatments (P<0.001). The theoretical potential milk yield during the experimental period was on average 5.1 kg greater than the actual MP of the HMP sub-group, 0.6 kg greater than the actual MP of the MMP sub-group and 4.4 kg greater than the actual MP of the LMP sub-group (Figure 1). The difference between the theoretical potential milk yield and actual MP for the cows fed HMP-FY treatment was 3.8 kg, and for HMP-FR was 6.4 kg. The theoretical potential milk yield was 3.7 kg greater than the actual MP of the LMP-FR treatment, and 5.1 kg greater than the actual MP of the LMP-FY treatment. The theoretical potential milk yield was greater than the actual MP to the MMP-FR treatment by the same amount as it was greater than the actual MP of the MMP-FY treatment.
The effect of concentrate feeding regime and milk production potential on daily milk production and theoretical potential milk yield.

Energy balance
When the estimated net energy intake, demand and balance were examined there were interactions between MP and concentrate feeding strategy (P<0.001; Table 3). There was no significant difference in energy intake between MP sub-groups on the FR treatment. The estimated energy intake of the HMP-FY treatment was 2.5 UFL greater (P<0.001) than the estimated energy intake of HMP-FR treatment (15.8 UFL). The estimated energy intake of the LMP-FY treatment was 2.1 UFL less (P<0.001) than on the LMP-FR treatment (16.4 UFL), and there was no significant difference in estimated energy intake between MMP-FY and MMP-FR (16.3 UFL).
The estimated energy demand was on average 1.6 UFL less on the LMP-FR treatment than on the HMP-FR or MMP-FR treatments (17.7 UFL). Cows on the HMP-FY treatment had 1.7 UFL greater energy demand than cows on HMP-FR (P<0.001). There was no significant difference in energy demand between the MMP-FY and MMP-FR (17.6 UFL) or between the LMP-FY and LMP-FR (15.8 UFL).
The LMP-FR treatment was the only treatment with a positive estimated energy balance (+0.2 UFL), and the remaining treatments were significantly less, all were similar to one another (−1.4 UFL).
BW, BCS and blood metabolites
There was an interaction between MP sub-group and concentrate feeding strategy on mean BW during the experimental period. The HMP-FY treatment had a mean BW that was 52 kg greater than the HMP-FR treatment (Table 3). There were no significant differences in the BW change between treatments from the initiation of the experimental period to the end of the experiment. There was no significant difference in mean BCS between treatments; however, the mean change in BCS of the FR cows was −0.22, which tended to be greater than the loss in BCS on the FY treatment (−0.12; P=0.05).
There was no effect of concentrate feeding strategy on the mean concentration of blood plasma glucose, βHBA, NEFA or urea (Table 4). Blood plasma βHBA concentration in HMP sub-groups was 0.05 mg/dl greater than MMP and LMP sub-groups (0.52 mg/dl; P<0.05). Blood plasma NEFA concentration was 0.05 mg/dl greater (P<0.05) in HMP cows than LMP cows (0.09 mg/dl; P<0.05) and the concentration of blood plasma NEFA in the MMP sub-groups was similar to the HMP and LMP sub-groups.
The effect of concentrate feeding strategy and milk production potential on blood metabolite concentrations

HMP=high milk potential sub-group; MMP=medium milk potential sub-group; LMP=low milk potential sub-group; MP=milk potential; NEFA=non-esterified fatty acid; βHBA=beta-hydroxybutyric acid.
a,bWithin a row means with different superscripts differ significantly.
Values are mean; *P<0.05; ns P>0.05.
Discussion
Cows were assigned to their MP sub-groups based on MP data recorded during the 3rd and 4th weeks of lactation, as this was found to be an accurate indication of MP potential (Spahr et al., Reference Spahr, Shanks, McCoy, Maltz and Kroll1993). This study compared the effects of feeding concentrate based on MP sub-group, to feeding all cows the same quantity of concentrate irrespective of MP sub-grouping. The present experiment is based on the hypothesis that HMP cows will have a different yield response to concentrate supplementation than LMP cows. The hypothesis of the present study may be accepted as HMP cows increased milk yield when concentrate was fed to yield compared to FR feeding, and there was no significant difference in LMP milk yields between the FY and FR treatment.
For cows in the FY treatment, the quantity of concentrate consumed by the cows influenced the TDMI of each MY sub-group. In contrast, concentrate was not allocated according to MP on the FR treatment and as a result TDMI and energy intake were similar between MP sub-groups. It was expected that the HMP-FR cows would consume more than the LMP-FR cows. However, the similarity in TDMI between MP sub-groups on the FR treatment is perhaps a reflection of the similarity in mean BW between LMP-FR, MMP-FR and HMP-FR because cow intake capacity is a function of BW (Kertz et al., Reference Kertz, Reutzel and Thomson1991; NRC, 2001; Fuentes-Pila et al., Reference Fuentes-Pila, Ibañez, De Miguel and Beede2003). Veerkamp et al. (Reference Veerkamp, Simm and Oldham1994) found no effect of genetic merit on DMI when concentrates were allocated to groups differing in merit for MP, due to the similarity in BW between groups. As a result of the similarity in TDMI and diet composition in the present experiment, cows on the FR treatment had similar energy intakes between MP sub-groups. In contrast the net energy intake on the FY treatment varied with the quantity of concentrate consumed by HMP, MMP and LMP cows due to differences in TDMI between the MP sub-groups. The relatively high proportion of NDF in the base diet may also contribute to limited forage intake as NDF is associated with the fill value of a feed (Jarrige, Reference Jarrige1989). By adding additional concentrate, the energy density of the diet was increased, which resulted in increased energy intake.
There was no difference in base diet DMI between MP sub-groups on either the FR or FY treatments. The composition of the base diet was unchanged between MP sub-groups, and both the grass silage and maize silage, which were included in the base diet, were very digestible. Highly digestible forage will support increased MP and reduce the degree of milk yield response to concentrate compared with more poorly digestible forage (Bargo et al., Reference Bargo, Muller, Kolver and Delahoy2003). On the FY treatment, the overall diets for the three MP sub-groups differed in forage to concentrate ratio. The differential in milk yield response to concentrate between the MP sub-groups was compared. For an additional 1.9 kg DM of total concentrate consumed by the HMP-FY cows, MP increased 2.6 kg relative to HMP-FR cows. This milk yield response (1.4 kg milk yield per additional 1.0 kg of concentrate) is larger than that found by Moisey and Leaver (Reference Moisey and Leaver1985) and Ferris et al. (Reference Fitzgerald and Murphy2002) (0.66 and 0.88 kg milk yield/kg DM of concentrate, respectively). In terms of energy use efficiency, the response equates to 0.63 UFL output of milk per 1.05 UFL of concentrate. The reason for the particularly large milk yield response to concentrate in the present experiment may be a result of the curvilinear response to concentrate as outlined in Kellaway and Harrington (Reference Kellaway and Harrington2004). The response to concentrate decreases as the feeding rate of concentrate increases. The large increase in the proportion of concentrate in previous experiments may have given the reduced mean response to concentrate compared with the present experiment. In Moisey and Leaver (Reference Moisey and Leaver1985) the proportion of concentrate was increased from 32% to 56% of TDMI and Ferris et al. (Reference Fitzgerald and Murphy2002) increased concentrate from 24% to 45% of TDMI. In the present experiment the proportion of concentrate increased from 32% of TDMI on HMP-FR to 37% on HMP-FY. When the milk yield response to concentrate was examined on LMP cows in the present study, it was found that increasing the total quantity of concentrate by 1.8 kg DM from the FY to the FR treatment resulted in a 1.4 kg increase in MP. This is less than the response measured in the HMP cows and shows that cows with a greater ability to produce milk will have a larger response to concentrate than cows with less genetic MP potential. A similar trend is presented in the milk potential curves (Figure 1), where HMP cows have a larger potential to produce milk and are further away from reaching their calculated potential MP. This is due to the limit in energy intake; as a result HMP cows have a greater requirement for energy because they have a larger capacity to convert energy intake to milk, than cows with a lower potential milk yield. Cows with a low potential milk yield are closer to reaching their maximum potential milk yield on the present diet; therefore, there are fewer requirements for additional concentrate as the remaining MP capacity is low.
Studies which examined concentrate feeding strategy, previously calculated the milk yield response to concentrate as the difference in mean milk yield between two concentrate feeding rates, irrespective of cow genetic merit (Moisey and Leaver, Reference Moisey and Leaver1985; Ferris et al., Reference Fitzgerald and Murphy2002). The response to concentrate found in the present study was a result of the increase in concentrate feeding rate specifically to HMP.
The degree of negative energy balance was higher for LMP-FY cows than LMP-FR cows due to the reduction in concentrate quantity, and the resulting decrease in TDMI and energy intake. It is likely that the milk yield response to offering additional concentrate to the LMP-FR cows would be low, as cows were estimated to be in positive energy balance, and are close to their predicted milk potential.
There was no measured substitution of forage by concentrate in the present study. The demand for additional energy, was not fully supplied by supplementing forage with concentrate, therefore reducing forage intake with the current quantity of concentrate would further limit total energy intake (Faverdin et al., Reference Faverdin, Baratte, Delagarde and Peyraud1991). Cows in the present study were in negative energy balance, which would have increased the response to concentrate compared to that from cows which consume sufficient energy to meet their requirements (Kellaway and Harrington, Reference Kellaway and Harrington2004). Cows in the HMP sub-group had a similar energy deficit on both the FR and FY treatments. The energy intake of HMP cows was greater on the FY treatment than the FR treatment, but HMP-FY cows also had a greater energy requirement, due to milk yield being greater than that of HMP-FR cows. In studies where increased concentrate allowance resulted in increased energy intake (Ferris et al., Reference Fitzgerald and Murphy2002; Reist et al., Reference Reist, Erdin, Von Euw, Tschuemperlin, Leuenberger, Delavaud, Chilliard, Hammon, Kuenzi and Blum2003) cows on the increased rate of concentrate resumed positive energy balance sooner than those offered low concentrate diets. The HMP cows mobilised more body lipid reserves to sustain MP which has been reported to reduce BCS (Gallo et al., Reference Gallo, Carnier, Cassandro, Mantovani, Bailoni, Contiero and Bittante1996) and increase blood ketone concentrations (Nikkhah et al., Reference Nikkhah, Furedi, Kennedy, Crow and Plaizier2008). Studies have concluded that evidence for this trend may be shown by the concentrations of blood βHBA which is regarded as an indication of fat tissue mobilisation (Macrae et al., Reference Macrae, Whitaker, Burrough, Dowell and Kelly2006; Nikkhah, et al., Reference Nikkhah, Furedi, Kennedy, Crow and Plaizier2008); HMP cows had concentrations of blood βHBA that were significantly higher than other MP sub-groups. As the reduction in BCS was low, it is more likely that it was the increased DMI which led to the greater βHBA. Increased DMI results in increased volatile fatty acid production in the rumen (Nikkhah et al., Reference Nikkhah, Furedi, Kennedy, Crow and Plaizier2008), which increases the transformation of butyrate to βHBA across the rumen wall (Reynolds, Reference Reynolds2002). This may explain why HMP-FY cows, which had the highest TDMI of all treatments, had the highest βHBA concentration. High MP cows also had higher concentrations of blood NEFA than LMP cows, which may be a result of a larger degree of fat mobilisation due to the greater energy deficit of the HMP cows. However, there was no significant difference in BCS change and the concentrations of blood plasma NEFA were within the overall normal range as outlined in Macrae et al. (Reference Macrae, Whitaker, Burrough, Dowell and Kelly2006). There were no significant differences in the concentrations of urea and glucose in blood plasma between MP groups. This indicates that cows in all MP groups were supplied with sufficient dietary protein and carbohydrate throughout the experimental period (NRC, 2001).
The concentrations of milk fat, protein and lactose were unaffected by MP or concentrate feeding strategy. The concentration of NDF (379±17.0 g/kg TDMI) was above the cow requirements in all treatments (NRC, 2001), so no effect of diet on milk fat concentration was expected. The results agree with those of Agnew et al. (Reference Agnew, Mayne and Doherty1996) who found no significant difference in milk protein or fat concentrations between diets which had concentrate proportions of 28% and 38% of TDMI. Therefore, the reduction in milk fat and protein yield from the HMP to the MMP and from the MMP to the LMP sub-groups are largely due to the reduction in milk yield as a result of both the MP sub-grouping and the reduced concentrate rate.
Conclusion
In this study the quantity of concentrate influenced net energy intake, and as a result MP was greater from cows with a larger MP potential. Cows with a reduced potential for MP are less responsive to additional energy input. Therefore, the potential of a cow to produce milk is limited not only by her genetic potential but also by the plane of nutrition which is offered. The correct plane of nutrition should be set based on the genetic potential of all cows in the herd, not only the highest yielding cows, as there is low response to additional concentrate fed to cows with low potential milk yield.
Acknowledgements
The authors gratefully appreciate the inputs of Mr J. P. Murphy and the Moorepark farm staff for their technical assistance and care of the experimental cows during the study. The authors also wish to acknowledge the inputs of Dr Luc Delaby during the design of the experiment, and Dr Donagh Berry and Dr Jim Grant for guidance with the statistical analysis.