





1 Introduction
Many planetary bodies in our solar system consist of a solid inner and a liquid outer core, surrounded by a solid shell. Planets, like the Earth, Mercury, Jupiter and Saturn, as well as the Earth’s moon and the Galilean moons of Jupiter consist of such a spherical-shell geometry (see e.g. Spohn Reference Spohn and Schubert2007). One particular property of planetary cores is that they show differential rotation. Hence the inner core and outer shell rotate constantly but at different speeds. The Earth’s inner core, for instance, rotates slightly faster than the Earth mantle (
 $0.2^{\circ }{-}0.5^{\circ }$
per year) and hence shows a slight super-rotation. This happens due to a strong gravitational coupling between mantle and inner core where small fluctuations of the mantle momentum have a strong impact on the inner core’s rotation (Aldridge & Lumb Reference Aldridge and Lumb1987; Rieutord Reference Rieutord1995). Recent review articles about fluid motions in spheres, spherical gaps and spheroids are Le Bars, Cébron & Le Gal (Reference Le Bars, Cébron and Le Gal2015) and Le Bars (Reference Le Bars2016) and a recent book is Zhang & Liao (Reference Zhang and Liao2017).
Consider a fluid-filled rapidly rotating spherical gap where the inner sphere rotates at
 $\unicode[STIX]{x1D6FA}_{i}$
and the outer at
 $\unicode[STIX]{x1D6FA}_{o}$
, with
 $\unicode[STIX]{x1D6FA}_{i}\neq \unicode[STIX]{x1D6FA}_{o}$
and the Rossby number
 $|Ro|=|(\unicode[STIX]{x1D6FA}_{i}-\unicode[STIX]{x1D6FA}_{o})/\unicode[STIX]{x1D6FA}_{o}|\ll 1$
. Proudman (Reference Proudman1956) found that a vertical cylinder, aligned tangentially at the inner sphere’s equator (
 $r=r_{i}$
), named the tangent cylinder (
 ${\mathcal{T}}{\mathcal{C}}$
), divides the flow into two areas with different characteristics. Outside the
 ${\mathcal{T}}{\mathcal{C}}$
, the fluid rotates nearly in solid-body rotation with the outer shell
 $\unicode[STIX]{x1D6FA}_{o}$
. Inside the
 ${\mathcal{T}}{\mathcal{C}}$
, the fluid rotates almost rigidly at
 $\unicode[STIX]{x1D6FA}=(\unicode[STIX]{x1D6FA}_{i}+\unicode[STIX]{x1D6FA}_{o})/2$
and the fluid’s angular velocity does not vary much except of course close to the
 ${\mathcal{T}}{\mathcal{C}}$
, i.e. for our experiment with a fixed radius ratio
 $\unicode[STIX]{x1D702}=r_{i}/r_{o}=1/3$
at
 $r=r_{i}$
.
Around the
 ${\mathcal{T}}{\mathcal{C}}$
, a vertical detached shear layer, called the Stewartson layer, arises (after Stewartson Reference Stewartson1966), to compensate the angular-velocity differences. Stewartson (Reference Stewartson1966) was the first to determine that the layer’s general structure can be split into three different layers. The outer-layer thickness is
 $E^{1/4}$
for
 $r>r_{i}$
and
 $E^{2/7}$
for
 $r<r_{i}$
and the inner-layer thickness is
 $E^{1/3}$
, where
 $E=\unicode[STIX]{x1D708}/(\unicode[STIX]{x1D6FA}_{o}\,d^{2})$
is the Ekman number,
 $\unicode[STIX]{x1D708}$
the kinematic viscosity of the fluid and
 $d$
the gap width. An Ekman boundary layer with thickness proportional to
 $E^{1/2}$
arises around the inner sphere. At the equator, the Ekman layer becomes vertical. In this region, its scaling breaks down and is replaced by
 $E^{2/5}$
with a singularity at the equator. The width of this region scales with
 $E^{1/5}$
(see Marcotte, Dormy & Soward (Reference Marcotte, Dormy and Soward2016) for a recent review on the equatorial Ekman layer). This process is called equatorial degeneracy (Stewartson Reference Stewartson1966). In real systems with finite viscosity, the singularity at the equator will be transferred to a vertical Stewartson shear layer with frequency
 $\hat{\unicode[STIX]{x1D714}}=0$
, where
 $\hat{\unicode[STIX]{x1D714}}=\unicode[STIX]{x1D714}/\unicode[STIX]{x1D6FA}_{o}$
is the scaled non-dimensional frequency. In a sense, Stewartson-layer formation is similar to the excitation of inertial-wave shear layers at critical points at the inner or outer boundary of the spherical shell (see e.g. Kerswell Reference Kerswell1995). For the stationary case with
 $\hat{\unicode[STIX]{x1D714}}=0$
, this process might also be seen as a consequence of the Taylor–Proudman theorem (Greenspan Reference Greenspan1968).
Since the width of the inner Stewartson layer scales with
 $E^{1/3}$
, the radial gradients of the velocity become strong for small Ekman numbers or for large differential rotation. This shear can eventually destabilise the flow due to a classical shear instability (Busse Reference Busse1968a
; Schaeffer & Cardin Reference Schaeffer and Cardin2005a
; Le Bars et al.
Reference Le Bars, Cébron and Le Gal2015). Usually, the instability is a type of Kelvin–Helmholtz instability. That means, once a critical shear is reached, e.g. when the differential rotation exceeds a certain threshold, the Stewartson layer becomes unstable. Such shear flow instabilities are of general geophysical interest.
Laboratory experiments on Stewartson-layer instabilities have previously been performed in cylindrical cavities by Hide & Titman (Reference Hide and Titman1967), who used a differentially rotating disk at half-height of the tank, and Früh & Read (Reference Früh and Read1999), who used differentially rotating disks in the top and bottom lids to excite Stewartson layers. In case of super-rotation, where the disks are rotating faster than the cylinder, both experiments exhibit an increasing azimuthal wavenumber
 $m$
of the unstable modes with decreasing Ekman number. Früh & Read (Reference Früh and Read1999) found the same for subrotation. In contrast, Hide & Titman (Reference Hide and Titman1967) reported a ‘mysterious’
 $m=1$
mode that is nearly independent of
 $E$
.
Hollerbach (Reference Hollerbach2003) presented numerical simulations on the Stewartson-layer instability for a spherical rather than cylindrical geometry. Based on a rapidly rotating spherical gap with imposed small differential rotation on the inner sphere, Hollerbach (Reference Hollerbach2003) systematically analysed the wavenumber of the instabilities depending on the sign of
 $Ro$
. He found a strong asymmetry between the cases for
 $Ro<0$
and
 $Ro>0$
and suggested that the discontinuity in potential vorticity at
 $r=r_{i}$
is responsible for the differences between positive and negative
 $Ro$
.
Based on the findings by Hollerbach (Reference Hollerbach2003), Schaeffer & Cardin (Reference Schaeffer and Cardin2005a
,Reference Schaeffer and Cardin
b
) developed a quasi-geostrophic (QG) model to analyse so-called Rossby-wave instabilities of the Stewartson layer. They introduced a
 $\unicode[STIX]{x1D6FD}$
parameter, which depends on the change of fluid depth measured in the direction of the radius
 $r$
. For the spherical-shell geometry,
 $\unicode[STIX]{x1D6FD}$
is not a continuous function of
 $r$
but is positive for
 $r<r_{i}$
and negative for
 $r\geqslant r_{i}$
. Hence
 $\unicode[STIX]{x1D6FD}$
has a singularity at
 $r=r_{i}$
. Such singularities were found to have a profound impact on the flow (Hide & Titman Reference Hide and Titman1967; Hollerbach Reference Hollerbach2003; Schaeffer & Cardin Reference Schaeffer and Cardin2005a
; Aguiar & Read Reference Aguiar and Read2006). Due to the opposite signs of
 $\unicode[STIX]{x1D6FD}$
in- and outside of the tangent cylinder, Schaeffer and Cardin suggested that the instabilities travel in opposite directions inside and outside the tangent cylinder. For
 $Ro>0$
the instabilities trigger prograde propagating modes localised outside the tangent cylinder in regions where
 $|\unicode[STIX]{x1D6FD}|$
is small. In contrast, inside the tangent cylinder the instability seems to have a different origin and trapped modes form according to the numerical findings by Hollerbach (Reference Hollerbach2003). In order to get a deeper insight into the effects of the jump in fluid depth discussed by the previous authors, Aguiar & Read (Reference Aguiar and Read2006) modified the experimental set-up by Früh & Read (Reference Früh and Read1999) including an inner part of the upper disk that could be lowered or raised relative to the outer part in an overall flat cylindrical container (see their figure 1). In general they could confirm the strong asymmetry between the flows for positive and negative
 $Ro$
and they found a spiral structure similar to the one reported earlier by Schaeffer & Cardin (Reference Schaeffer and Cardin2005a
).
Most recently, Wicht (Reference Wicht2014) numerically explored several forms of instabilities and flow regimes in a differentially rotating spherical gap depending on the rotation rate
 $\unicode[STIX]{x1D6FA}$
, the magnitude of differential rotation, as well as the sign of
 $Ro$
. In the fast-rotation regime, where Coriolis forces become strong, the Stewartson layer was the main source of instabilities. In accordance with the numerical results by Hollerbach (Reference Hollerbach2003) and the experimental finding that will be reported here, Wicht (Reference Wicht2014) found strong differences in the azimuthal wavenumber between positive and negative
 $Ro$
. As already pointed out by Hollerbach (Reference Hollerbach2003), for
 $Ro<0$
, the modes are characterised by nearly
 $z$
-invariant columnar patterns with a balance between pressure gradient force and Coriolis force resulting in a slow drift. They were labelled Rossby modes.
Over the last decade a number of studies on inertial-wave generation in spherical Couette experiments have been published and we emphasise here the results deduced from the large experiments at the University of Maryland. Kelley et al. (Reference Kelley, Triana, Zimmerman, Tilgner and Lathrop2007) and Kelley et al. (Reference Kelley, Triana, Zimmerman and Lathrop2010) focused on the selection of particular inertial modes and the role of critical layers in this selection process. Spectrograms have been shown and, although somewhat blurred, asymmetries between positive and negative
 $Ro$
have been detected but were not further studied. Rieutord et al. (Reference Rieutord, Triana, Zimmerman and Lathrop2012) show more details of the inertial wave spectra but only for negative
 $Ro$
. However, in these papers the main issues we focus on in the present study have not been discussed. One is the dominance of fast inertial modes over slow geostrophic Rossby modes and why the latter occur only for negative
 $Ro$
. Also still unclear is why axially antisymmetric modes dominate although the driving and the instabilities are symmetric with respect to the equator. To shed more light on these observations is the goal of the present study.
Koch et al. (Reference Koch, Harlander, Egbers and Hollerbach2013) and Hoff, Harlander & Egbers (Reference Hoff, Harlander and Egbers2016a
) studied inertial-wave excitation under libration and hence for oscillating
 $Ro$
. Typical features for
 $Ro>0$
(spirals) and
 $Ro<0$
(waves trapped at the Stewartson layer) could be observed, however, in that case the modes have a strong transient character. An experimental study closer to the present one was performed by Hoff, Harlander & Triana (Reference Hoff, Harlander and Triana2016b
) but focused on the stability of inertial modes. This experiment revealed that for a critical
 $Ro$
a strong amplification of the most dominant inertial mode occurs, leading to a transition into small-scale disorder and secondary instabilities. Later, these findings were verified numerically (Barik et al.
Reference Barik, Triana, Hoff and Wicht2018). However, the study was done only for negative
 $Ro$
and the asymmetry of the mode excitation for positive and negative
 $Ro$
was not discussed.
The goal of the present paper is therefore to experimentally verify the numerical results by Hollerbach (Reference Hollerbach2003) and Wicht (Reference Wicht2014) on the strong asymmetry between the flow for the two cases with
 $Ro>0$
and
 $Ro<0$
. Although a number of theoretical explanations for the differences exist and experiments have been done in a cylindrical geometry, an experimental proof for the strong dependency of the mode excitation on the sign of
 $Ro$
for a spherical-shell geometry has been lacking until today. It should be noted that this asymmetry strongly depends on the radius ratio of the shell, which is
 $1/3$
in our case. Hollerbach (Reference Hollerbach2003) showed that the asymmetry cannot be found for a full sphere and a shell with radius ratio
 $4/5$
. It seems that the asymmetry is pronounced if there is a large jump in fluid depth across the tangent cylinder. In our experiment, for technical reasons, we do not vary the radius ratio but keep the value
 $1/3$
fix. The justification is that for this ratio we can expect to find a strong asymmetry which is ultimately the goal of the experimental study.
The paper is organised as follows. In § 2 we briefly describe the experimental set-up and parameters. In § 2 we discuss the mean structure of the Stewartson layer and the route to instability for larger magnitudes of
 $Ro$
, the scaling of critical
 $Ro$
with the Ekman number, the spatial patterns as a function of the sign of
 $Ro$
and the interaction of the inertial modes with the mean flow. Finally, in § 4, concluding remarks are given.
2 Experimental set-up and data processing
2.1 Experimental set-up
The experimental apparatus (figure 1) consists of two independently rotating concentric spheres with inner radius
 $r_{i}=(40\pm 0.05)~\text{mm}$
, outer radius
 $r_{o}=(120\pm 0.05)~\text{mm}$
and a corresponding gap width of
 $d=(80\pm 0.1)~\text{mm}$
. From this follows a radius ratio of
 $\unicode[STIX]{x1D702}=1/3$
that is similar to that of the Earth’s inner and outer cores
 $\unicode[STIX]{x1D702}_{core}=0.35$
(Spohn Reference Spohn and Schubert2007). The inner sphere is made of black anodised aluminium suspended on a shaft of 14 mm diameter while the outer sphere is made of acrylic glass with full optical access except at the equator where the two hemispheres are connected. We used a silicone oil with viscosity
 $\unicode[STIX]{x1D708}_{kin}=0.65~\text{mm}^{2}~\text{s}^{-1}$
(
 $\pm 10\,\%$
tolerance) as working fluid in the gap. To avoid optical distortions and keep the surrounding temperature uniform, the shell is immersed into a cubic tank (
 $60~\text{cm}\times 60~\text{cm}\times 60~\text{cm}$
) of de-ionised water (refraction indices:
 $n_{oil}=1.375$
and
 $n_{water}=1.337$
for 532 nm). Since the refraction indices of water and oil are similar, the curvature of the outer shell will not affect the path of the light and visualisations are hence not much affected by optical distortions. Ideally, the surrounding medium should be identical to the working fluid, however, water is a factor of 100 cheaper than the silicone oil used. A refraction-index difference of
 ${\sim}3\,\%$
provides almost distortion-free optical measurements of the flow in the spherical gap. The outer- and inner-sphere rotation is denoted by
 $\unicode[STIX]{x1D6FA}_{o}$
and
 $\unicode[STIX]{x1D6FA}_{i}$
, respectively. By using
 $U=(\unicode[STIX]{x1D6FA}_{i}-\unicode[STIX]{x1D6FA}_{o})\,d$
as velocity scale, the gap width
 $d$
as length scale and
 $\unicode[STIX]{x1D6FA}=\unicode[STIX]{x1D6FA}_{o}$
as the scale for the angular velocity, a characteristic Rossby number of
 $Ro=U/(\unicode[STIX]{x1D6FA}d)=(\unicode[STIX]{x1D6FA}_{i}-\unicode[STIX]{x1D6FA}_{o})/\unicode[STIX]{x1D6FA}_{o}$
can be defined. The Ekman number
 $E=\unicode[STIX]{x1D708}_{kin}/(\unicode[STIX]{x1D6FA}_{o}d^{2})$
measures the ratio of viscosity and Coriolis forces. With our apparatus, the lower limit for
 $E$
is
 $1.52\times 10^{-5}$
. For the rest of the paper, the following additional notations are used:
 $r$
is the cylindrical radius aligned horizontally,
 $\unicode[STIX]{x1D719}$
the azimuthal angle and
 $\unicode[STIX]{x1D714}$
(
 $\hat{\unicode[STIX]{x1D714}}$
) is the (scaled) frequency of the inertial modes.
(a) Experimental apparatus. (b) Sketch of the spherical gap including the PIV measuring set-up. The outer sphere is rotating counter-clockwise with constant speed (as seen from top) around a vertical axis. The inner-sphere rotation is variable. The tangent cylinder is marked by the
 ${\mathcal{T}}{\mathcal{C}}$
. The general flow direction in the laboratory frame of reference is marked by the thick curved arrow. The laser light sheet is fixed in the laboratory frame of reference while the camera (GoPro Hero 4+) is rotating at
 $\unicode[STIX]{x1D6FA}_{o}$
. The height of the laser plane is
 $h=4~\text{cm}$
above the equator for all horizontal measurements.

For visualisation in the meridional plane, the flow was seeded by Kalliroscope tracer particles and illuminated using a vertical laser light sheet. Kalliroscope tracers are plates of glimmer flakes (
 ${\approx}60\,\%$
) coated with titanium dioxide (
 ${\approx}40\,\%$
) and have a typical size range of 4–
 $32~\unicode[STIX]{x03BC}\text{m}$
. This enables a high reflectivity for laser based measurement techniques. Because of their plate-like shape, they are aligned in the shear flow, showing bright and dark regions of reflection to the observer’s view. A camera recorded these reflections in the laboratory frame perpendicular to the meridional laser sheet. In contrast, the flow in the horizontal plane has been studied quantitatively with particle image velocimetry (PIV). Spherical hollow glass spheres have been used as tracer particles. A GoPro Hero 4 camera, enabling wireless high-resolution recordings, observed the motion in the frame at rest with the outer shell. With the present set-up, the flow in approximately 40 % of a two-dimensional (2-D) annular domain between the spheres can be observed.
Before the computation of velocity fields in physical units can be done, a reference frame that defines the coordinate system is needed. Since we are measuring in a closed system, that cannot easily be disassembled and assembled, we compromised setting up the reference frame for MatPIV: we defined a coordinate system with six dots and known distance and simulated the actual measurements by dipping the camera into clear water (with a similar refraction index to silicon oil) looking perpendicularly onto the coordinate system from the same distance as in the experiments. These coordinates have then been transferred into the respective image projection matrix required for PIV measurements. Here, we use a 2-D horizontal plane and a perpendicular aligned camera to avoid in-plane camera distortions.
Note that we did not observe the flow in the meridional and horizontal planes simultaneously but did the measurements consecutively.
2.2 Data and data processing
We recorded particular ramps changing the inner sphere’s rotation while keeping the outer-sphere rotation rates at
 $\unicode[STIX]{x1D6FA}_{o,set}\approx (30,40,50,60)$
r.p.m. Each ramp started in solid-body rotation (
 $Ro=0$
), where we let the apparatus run for approximately 15 min to avoid transient spin-up recirculation. Then, we increased (decreased) the inner sphere’s rotation rate with increments of
 $\unicode[STIX]{x0394}\unicode[STIX]{x1D6FA}_{i}=\pm 1$
r.p.m. until a Rossby number of approximately
 $Ro\approx \pm 0.5$
is reached. The covered parameter space in
 $\unicode[STIX]{x1D6FA}$
and
 $Ro$
is depicted in figure 2. Note that the measured actual values of the outer-sphere rotation rates and the setpoints in the LabView software are connected via
 $\unicode[STIX]{x1D6FA}_{o,actual}=1.0623\,\unicode[STIX]{x1D6FA}_{o,set}$
, as obtained from the calibration of the outer-sphere rotation rate. In figure 2 we use the actual values. For convenience, we write
 $\unicode[STIX]{x1D6FA}_{o}$
for
 $\unicode[STIX]{x1D6FA}_{o,set}$
, however, whenever we perform the calculation with the rotation rate, we use
 $\unicode[STIX]{x1D6FA}_{o,actual}$
.
Parameter space of the experimental parameters for the Stewartson-layer instabilities; outer- and inner-sphere rotation as a function of
 $\unicode[STIX]{x1D6FA}$
(a) and the Rossby number as a function of the inner-sphere rotation (b). The experimental ramps started in solid-body rotation (
 $Ro=0$
).

At each particular step, we waited 5 min to ensure an equilibrium state. Note that the spin-up time from rest (
 ${\sim}E^{-1/2}\unicode[STIX]{x1D6FA}_{o}^{-1}$
) is of the order of 1–2 min. In the horizontal plane we recorded the flow, seeded with PIV tracers, for 5 min at
 $h=4$
cm above the equator. Due to a fast discharging of the camera batteries, we were not able to record the full ramps for
 $\unicode[STIX]{x1D6FA}_{o}\approx (50,60)~\text{r.p.m.}$
without interruptions. That is, the motors needed to be stopped and the batteries of the camera recharged. After that, the ramp was started again in solid-body rotation (
 $Ro=0$
), followed by slowly increasing (decreasing)
 $Ro$
until the point where the measurement was interrupted. Note that we also recorded the flow development in the meridional plane using Kalliroscope tracers to qualitatively obtain a 3-D impression of the shear flow.
The movies of the horizontal plane have been converted into grey scale images and analysed by using the Matlab toolbox MatPIV v.1.6.1 (Sveen Reference Sveen2004). For the present purpose, a spatial resolution of
 $1920\times 1080$
pixels was sufficient to obtain reliable velocity fields. For
 $\unicode[STIX]{x1D6FA}_{o}\approx (30,40,50)~\text{r.p.m.}$
a frame rate of 24 fps and for
 $\unicode[STIX]{x1D6FA}_{o}\approx 60~\text{r.p.m.}$
a frame rate of 30 fps have been used. We applied three interrogation steps from
 $128\times 128$
to
 $64\times 64$
to a final window size of
 $32\times 32$
with an overlap of 0.5. A signal-to-noise filter, a peak height filter and a global filter that removes vectors significantly larger or smaller than the majority of the vectors, have further been applied (see Sveen & Cowen Reference Sveen, Cowen, Grue and Liu2004, for further details). A Fourier analysis was applied to the velocity components
 $(u,v)$
to detect the dominant frequencies
 $f$
of the flow. For these frequencies, the corresponding flow patterns have been reconstructed by a harmonic analysis, i.e. at each grid point the measured time series
 $u(t_{n})$
,
 $v(t_{n})$
(
 $n=1,2,\ldots ,N$
,
 $N$
being the length of the measurements) has been written as
 $u(t_{n})\approx \bar{u}+A\cos (2\unicode[STIX]{x03C0}ft_{n})+B\sin (2\unicode[STIX]{x03C0}ft_{n})$
, where the coefficients
 $A$
and
 $B$
(and hence the amplitude and phase of the signal) are determined by the least-square method. The harmonic analysis is a robust signal-demodulation technique in which the user specifies wave frequencies to be analysed to find the unknown amplitudes and phases of the waves. Having the amplitude and phase at each grid point, the velocity field containing just the desired frequency can be reconstructed (for more details and formulas, see e.g. Emery & Thomson Reference Emery and Thomson2001, chap. 5.5).
3 Results
3.1 The structure of the Stewartson layer
Before discussing the Stewartson-layer instabilities, we will first examine the structure of the Stewartson layer itself. Figure 3 shows Kalliroscope visualisations in the meridional plane for
 $\unicode[STIX]{x1D6FA}_{o}\approx 40~\text{r.p.m.}$
(
 $E=\unicode[STIX]{x1D708}/(\unicode[STIX]{x1D6FA}_{o}d^{2})=2.28\times 10^{-5}$
). All images represent a time average over 30 s and are located in the stable regime, without Stewartson-layer instabilities. From left to right,
 $|Ro|$
increases. Panels (a–d) show the flow for
 $Ro<0$
and panels (e–h) for
 $Ro>0$
. It can be seen that the Stewartson layer, i.e. the vertical ‘line’ tangential to the inner sphere’s equator, appears already close to solid-body rotation and becomes more prominent with increasing
 $|Ro|$
. In case of
 $Ro<0$
, the Stewartson layer is mainly separated into three parts; a dark region in the centre surrounded by a bright region of reflection on either side. This seems to confirm previous studies done by Proudman (Reference Proudman1956), Stewartson (Reference Stewartson1966) and Hollerbach (Reference Hollerbach2003). However, it is not trivial to identify the width of nested layers from these visualisations since we could not find any objective criterion to identify the edges of the respective region. In contrast to
 $Ro<0$
, the
 $Ro>0$
case looks different. In the image at the left-most position, the Stewartson-layer excitation starts close to the equatorial region in a form reminiscent of a ‘candle flame’. As
 $Ro$
increases, this pattern spreads along the vertical axis of the
 ${\mathcal{T}}{\mathcal{C}}$
. For moderate
 $Ro$
(image at right-most position), the structure of the Stewartson layer looks much more complex than for
 $Ro<0$
. Note that we observed very similar patterns also for the other rotation rates.
Kalliroscope visualisations in the meridional plane for
 $\unicode[STIX]{x1D6FA}_{o}=40~\text{r.p.m.}$
Panels (a–d) from left to right:
 $Ro=-(0.027,0.051,0.074,0.098)$
. Panels (e–h) from left to right:
 $Ro=(0.020,0.044,0.067,0.091)$
. The images show a 30 s time average.

The azimuthally and time-averaged radial profiles of the azimuthal velocity,
 $v_{\unicode[STIX]{x1D719}}$
, inside and around the Stewartson layer, and the corresponding relative vorticity field in the horizontal plane (4 cm above the equator) are shown in figure 4. Panels (a,b) correspond to a negative Rossby number of
 $Ro\approx -0.1$
and panels (c,d) to a positive Rossby number of
 $Ro\approx 0.09$
. Note that the measurements have been done in proximity to the inner sphere’s boundary so that the velocity profiles (especially for
 $r/r_{o}<1/3$
) might differ from theoretically expected profiles (e.g. Proudman Reference Proudman1956; Hollerbach Reference Hollerbach2003; Schaeffer & Cardin Reference Schaeffer and Cardin2005a
). At approximately
 $r=4~\text{cm}$
, a well-developed azimuthally symmetric Stewartson layer occurs around the
 ${\mathcal{T}}{\mathcal{C}}$
. The velocity outside the
 ${\mathcal{T}}{\mathcal{C}}$
is almost zero (i.e. in solid-body rotation with the outer shell). Following Proudman (Reference Proudman1956), we expect an angular velocity of
 $(\unicode[STIX]{x1D6FA}_{i}-\unicode[STIX]{x1D6FA}_{o})/2\approx 0.157~\text{rad}~\text{s}^{-1}$
inside the
 ${\mathcal{T}}{\mathcal{C}}$
for the Rossby numbers in figure 4. For example in figure 4(a,c) at
 $r=3~\text{cm}$
, which is inside the
 ${\mathcal{T}}{\mathcal{C}}$
, we find a velocity of
 $\overline{v}_{\unicode[STIX]{x1D719}}\approx 4~\text{mm}~\text{s}^{-1}$
. This corresponds to an angular velocity of
 $0.133~\text{rad}~\text{s}^{-1}$
, showing a deviation of approximately 15 % from the theoretical value. However, in view of an error of approximately 10 %, the mismatch between the theoretical and measured Stewartson-layer velocity profiles lies within the error range. For estimating the error we did a simple solid-body rotation experiment and measured the velocity profile by PIV. There we found deviations from the theoretical profile of the order of 10 %. This error is due to the used set-up, i.e. remaining optical distortions and reflections but also the usual PIV pixel errors. Note that Proudman’s approximation of the velocity profile is only valid for
 $|Ro|\ll 1$
, which is not strictly true for the examples shown.
(a,b) Azimuthally and time-averaged radial profile of the azimuthal velocity,
 $\overline{v}_{\unicode[STIX]{x1D719}}$
, in
 $\text{mm}~\text{s}^{-1}$
(a) for
 $\unicode[STIX]{x1D6FA}_{o}=30~\text{r.p.m.}$
and
 $Ro\approx -0.1$
and the corresponding relative vorticity field (b). (c,d) The same as (a,b) but for
 $Ro\approx 0.09$
. For (a,c), negative velocity represents retrograde and positive velocity prograde motion. The height of the horizontal plane is at
 $h=4~\text{cm}$
above the equator.
 $x$
and
 $y$
are the 2-D Cartesian coordinates of the original field of view, while
 $r=\sqrt{x^{2}+y^{2}}$
(see figure 1
b).

Regarding the relative vorticity profiles, we see a sign reversal for
 $Ro<0$
and
 $Ro>0$
, respectively, which is due to the different flow directions. The sign of vorticity is opposite inside and outside the
 ${\mathcal{T}}{\mathcal{C}}$
, while the root seems to be situated directly on the
 ${\mathcal{T}}{\mathcal{C}}$
. This is the case for all analysed data sets as long as
 $Ro$
is small. Figure 4 should be compared with figure 3 by Hollerbach (Reference Hollerbach2003). It should be noted that the plane considered by Hollerbach (Reference Hollerbach2003) is at the half-distance between the pole of the inner and the outer spheres whereas in our case it touches the pole of the inner sphere and is hence partly within the Ekman layer. This might explain why we see a somewhat more gentle slope in the radial velocity profile when crossing the tangent cylinder.
Next we address the question of the dependency of the Stewartson-layer structure on the Ekman and Rossby numbers. Figure 5 shows azimuthally averaged radial profiles of the azimuthal time mean flow,
 $\overline{v}_{\unicode[STIX]{x1D719}}$
, for different Ekman and Rossby numbers. In (a)
 $Ro\approx \pm 0.1$
and in (b)
 $Ro\approx \pm 0.29$
. Positive values mean prograde motion (mainly for
 $Ro>0$
) and negative values mean retrograde motion (mainly for
 $Ro<0$
). The velocity is shown unscaled for the following reasons: starting with the case
 $|Ro|\approx 0.1$
(a) one can clearly see an increasing velocity magnitude with decreasing Ekman number. Using
 $\unicode[STIX]{x1D6FA}_{o}r_{o}$
as the velocity scale and divide by
 $Ro$
to exclude the Rossby number dependency, we found a general tendency that the scaled velocity amplitude around the
 ${\mathcal{T}}{\mathcal{C}}$
becomes independent of
 $E$
(not shown). However, more data need to be analysed to find a definite scaling law. In the case of
 $|Ro|\approx 0.29$
(b) the decrease of velocity outside the
 ${\mathcal{T}}{\mathcal{C}}$
is smoothed. Thus, a smaller amount of fluid in the bulk (
 $r>r_{i}$
) is indeed rotating rigidly. Moreover, no uniform increase of the velocity with decreasing
 $E$
can be noticed. The reason is the appearance of waves, i.e. for
 $|Ro|\approx 0.29$
the flow is no longer stable.
Azimuthally averaged radial profiles of the azimuthal mean flow,
 $\overline{v}_{\unicode[STIX]{x1D719}}$
, for different Ekman numbers for
 $Ro\approx \pm 0.1$
(a) and
 $Ro\approx \pm 0.29$
(b). Positive values mean prograde motion (mainly for
 $Ro>0$
) and negative values mean retrograde motion (mainly for
 $Ro<0$
). The height of the horizontal plane is at
 $h=4~\text{cm}$
above the equator.

Azimuthal mean flow,
 $\overline{v}_{\unicode[STIX]{x1D719}}$
, as a function of the Rossby number for
 $\unicode[STIX]{x1D6FA}_{o}=30~\text{r.p.m.}$
,
 $E=3.04\times 10^{-5}$
(a) and for
 $\unicode[STIX]{x1D6FA}_{o}=60~\text{r.p.m.}$
,
 $E=1.52\times 10^{-5}$
(b). The colours show the velocity magnitude in
 $\text{mm}~\text{s}^{-1}$
, blue means retrograde and red means prograde motion. The height of the horizontal plane is at
 $h=4~\text{cm}$
above the equator. The symbols mark the critical layers of the respective most dominant wave mode.

This observation is supported by figure 6. It shows a contour plot of the azimuthal mean flow,
 $\overline{v}_{\unicode[STIX]{x1D719}}$
, as a function of the Rossby number for
 $\unicode[STIX]{x1D6FA}_{o}\approx 30~\text{r.p.m.}$
,
 $E=3.04\times 10^{-5}$
(a) and for
 $\unicode[STIX]{x1D6FA}_{o}\approx 60~\text{r.p.m.}$
,
 $E=1.52\times 10^{-5}$
(b). First, by comparing the flow for negative and positive Rossby numbers, it is conspicuous that the retrograde flow for the former is smoother than the prograde flow for the latter, i.e. higher fluctuations can be found in the prograde flow. Additionally, the spatial extent of the region with strong flow is larger for positive
 $Ro$
. Second, by comparing panels (a) and (b), the fluctuations become more prominent for increasing Ekman numbers. We will see in the next section that this is due to an increase of wave activity and turbulence. Further, we will see that there is much more wave activity for positive
 $Ro$
than for negative
 $Ro$
. We will also see later that most of the fluctuations in the prograde flow are closely related to wave–mean flow interactions. That is, fluctuations can be enhanced when the wave extracts energy from or restores energy to the mean flow.
Azimuthal velocity spectrogram taken from a ramp where each inner-sphere rotation was kept constant for 10 min (including 5 min spin-up time). (a)
 $\unicode[STIX]{x1D6FA}_{o}\approx 30~\text{r.p.m.}$
and
 $E=3.04\times 10^{-5}$
. (b)
 $\unicode[STIX]{x1D6FA}_{o}\approx 60~\text{r.p.m.}$
and
 $E=1.52\times 10^{-5}$
. The height of the horizontal plane is at
 $h=4~\text{cm}$
above the equator. At each grid point in a radial cross-section, a Fourier transform of the azimuthal velocity,
 $v_{\unicode[STIX]{x1D719}}$
, has been computed, where the velocities are averaged over 5 neighbouring grid points. Each column of the spectrogram shows the average over all obtained single-sided amplitude spectra
 $|X(\hat{\unicode[STIX]{x1D714}})|/n$
, where
 $n$
is the length of the time series. The white bar marks the solid-body rotation where no data are available. The arrows point to the frequencies of the modes with the azimuthal wavenumbers,
 $m$
, where
 $m$
has been estimated by extending the respective filtered single modes from the segment we observe onto the full
 $2\unicode[STIX]{x03C0}$
azimuth (see e.g. figure 9
a).

3.2 Route to Stewartson-layer instability for increasing
 $|Ro|$

After describing the spatial structure of the Stewartson layer in the spherical-gap experiment, the goal of the present section is to better understand the onset of Stewartson-layer instabilities. For this, we discuss amplitude spectra of two experimental ramps shown in figure 2. Figure 7 shows spectrograms of the azimuthal velocity,
 $v_{\unicode[STIX]{x1D719}}$
, for
 $\unicode[STIX]{x1D6FA}_{o}\approx 30~\text{r.p.m.}$
and
 $E=3.04\times 10^{-5}$
(a) and
 $\unicode[STIX]{x1D6FA}_{o}\approx 60~\text{r.p.m.}$
and
 $E=1.52\times 10^{-5}$
(b). The ramps were separately sampled by starting at solid-body rotation (
 $Ro=0$
), followed by a stepwise increase/decrease of
 $\unicode[STIX]{x1D6FA}_{i}$
(see figure 2). The data have been taken in the frame at rest with the outer shell. The spectrograms show the single-sided amplitude spectra as a function of the dimensionless inertial-wave frequency
 $\hat{\unicode[STIX]{x1D714}}=\unicode[STIX]{x1D714}/\unicode[STIX]{x1D6FA}_{o}$
in the range
 $0\leqslant \hat{\unicode[STIX]{x1D714}}\leqslant 1$
versus the Rossby number,
 $Ro$
. For each value of
 $Ro$
, a radius-averaged amplitude spectrum of a five minute time series of the azimuthal velocity,
 $v_{\unicode[STIX]{x1D719}}$
, was computed, where the velocity has been smoothed by averaging over an interval of
 $-0.6~\text{cm}\leqslant x\leqslant +0.6~\text{cm}$
(approximately 10 grid points). On the left-hand side of the white vertical bar the Rossby number is negative (sub-rotation) and on the right-hand side the Rossby number is positive (super-rotation).
Obviously, there are strong differences between positive and negative
 $Ro$
. In general, the background fluctuations for
 $Ro<0$
are lower than that for
 $Ro>0$
. Further, for
 $Ro>0$
a much larger number of prominent peaks emerge with increasing
 $Ro$
, while for
 $Ro<0$
just one dominant peak around
 $\hat{\unicode[STIX]{x1D714}}=0.08$
can be observed. Therefore, the turbulence level for
 $Ro>0$
is much higher than for
 $Ro<0$
implying that a faster rotating inner sphere destabilises the flow more than a slower rotating inner sphere (Wei & Hollerbach Reference Wei and Hollerbach2008). Further, by comparing figures 7 (a) and 7 (b), the amount of small-scale fluctuation increases significantly with decreasing Ekman number.
In case of
 $Ro<0$
, the first instability of the Stewartson layer appears around
 $Ro=-0.25$
(
 $Ro=-0.18$
) at a frequency
 $\hat{\unicode[STIX]{x1D714}}=0.08$
(
 $\hat{\unicode[STIX]{x1D714}}=0.07$
) for
 $\unicode[STIX]{x1D6FA}_{o}=30~\text{r.p.m.}$
(
 $\unicode[STIX]{x1D6FA}_{o}=60~\text{r.p.m.}$
). The peak amplitude of this first instability increases with decreasing
 $Ro$
, while its frequency is nearly independent of
 $Ro$
. For smaller
 $Ro$
, a number of higher harmonics (
 $k\,\hat{\unicode[STIX]{x1D714}}$
, with
 $k=2,3,4,\ldots$
) can be observed, for which the signal amplitude decreases with increasing
 $k$
. This feature is more significant in the case of
 $\unicode[STIX]{x1D6FA}_{o}=60~\text{r.p.m.}$
(figure 7
b). As we will see later, the azimuthal wavenumber of the unstable mode with frequency
 $\hat{\unicode[STIX]{x1D714}}=0.08$
(
 $\hat{\unicode[STIX]{x1D714}}=0.07$
) is always
 $m=1$
. It is axially homogeneous, is nearly geostrophic and follows the Taylor–Proudman theorem (Greenspan Reference Greenspan1968). We found that this mode is fundamental in a sub- or counter-rotating spherical gap, since it persists over a wide range of Rossby numbers,
 $-2.5<Ro<-0.2$
(Hoff et al.
Reference Hoff, Harlander and Triana2016b
). It interacts with other inertial modes of the system, leading to triadic resonances as was discussed by Hoff et al. (Reference Hoff, Harlander and Triana2016b
) and Barik et al. (Reference Barik, Triana, Hoff and Wicht2018). In § 4 we will come back to this mode and will comment on its ‘mysterious’ nature (cf. Hide & Titman Reference Hide and Titman1967; Hollerbach Reference Hollerbach2003).
In case of
 $Ro>0$
, the first (very weak) instability of the Stewartson layer appears around
 $Ro=0.123$
(
 $Ro=0.074$
) at frequency
 $\hat{\unicode[STIX]{x1D714}}=0.127$
(
 $\hat{\unicode[STIX]{x1D714}}=0.102$
) for
 $\unicode[STIX]{x1D6FA}_{o}=30~\text{r.p.m.}$
(
 $\unicode[STIX]{x1D6FA}_{o}=60~\text{r.p.m.}$
). That is, instability sets in for much smaller
 $|Ro|$
than for
 $Ro<0$
. In contrast to
 $Ro<0$
, the peak amplitude and the frequency of the first instability increases with increasing
 $Ro$
. At
 $Ro=0.18$
for
 $\unicode[STIX]{x1D6FA}_{o}=30~\text{r.p.m.}$
, the initial instability vanishes and is replaced by a second mode of instability with a frequency of
 $\hat{\unicode[STIX]{x1D714}}=0.13$
. This second unstable mode also increases in amplitude and frequency with increasing
 $Ro$
and is replaced again by a third mode of instability at
 $Ro=0.34$
with a frequency of
 $\hat{\unicode[STIX]{x1D714}}=0.12$
. This consecutive formation of peak branches could be observed for all measured data in the super-rotational case. For smaller
 $E$
(see figure 7
b), the transitions between the instabilities become somewhat ambiguous, first, since different prominent peaks are overlapping in the Rossby number space and, second, due to the stronger fluctuations. However, it still seems to be true that one mode has to lose dominance before the next one will appear. We will examine later that this feature corresponds to a replacement of smaller-scale waves by larger-scale waves and is in fact connected with changes in the mean flow.
Note that a bifurcation of frequencies seems to take place at
 $Ro\approx 0.35$
and always within the
 $m=3$
instability, nearly independent of the Ekman number. For both branches the corresponding mode patterns exhibit azimuthal wavenumber
 $m=3$
but show differences in the radial structure.
3.3 Scaling law for the Stewartson-layer instability
Scaling laws are useful to validate numerical models, to reduce the number of variables or to compare easily between laboratory and numerical experiments, analytical solutions and the real world.
Concerning the onset of Stewartson-layer instabilities, several laboratory and numerical experiments have been performed in the past decades. Hide & Titman (Reference Hide and Titman1967) excited Stewartson layers in a rotating cylinder with a differentially rotating disk at mid-depth. They determined the critical
 $Ro_{unst}$
as a function of
 $E$
and found
 $Ro_{unst}\propto E^{0.6}$
, interestingly independent of the sign of
 $Ro$
, even if they observed differences in the azimuthal wavenumbers. Früh & Read (Reference Früh and Read1999) performed experiments with the same set-up but with disks integrated in the top and bottom lids. They obtained a
 $Ro_{unst}\propto E^{0.72}$
, again, independent of the sign of
 $Ro$
. Busse’s linear stability analysis (Busse Reference Busse1968b
) predicted a scaling of
 $Ro_{unst}\propto E^{0.75}$
. For the spherical gap, Hollerbach (Reference Hollerbach2003) numerically obtained
 $Ro_{unst}\propto E^{0.45}$
for
 $Ro<0$
and
 $Ro_{unst}\propto E^{0.65}$
for
 $Ro>0$
. With the QG model for a full sphere, Schaeffer & Cardin (Reference Schaeffer and Cardin2005a
) found that the
 $\unicode[STIX]{x1D6FD}$
effect of the increasing/decreasing fluid depth plays an important role in the onset of Stewartson-layer instabilities. They found
 $Ro_{unst}\propto \unicode[STIX]{x1D6FD}E^{0.5}$
. Most recently, Wicht (Reference Wicht2014) performed three-dimensional numerical simulations in a spherical gap and found a scaling that is consistent with that of Hollerbach (Reference Hollerbach2003). All scaling laws are summarised in table 1.
Scaling laws of the first Stewartson-layer instability for the different signs of
 $Ro$
as found in the literature survey. The lower-most row corresponds to the scaling laws that we found in the present experiments. Also given is the range of
 $E$
used to determine the scaling law as well as the aspect ratio
 $\unicode[STIX]{x1D702}=r_{i}/r_{o}$
used. Note that in most studies the latter was fixed and the
 $\unicode[STIX]{x1D6FD}$
dependence was studied by Schaeffer & Cardin (Reference Schaeffer and Cardin2005a
) only. Note that the Rossby number sign dependence of the scaling depends on the geometry (Hollerbach Reference Hollerbach2003).

Figure 8 shows the scaling for the present experiments with a wide spherical gap. The circles mark the critical Rossby numbers,
 $|Ro_{unst}|$
, for negative
 $Ro$
and the crosses mark
 $|Ro_{unst}|$
for positive
 $Ro$
. All
 $Ro_{unst}$
have been extracted from the single amplitude spectra (figure 7 shows the synopsis of all spectra, where gaps are automatically filled by the contour plot so that the onset of instability in those figures exhibit a certain fuzziness not present when a single spectrum is considered). Starting with solid-body rotation, when the first significant peak is observed, the respective mode has been reconstructed by harmonic analysis. If we could detect a clear azimuthal wavenumber,
 $m$
, for the first time, the respective Rossby number marks the onset of the mode’s first instability. It can be seen that the onset of instabilities for
 $Ro<0$
is at larger
 $|Ro|$
compared with
 $Ro>0$
. The dashed lines show a proper possible scaling. For
 $Ro<0$
, we find
 $Ro_{unst}\propto E^{0.55}$
and for
 $Ro>0$
,
 $Ro_{unst}\propto E^{0.7}$
. However, note that due to the finite resolution in Rossby number (
 $\unicode[STIX]{x0394}Ro=1/60$
for
 $\unicode[STIX]{x1D6FA}_{0}=60~\text{r.p.m.}$
,
 $\unicode[STIX]{x0394}Ro=1/30$
for
 $\unicode[STIX]{x1D6FA}_{o}=30~\text{r.p.m.}$
) we cannot exactly determine the critical values
 $Ro_{unst}$
. Nonetheless, the linear fit to the observations for negative Rossby numbers is rather perfect, while there are small deviations for positive Rossby numbers. However, in agreement with the numerical results by Hollerbach (Reference Hollerbach2003) and Wicht (Reference Wicht2014), the scalings are different for the different signs of
 $Ro$
and their scaling exponents match fairly well with our findings (see table 1).
Onset of Stewartson-layer instabilities,
 $|Ro_{unst}|$
, as a function of Ekman number.
 $Ro>0$
is indicated by crosses and
 $Ro<0$
by circles. The black dashed lines denote a scaling fit. The uncertainty coming from the finite resolution of the Rossby number (
 $\unicode[STIX]{x0394}Ro=1~\text{r.p.m.}/\unicode[STIX]{x1D6FA}_{0}$
,
 $\unicode[STIX]{x1D6FA}_{0}=30,40,50,60~\text{r.p.m.}$
) is shown by dashed red curves.

3.4 Patterns of Stewartson-layer instability for
$Ro<0$
and
$Ro>0$


After we discussed spectra and scalings of Stewartson-layer instabilities, we will now focus on their particular spatial characteristics. We distinguish between two classes of patterns: (i) a low-frequency nearly geostrophic mode that occurs for
 $Ro<0$
, i.e. the fundamental
 $m=1$
instability together with its higher harmonics, and (ii) spiral-shaped waves that occur for
 $Ro>0$
. All these waves are referred to as Rossby modes, having particular properties in spherical shells.
3.4.1 Columnar patterns for
$Ro<0$

Two examples of patterns in the sub-rotation case are shown in figure 9. The images are composites and have been constructed in the following way: first, the velocity fields have been filtered by applying the harmonic analysis with the specific frequency taken from the spectrogram (figure 7
b,
 $Ro<0$
part). This gives the spatial pattern of the mode in the segment of the annulus we observe by PIV. To obtain the mode over the full
 $2\unicode[STIX]{x03C0}$
azimuth we do an identification of space and time. This means we construct a space–time diagram and with the knowledge of the period
 $T$
of the camera rotation we find the mode structure covering the full
 $2\unicode[STIX]{x03C0}$
azimuth by identifying the interval on the time axis 0–
 $T$
by the azimuthal angle 0–
 $2\unicode[STIX]{x03C0}$
. Since the mode’s drift speed is much slower than the rotation of the camera and the mode can be seen as ‘frozen’ during the rotation period, the result of this composition technique is very satisfactory.
Stewartson-layer instability patterns for sub-rotation,
 $Ro=-0.33$
, and
 $\unicode[STIX]{x1D6FA}_{o}\approx 60~\text{r.p.m.}$
,
 $E=1.52\times 10^{-5}$
. The height of the horizontal plane is at
 $h=4~\text{cm}$
above the equator.

Figure 9(a) shows the velocity field of the fundamental
 $m=1$
mode. The colours represent the horizontal velocity magnitude. Numerical simulations showed that its structure is nearly geostrophic (Wicht Reference Wicht2014; Barik et al.
Reference Barik, Triana, Hoff and Wicht2018), hence, we see a columnar pattern (hereafter referred to as the ‘
 $m=1$
fundamental Rossby mode’). The axial homogeneity is a direct consequence of the Taylor–Proudman theorem for low-frequency inertial modes (Greenspan Reference Greenspan1968). The mode periodically accelerate and decelerate the azimuthal flow over the entire fluid column. Confirming its fundamental character, Hoff et al. (Reference Hoff, Harlander and Triana2016b
) and Barik et al. (Reference Barik, Triana, Hoff and Wicht2018) showed that this mode persists over a wide Rossby number range and takes part in many nonlinear wave–wave interactions with other inertial modes. As we can also see in the spectrograms (figure 7), it interacts nonlinearly with itself, generating higher harmonics with frequencies
 $m\,\hat{\unicode[STIX]{x1D714}}$
, with azimuthal wavenumbers
 $m=2,3,4,\ldots \,$
. The one for
 $m=2$
is shown figure 9(b).
3.4.2 Spiral-wave patterns for
$Ro>0$

When the inner sphere rotates faster than the outer shell, i.e.
 $Ro>0$
, a second class of patterns related to Stewartson-layer instabilities, so-called spiral Rossby waves (cf. Schaeffer & Cardin Reference Schaeffer and Cardin2005a
,Reference Schaeffer and Cardin
b
), could be observed. Compared to negative
 $Ro$
, this case shows a richer dynamics. In the spherical gap, spiral waves have been observed predominantly in classical spherical Taylor–Couette flow, where only the inner sphere rotates (Egbers & Rath Reference Egbers and Rath1995). On the route to turbulence, different spiral waves could be observed. Egbers & Rath (Reference Egbers and Rath1995) found for low inner-sphere Reynolds numbers,
 $1300\leqslant Re_{i}=r_{i}^{2}\unicode[STIX]{x1D6FA}_{i}/\unicode[STIX]{x1D708}\leqslant 1800$
(
 $E\approx 10^{-3}$
), corresponding to a
 $\unicode[STIX]{x0394}\unicode[STIX]{x1D6FA}$
from 5 to 7 r.p.m. for our set-up, a high-wavenumber first instability. This first instability was consecutively replaced by larger-scale instabilities (lower wavenumbers) as
 $Re$
increases. A similar behaviour was observed by Hollerbach et al. (Reference Hollerbach, Futterer, More and Egbers2004) but again for large Ekman numbers. A respective behaviour can also be found for the case considered here with significantly smaller
 $E$
.
Figure 10 shows three spiral-shaped waves with wavenumbers
 $m=5$
(a),
 $m=4$
(b),
 $m=3$
(c) according to the annotations in figure 7. For reconstruction, the frequencies,
 $\hat{\unicode[STIX]{x1D714}}=(0.127,0.130,0.116)$
, at
 $Ro=(0.12,0.19,0.31)$
have been used, values close to the onset of the respective instability. Each spiral pattern is characterised by well-pronounced spiral arms, which are strongly stretched along the azimuth (large radial wavenumber). The global velocity maximum is found to be inside the tangent cylinder. Another local maximum can be detected close to the outer boundary. Especially for
 $m=4$
and
 $m=3$
, small vortices are embedded between the spiral arms. These vortices are located outside the
 ${\mathcal{T}}{\mathcal{C}}$
, which is consistent with findings by Schaeffer & Cardin (Reference Schaeffer and Cardin2005a
).
Stewartson-layer instability patterns for super-rotation,
 $Ro>0$
, and
 $\unicode[STIX]{x1D6FA}_{o}\approx 30~\text{r.p.m.}$
,
 $E=3.04\times 10^{-5}$
. From (a–c)
 $Ro=0.12$
,
 $Ro=0.19$
,
 $Ro=0.31$
, taken at the onset of the respective mode. The height of the horizontal plane is at
 $h=4~\text{cm}$
above the equator.

As we already noted in § 3.2, the frequency of a certain unstable mode increases with increasing
 $Ro$
until the mode is replaced by another one with a smaller
 $m$
(figure 7). This scenario was already described by Egbers & Rath (Reference Egbers and Rath1995) based on qualitative visualisations. The mode replacement has also been observed by Triana (Reference Triana2011) and Rieutord et al. (Reference Rieutord, Triana, Zimmerman and Lathrop2012) for the case of strong counter-rotating spheres with
 $Ro<-1$
and
 $E=2.5\times 10^{-8}$
, a regime we have not studied here and we actually cannot reach with our experiment. The studies demonstrated that each mode is replaced by a less-damped mode, which is most unstable at the respective Rossby number due to the existence of critical layers. Critical layers are those locations in the spherical gap where the drift speed,
 $\hat{\unicode[STIX]{x1D714}}/m$
, of a particular inertial mode is equal to the angular velocity somewhere in the Stewartson layer. Such critical layers that exist for the spiral waves in our experiments are shown by the symbols in figure 6 (♢ for
 $m=6$
,
 $\times$
for
 $m=5$
,
 $+$
for
 $m=4$
, ▫ for
 $m=3$
). Note that we display only the most unstable modes with the strongest signal in the spectrograms. Obviously, the critical layers are located close to the
 ${\mathcal{T}}{\mathcal{C}}$
, i.e. at
 $r/r_{o}\approx 1/3$
, implying some interference between critical layers and the Stewartson layer.
Nonlinear processes might also explain the bifurcation detected in the spectrograms, see figure 7, at
 $Ro\approx 0.35$
. We found that the frequency of the
 $m=3$
spiral wave splits up into a wave with lower and higher frequency. The former consists of an
 $m=3$
spiral wave as well (not shown), but the spiral arms are much more stretched along the azimuth (larger radial wavenumber), while the latter remains almost unchanged compared to the structure before the bifurcation. According to the ideas on inertial mode excitation by critical layers formulated by Rieutord et al. (Reference Rieutord, Triana, Zimmerman and Lathrop2012), the most unstable mode, obviously corresponding to the higher frequency, dominates the bifurcated state.
Another worthwhile question addresses the evolution of a particular spiral wave when the Rossby number increases. With increasing
 $Ro$
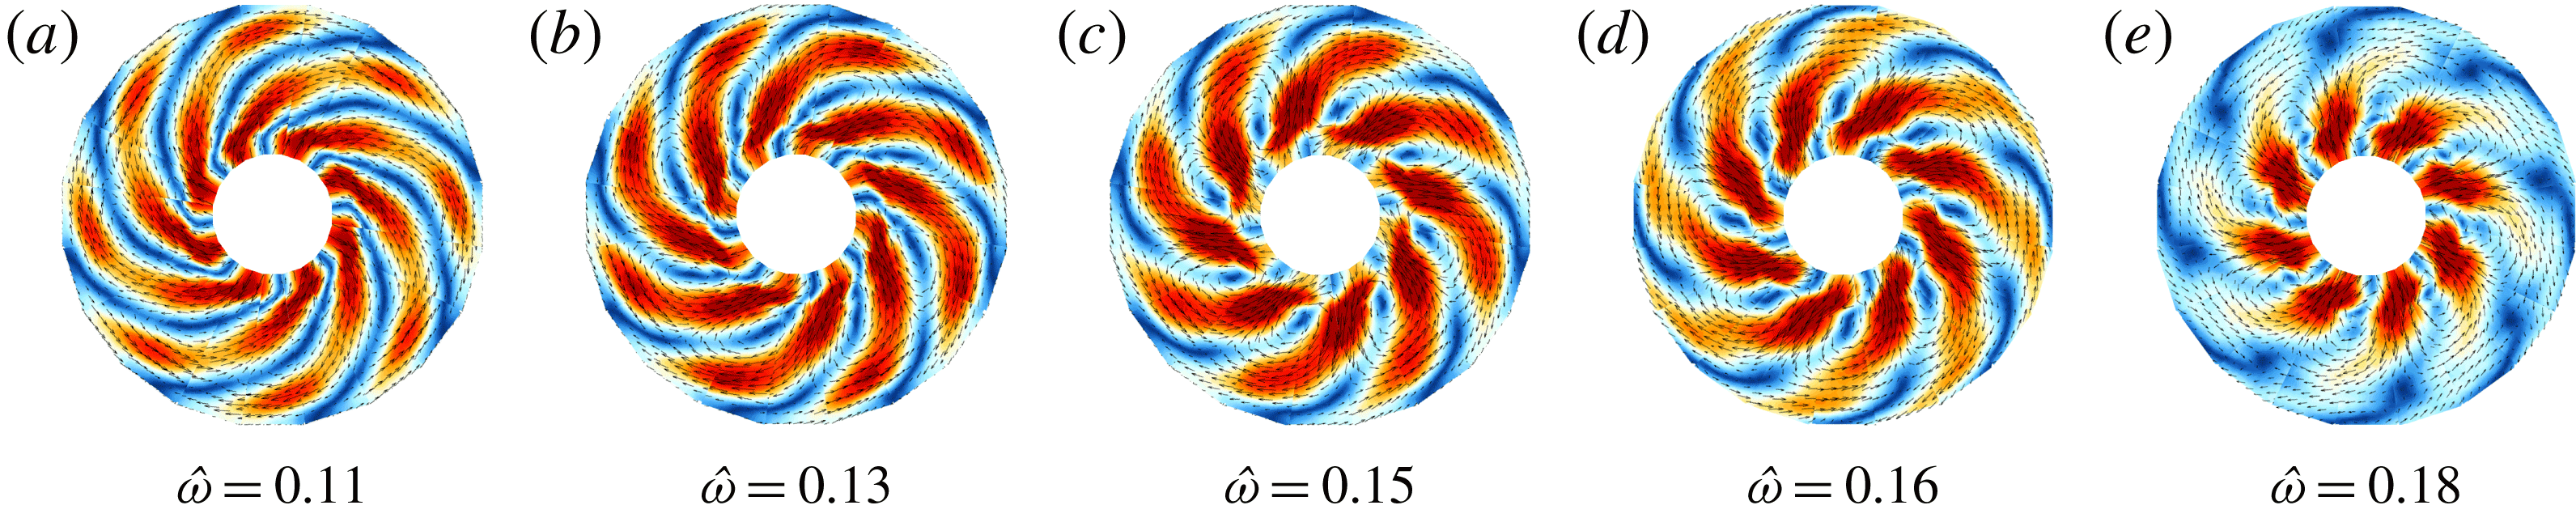
, the modal structure and frequency of the spiral waves changes due to a change in the background flow. Figure 11 depicts five reconstructed patterns taken from the
 $m=4$
branch in figure 7(b) for
 $\unicode[STIX]{x1D6FA}_{o}=60~\text{r.p.m.}$
,
 $E=1.52\times 10^{-5}$
. Over the
 $Ro$
interval of the mode,
 $0.18\leqslant Ro\leqslant 0.31$
, its frequency monotonically increases,
 $\hat{\unicode[STIX]{x1D714}}=(0.11,0.13,0.15,0.16,0.18)$
. Regarding the pattern evolution, figure 11 clearly shows that the structure of the mode changes with increasing
 $Ro$
. In the range where
 $m=4$
is most unstable, the radial wavenumber changes gradually. The tilt of the spiral arms becomes smaller and the velocity maximum concentrates in the inner region around the
 ${\mathcal{T}}{\mathcal{C}}$
. During this ‘raising’ process, the mode’s amplitude grows by approximately 50 %, especially for the first half of the branch, where the change in tilt is the strongest. An explanation for the growth might be that a faster rotating fluid around the
 ${\mathcal{T}}{\mathcal{C}}$
decreases the shear of the wave mode between the inner and outer region and causes a decrease of the azimuthal stretch of the spiral arms. The increasing mean flow further explains the increasing frequency due to Doppler shift (Hoff et al.
Reference Hoff, Harlander and Triana2016b
).
A series of five reconstructed patterns taken from the
 $m=4$
branch in figure 7(b) for
 $\unicode[STIX]{x1D6FA}_{o}=60~\text{r.p.m.}$
,
 $E=1.52\times 10^{-5}$
. From (a–e),
 $Ro=(0.18,0.22,0.25,0.28,0.31)$
and
 $|v|_{max}=(2,2.5,2.3,1.7,1.8)~\text{mm}~\text{s}^{-1}$
. The colours show the absolute value of velocity magnitude (blue – zero, red – max). The colour bar is scaled such that red is saturated in relation to the maximum velocity. The height of the horizontal plane is at
 $h=4~\text{cm}$
above the equator.
3.5 Interactions between mean flow and spiral waves
In the foregoing paragraphs we stated that there are possible interactions between the spiral-wave modes and the mean flow. This implies either that a mode draws energy from the mean flow to grow or wave modes nonlinearly drive the mean flow by momentum transfer. Mean flow suppression takes place for lower Ekman numbers, as was discussed in the context of figure 6. To highlight a possible correlation between wave and mean flow, we will focus on the somewhat simpler case with
 $\unicode[STIX]{x1D6FA}_{o}=30~\text{r.p.m.}$
,
 $E=3.04\times 10^{-5}$
, where a clear gradual mode evolution could be observed (see figure 7
a).
Figure 12 summarises specific elements of figures 6 and 7. It shows the azimuthal velocity,
 $v_{\unicode[STIX]{x1D719},m}$
, in
 $\text{mm}~\text{s}^{-1}$
(blue axis, left) and the frequency,
 $\hat{\unicode[STIX]{x1D714}}_{m}$
(green axis, right) of the respective modes, as a function of the positive Rossby number. The thick black line corresponds to the mean flow at the
 ${\mathcal{T}}{\mathcal{C}}$
,
 $r/r_{o}=1/3$
, and the blue lines correspond to the respective maximum wave amplitude, extracted from the data with the help of harmonic analysis. The dashed vertical lines mark the onset of the respective instability,
 $m=5$
,
 $m=4$
and
 $m=3$
, as was previously discussed. First, we notice a local maximum in the mean flow whenever a new mode is excited, except for the first instability, which is very weak. Second, in the
 $m=3$
region we notice an anti-correlation between the mean flow and the wave amplitudes. This suggests that the waves draw energy from the mean flow which supports the growth. Third, the modes seem to reach a certain maximum saturation in amplitude, followed by a subsequent weakening. Consequently, the mean flow continues growing in the absence of strong wave activity.
Azimuthal velocity,
 $v_{\unicode[STIX]{x1D719},m}$
, in
 $\text{mm}~\text{s}^{-1}$
(blue axis) and the frequency,
 $\hat{\unicode[STIX]{x1D714}}_{m}$
(green axis) of the respective detected modes, as a function of the Rossby number,
 $Ro$
. The thick black line corresponds to the mean flow at the
 ${\mathcal{T}}{\mathcal{C}}$
,
 $r/r_{o}=1/3$
, and the blue lines correspond to the respective wave amplitude, extracted with the help of the harmonic analysis. The dotted vertical lines mark the onsets of the respective instability,
 $m=5$
,
 $m=4$
and
 $m=3$
.

We finally note that the process described above could be observed for all analysed Ekman numbers. However, when the turbulence level increases, i.e. the flow is dominated by strong wave activity, the mean flow experiences nonlinear saturation that seems to be coupled with the fluctuations (compare figure 6(b) with figure 7 a).
4 Discussion and conclusion
In the present paper, we discussed Stewartson-layer instabilities in a differentially rotating spherical shell with a fixed radius ratio of
 $\unicode[STIX]{x1D702}=1/3$
varying the Rossby number in the range
 $Ro\in [-0.5,0.5]$
. In particular we focused on the differences of the Stewartson-layer instabilities in the super-rotational (
 $Ro>0$
) and sub-rotational (
 $Ro<0$
) regime. Although the dependency of the instabilities on the sign of
 $Ro$
have been reported in a number of numerical studies, a true understanding of the differences in sub- and super-rotation instabilities is still missing (Wicht Reference Wicht2014). The experimental results presented here fully confirm the numerical results obtained by Hollerbach (Reference Hollerbach2003) showing that for
 $Ro>0$
a progression to higher azimuthal wavenumbers
 $m$
can be seen as the rotation rate
 $\unicode[STIX]{x1D6FA}_{0}$
increases, but
 $Ro<0$
gives
 $m=1$
over a large range of rotation rates. As numerically predicted by Wicht (Reference Wicht2014), measurements in the meridional plane of the spherical shell showed that the structure for
 $0.5>Ro>0$
are more complex than for
 $-0.5<Ro<0$
. Moreover, the experiments confirmed that the prograde Stewartson layer (
 $Ro>0$
) became unstable at smaller
 $|Ro|$
than the retrograde counterpart.
Two types of instabilities could generally be found, first, more localised (trapped) waves close to the
 ${\mathcal{T}}{\mathcal{C}}$
, and second, spiral-shaped waves filling the whole gap. The former trapped waves always propagate in a retrograde manner, i.e. against the rotation of the outer shell, and occur only for
 $Ro<0$
. The spiral waves always propagate in a prograde manner and occur only for
 $Ro>0$
. The study can be seen as a consecutive addition to previous work, Hoff et al. (Reference Hoff, Harlander and Egbers2016a
), where we studied Stewartson-layer instabilities excited by inner-sphere libration and hence for a time-dependent
 $Ro$
. In this study we found that libration-induced Stewartson-layer instabilities indeed exhibit these
 $Ro$
-dependent features that periodically occur in the libration cycle for
 $Ro<0$
and
 $Ro>0$
.
Schaeffer & Cardin (Reference Schaeffer and Cardin2005a
,Reference Schaeffer and Cardin
b
) allocated both types of patterns to a Rossby-wave instability. Therefore, they suggested the conservation of potential vorticity and the
 $\unicode[STIX]{x1D6FD}$
-effect in a spherical gap as the underlying mechanism for the Stewartson-layer instabilities. The negative (positive) sign of the
 $\unicode[STIX]{x1D6FD}$
-parameter (Schaeffer & Cardin Reference Schaeffer and Cardin2005a
; Hoff et al.
Reference Hoff, Harlander and Egbers2016a
) leads to a prograde (retrograde) drift of the instabilities outside (inside) the tangent cylinder.
Using potential vorticity, Hollerbach (Reference Hollerbach2003) suggested that the discontinuity in potential vorticity at
 $r=r_{i}$
could be the reason, first, for the onset of the trapped waves, and second, for the wavenumber differences between
 $Ro<0$
and
 $Ro>0$
. In case of a spherical gap, perturbations can be amplified while moving away from the Stewartson layer into shallower regions in- and outside of the tangent cylinder. For
 $Ro<0$
it could be shown that all perturbations moving away from the Stewartson layer should be damped and hence must be trapped on the
 ${\mathcal{T}}{\mathcal{C}}$
. In contrast, for
 $Ro>0$
waves can propagate and might be amplified mainly outside the tangent cylinder since there
 $\unicode[STIX]{x1D6FD}$
is smaller (Schaeffer & Cardin Reference Schaeffer and Cardin2005a
). These theoretical findings agree well with the prograde propagating spiral waves we observed for
 $Ro>0$
and the trapped waves we found for
 $Ro<0$
, propagating in a retrograde manner along the
 ${\mathcal{T}}{\mathcal{C}}$
.
It should be noted that the
 $m=1$
fundamental mode for sub-rotation (
 $Ro<0$
) is not strictly trapped along the tangent cylinder and its existence is in fact not fully understood. Several authors (e.g. Hide & Titman Reference Hide and Titman1967; Hollerbach Reference Hollerbach2003) denoted the
 $m=1$
mode to be ‘mysterious’ since it is not fitting to any present theory to date. First, we note that its structure resembles the prograde propagating
 $(l=5,m=1)$
columnar inertial mode in a full sphere (see e.g. Zhang et al.
Reference Zhang, Earnshaw, Liao and Busse2001) excited due to resonance at low Rossby numbers. However, Wicht (Reference Wicht2014) reported that this mode is excited outside the
 ${\mathcal{T}}{\mathcal{C}}$
and, hence, cannot be explained with the discontinuity in potential vorticity. He rather proposed that the background flow might have a significant influence on the structure and direction of the propagation of the
 $m=1$
mode. Surprisingly, Wicht (Reference Wicht2014) found numerically that for
 $E=10^{-6}$
only in a rather small parameter range, the critical wavenumber of the first instability is indeed
 $m=1$
(see figure 21 in Wicht (Reference Wicht2014)). Barik et al. (Reference Barik, Triana, Hoff and Wicht2018) pointed out that even for much larger Ekman numbers it is difficult to clearly identify a
 $m=1$
mode at the transition since other modes are present as well even though weaker. For
 $E<10^{-5}$
the
 $m=2$
mode seems to slightly precede the instability making the
 $m=1$
mode an important secondary instability. In Hoff et al. (Reference Hoff, Harlander and Triana2016b
), we have shown that the
 $m=1$
mode also contributes to numerous wave interactions in sub-rotating spherical gaps, which emphasises the fundamental character of the corresponding instability. This was recently numerically confirmed by Barik et al. (Reference Barik, Triana, Hoff and Wicht2018). However, up to now, there seems to be no clear idea about the underlying instability for the
 $m=1$
mode.
Regarding the spiral Rossby waves, we detected a mode replacement from smaller scales to larger scales (large to small azimuthal wavenumber) for increasing Rossby numbers. A similar behaviour was reported from the experiments by Triana (Reference Triana2011), and Rieutord et al. (Reference Rieutord, Triana, Zimmerman and Lathrop2012) suggesting that critical layers and over-reflection could be responsible for the mode excitation. In case of super-rotation, we indeed see critical layers situated almost perfectly on the tangent cylinder for the respective most unstable wave modes. As a consequence, our experiments confirm the feasibility of the critical layer excitation concept. Unfortunately, with the PIV technique we did not succeed in experimentally resolving all the relevant processes involved at the critical levels.
Flow chart illustrating all detected Stewartson-layer instabilities and their wavenumber dependencies on the Ekman number and frequency. See text for more details.

The flow chart in figure 13 summarises the detected Stewartson-layer instabilities and the relationship between wavenumber, Ekman number and wave frequency. We see that for the spiral-wave case (
 $Ro>0$
), after the onset of instability the wavenumber increases (decreases) for decreasing (increasing) Ekman number. For the chosen Ekman number of
 $Ro\approx 0.5$
, the wavenumber increases for increasing
 $\hat{\unicode[STIX]{x1D714}}$
and decreases for decreasing
 $\hat{\unicode[STIX]{x1D714}}$
. For trapped waves with
 $Ro<0$
the onset mode is always the Rossby mode with
 $m=1$
and in fact all trapped waves form nearly geostrophic (columnar) patterns. However, the
 $m=1$
fundamental mode at onset exhibits a very particular structure, which seems to be not absolutely trapped within the Stewartson layer. For the chosen Ekman number of
 $Ro\approx -0.5$
, the maximum wavenumber is independent of the Ekman number. However, the wavenumber decreases for decreasing
 $\hat{\unicode[STIX]{x1D714}}$
and increases for increasing
 $\hat{\unicode[STIX]{x1D714}}$
.
In conclusion, we found that whenever super-rotation is involved, spiral Rossby waves develop, whenever sub-rotation is involved, trapped Rossby waves develop. For
 $Ro>0$
, the very first instability is always a small-scale feature, which will be replaced by larger-scale features for the subsequent instabilities. Once a set of instabilities is developed (usually around
 $|Ro|\gtrsim 0.5$
), higher harmonics occur. The maximum wavenumber we detected in our experiments increases with decreasing Ekman number, leading to a more turbulent flow.
Acknowledgements
M.H. was financed by the DLR (grant number 50 WM 0822) and by the DFG (grant number HA 2932/7-1). U.H. thanks DFG for financial support via the projects HA 2937/8-2 (DFG research unit MS-GWaves) and the DFG core facility centre, HA 2937/10-1. We thank two anonymous reviewers for their constructive criticism that helped to make the paper clearer. U.H. thanks B. Futterer and R. Hollerbach for fruitful discussions in the early stages of the study. We further thank C. Egbers for generously providing us the spherical-shell experiment.


 Open access

