Implications
The results of our study show that farmers differ in their preferences to animal health management relatively to other areas of farm management. These findings suggest that veterinary advisors, who are facing a situation in which farmers do not follow-up the given advice, should make themselves familiar with the farmers’ specific preferences regarding farm management. Since unawareness of veterinary advisors of an advice directed at an unfavourable management area could explain why individual farmers remain non-compliant with their advice. Advice directed at an unfavourable management area should then be strengthened by showing, for example, the potential benefits of the advice.
Introduction
Veterinary advisors play an eminent role in dairy farm management. Based on their expertise and knowledge on animal health, they try to identify the risk factors at the farm level and advise farmers accordingly. In practice, the adoption and implementation of the advice by farmers is often constrained. Although the rationale of the decisions of the farmer might be very logical, their decisions might be experienced by veterinary advisors as incompliant, potentially resulting in the opinion that farmers are hard-to-reach (Jansen et al., Reference Jansen, van Schaik, Renes and Lam2010). Although it is known that a successful advice requires awareness of the goals and priorities of the individual farmer and that tailoring advice will motivate farmers to implement management advice (Da Silva et al., Reference Da Silva, Noordhuizen, Vagneur, Bexiga, Gelfert and Baumgartner2006), veterinary advisors often fail to do so (Derks et al., Reference Derks, van Woudenbergh, Boender, Kremer, van Werven and Hogeveen2013).
Resource demands (e.g. labour, investments) in one field of farm management may provoke conflicts with management measures in other fields, and farmers allocate resources to those management areas which are preferred most, given their specific farming situation. A reason for the incompliance of farmers could be that veterinary advisors typically relate their advice to the field of animal health and make a trade-off decision between different animal health issues (e.g. lameness, mastitis), directing their advice to the most important issue. Improvement of animal health via better management is only one aspect of farm management. Better insights in the personal preferences of dairy farmers towards improved animal health management areas in relation to other farm management areas will lead to a better understanding by veterinary advisors of the motives and reasons for incompliance of a dairy farmer with the suggested advice.
While animal health is an important theme throughout the dairy chain, management of animal health might be more important in the organic dairy sector than in the conventional sector. Organic dairy farmers face an animal health status which is on average not better than the conventional sector (Hovi et al., Reference Hovi, Sundrum and Thamsborg2003). Consumers generally expect a higher animal health status on organic farms (Hughner et al., Reference Hughner, McDonagh, Prothero, Shultz and Stanton2007). However, general health status on organic dairy farms is not higher than on conventional dairy farms, meaning that it does not meet consumers’ expectations. Health improvements are therefore crucial to comply with consumer expectations on organic farming. The pre-dominant animal health problems in organic dairy farming are mastitis and lameness (Rosati and Aumaitre Reference Rosati and Aumaitre2004; Sutherland et al., Reference Sutherland, Webster and Sutherland2013) and their incidences should be reduced both from a societal and economic perspective (Huijps et al., Reference Huijps, Lam and Hogeveen2008; Bruijnis et al., Reference Bruijnis, Hogeveen and Stassen2010).
The targeted aim of this research was two-fold; the first aim was to investigate how improved animal health management is preferred by European organic dairy farmers in relation to other areas of farm management, using an adaptive conjoint analysis (ACA). The second aim was to specifically investigate if farmers could be clustered based on their preference for animal health management measures and to what extent clustering can be explained by general herd characteristics.
Material and methods
Research set-up and application
Within this study, elicitation of farmers’ relative preference towards different management areas was studied using the computer-based ACA method (Sawtooth Software, 2014). Although primarily known as a marketing tool, the ACA method has been successfully applied in the field of agriculture and specifically dairy farming to evaluate preferences among management options (Valeeva et al., Reference Valeeva, Lam and Hogeveen2007; Huijps et al., Reference Huijps, Hogeveen, Lam and Huirne2009; Boersema et al., Reference Boersema, Noordhuizen and Lievaart2013).
ACA is a method to determine preferable characteristics of a defined product, in which respondents make a series of trade-offs among the product characteristics. Analysis of these trade-off decisions will reveal the relative preference of the studied characteristics. In ACA a product is assumed to comprise characteristics (named attributes), each with its own levels (e.g., colour is an attribute with red, white and blue as levels). ACA consists of four distinct sections in which information is derived from the respondent on his or her preferences for the different levels. After (and during) each section the derived information is updated and used as input for the next step. The derived information is presented by the part-worth utilities and these are always zero-centered. Part-worth utilities comprise information on the relative preference for the attributes, but more importantly contain vector information on which level is preferred over another. The final results are estimated with Hierarchical Bayes estimation and result in the final part-worth utilities which are estimated for each of the respective levels of the attribute. The difference between the most and least preferred level within an attribute will result in the relative preference scores for each attribute.
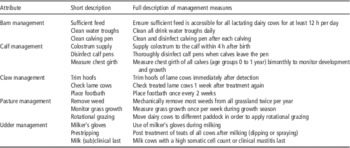
Following ACA terminology in this study, the farmer is the respondent and the product is defined as farm management, with farm management areas as attributes and respective management measures as levels (Table 1). Management areas and their respective measures were derived from a literature search and experts’ opinions. Improved udder health management and improved claw health management were both selected as representatives for animal health management. The remaining management areas (barn, calf and pasture management) were chosen because of their diversity and their potential as areas of improvement of farm management. To explore and detect (dis)similarities among farmers’ management preferences, the constructed management measures (three levels per attribute) were defined as precise as possible, not mutually exclusive and easy to be implemented. Moreover, to control for any imbalance in labour requirements between management measures farmers were asked to assume labour would not be restrictive in their decision to adopt a certain management measure. A more in-depth description of ACA estimation and construction can be found in a technical paper of Sawtooth Software (2007).
Description of attributes (management areas) and levels (management measures) used in the adaptive conjoint analysis to elicit farmers’ preferences

Survey population
The survey population of 216 organic dairy farmers originated from four different European Union (EU) countries: France (n=71), Germany (n=60), Spain (n=28) and Sweden (n=57). This population was part of a EU 7th framework research project aimed to improve animal health on EU organic dairy herds (IMPRO: Impact matrix analysis and cost-benefit calculations to improve management practices regarding health status in organic dairy farming). Farmers from the respective countries were eligible for inclusion in the study when the following four requirements were satisfied: (1) Test-day milk records had to be available from January 2012 onwards. (2) Farms had to be officially labelled as organic for at least 1 year at the start of the questionnaire (February 2013). (3) Farms had to be expected to stay in operation at least for the immediate future. (4) A representative country herd size was requested. Final stages of the selection process differed per country; French farms were selected by a local organic advisor and originated from three administrative regions (Morbihan, Loire-Atlantique and Lorraine). German farms were selected by either organic dairy advisors or veterinary practices. Out of the willing participants a representative sample was drawn. German farms were located in north Germany (Schleswig-Holstein, Mecklenburg Vorpommern and Lower-Saxony), central Germany (Hesse and Northern Bavaria) and south Germany (Lower Bavaria and Baden Württemberg). All Spanish organic dairy farms were first contacted by phone by the researcher, all willing and eligible farmers were included in the study. Spanish farms were located in Galicia, Asturias, Cantabria Basque country and Catalonia. Swedish organic farms were located in north and west Sweden (Gävlesborg and Värmlands län), central east Sweden (Uppsala and Västmanlands län), central Sweden (Stockholms, Västra gotäland and Östergötlands län) and south Sweden (Västra götalands län) and were first sent an invitation letter after which eligible and willing farmers were included.
Within the EU the share of organic farming in dairy farming varies over the different member states. Sweden is one of the member states with the largest share (14%) of organic dairy cows out of the total number of dairy cows whereas Spain has a relatively small share of 1% (Eurostat, 2014). The average share of organic dairy cows in the EU is 3% which equals the share of Germany and France. In absolute values, share and degree of settlement of organic development these four countries capture the variation of organic dairy production within Europe.
Data collection and translation process
The draft version of the ACA was discussed with the country specific researchers and tested on a Dutch dairy farmer with experience in organic dairy farming. Potential conflicting measures or ambiguities were omitted or changed. The final version of the ACA was then translated to the country specific language via multiple translation sessions, together with the research team of each country. The translated documents were re-translated in English, as a final validity check. The re-translated documents were compared with the original. When there were differences, the translated ACA was then adjusted to ensure the ACA was interpreted the same by farmers from different countries. Before the farm visits, local researchers were instructed on how to administer the ACA. During the data collection and before the ACA, socio-economic characteristics (certification, education and agricultural area) were collected via a paper questionnaire. Technical herd characteristics (farm size, milk yield and somatic cell count ) were collected via herd recordings, while the percentage of lame cows was assessed during the farm visits following the Welfare Quality® protocol.
ACA set-up
The ACA consists of four distinct sections each dedicated to elicit farmers’ preference for different farm management areas by making trade-offs between sets of management measures. In the first section the preferences for each combination of management area (five attributes) and related management measures (three levels) were elicited, resulting in a total of 15 crude part-worth utility values.
In the second section, famers were asked to indicate how strong their preference between the most and least preferred management level was under ceteris paribus conditions. Based on this information the crude part-worth values were updated to prior part-worth utility values. In the third section farmers made paired comparisons between multiple levels of different attributes. Responses after each comparison were used to select the next paired comparison question by updating the estimates of the farmers’ part-worth utilities The fourth and final section was a consistency check in which farmers were presented with three concepts of each three management measures and asked how preferable each of these concepts were for implementation in their daily farming routine. Data obtained from the final task was used to analyse correlations between the part-worth utilities and likelihood responses and resulted in the consistency coefficient.
Estimating part-worth utilities
The part-worth utility values derived after the third step served as input for estimating the final part-worth utility values using Hierarchical Bayes estimation. The Hierarchical Bayes estimation follows an iterative process and assumes individual part-worths to have a multivariate normal distribution:
 $$\beta _{i} \,\sim\,{\rm Normal}\:(\alpha ,D)$$
In which β i is a vector of part-worths for the i-th individual, α is a vector of means of the distribution of individuals’ part-worths and D is a matrix of variances and covariances of the distribution of part-worths across individuals.
Given an individual’s part-worth utility values, the probabilities of responding in a particular way are governed by a multivariate normal distribution, which is described as follows:
 $$y_{{ih}} =x_{{ih}} ^{\prime} \beta _{i} {\plus}e_{{ih}} $$
in which y ih is the answer to question i by respondent h, x ih ′ is a row vector of values describing the i-th question for respondent h and e ih is an independent identically distributed error term, distributed normally with mean of zero and variance σ 2. The estimated parameters are the vectors of β i , the vector α, the matrix D and the scalar σ. A more in-depth description of Hierarchical Bayes estimation can be found in a technical paper of Sawtooth Software (2006).
Preference score
The difference between the highest and lowest final part-worth utility represents a relative measure of preference, named preference score, for the respective management area. A higher preference score represents a higher preference for a certain management area relative to the other management areas. To account for farmers which either gave consistently more extreme answers, the utilities were made comparable between farmers. The sum of the preference scores of each farmer was therefore set to equal 100. A preference score of 20 for each of the five management areas would thus represent no particular preference for any of the five management areas (all are equally important).
Cluster analysis
To reveal farmers profiles for different attributes related to animal health, a cluster analysis was performed separately on the part-worth utilities of improved udder-health management and improved claw-health management using SAS/STAT® software (SAS Institute Inc., Cary, NC, USA). Since cluster procedures performs poorly with elliptical data, part-worth utilities were transformed (PROC ACECLUS) into a spherical form by computing canonical variables. The proportion of pairs used for estimating canonical variables was set at 0.03. The farmers were clustered based on the transformed part-worth utilities. The cluster method used was the Ward minimum-variance method which in the first stage considers each of the farmers as a single cluster. Ward’s method has a good performance for recovering the original clusters (Mingoti and Lima, Reference Mingoti and Lima2006). At each consecutive stage, the farmers were compared with each other by using a measure of distance.
The distance between Cluster CK and CL is defined as:
 $$D_{{KL}} ={{\,\mid\mid\,\overline{X} _{K} {\minus}\overline{X} _{L} \,\mid\mid\,^{2} } \over {{1 \over {N_{K} }}{\plus}{1 \over {N_{L} }}}}$$
In which C K and C L have vectors with means X K and X L and sizes N K and N L , respectively. The distance D KL between C K and C L is a function of the squared Euclidian distance between the cluster centroids. The two clusters with the smallest distance (or larger similarity) are joined. The procedure is repeated until the desirable number of clusters is achieved. At each cluster stage the Pseudo F and Pseudo T 2 are reported. Higher values indicate the presence of possible clusters and need further investigation. A visual assessment of the corresponding tree-diagram in relation to the R 2 was then used to determine the final number of clusters.
Results
Response
On average farmers completed the questionnaire within 21 (SD±9) min. The average consistency coefficients was 52% (SD±18.2%). Feedback on the ACA from the farmers indicated that the third task, the paired-comparisons, was sometimes hard to assess. The average time used to complete the ACA and the consistency coefficient gave no reason to exclude farmers.
Herd characteristics
A total of 71 French, 60 German, 28 Spanish and 57 Swedish organic farmers participated. One French farm was omitted as it was not able to comply with the inclusion criteria. The average number of years a farm was certified as organic equalled 9.2 years. Between countries the average period of certification varied from minimal 6.8 years in Spain to maximal 10.1 years in Germany. The average agricultural area was 158 ha. per farm with the largest area per farm in Sweden (276 ha.) and the lowest area per farm in Spain (70 ha.). The variation in agricultural area per farm between countries corresponds with the variation in herd size; herd size in Sweden was on average the largest (101 dairy cows) and in Spain the lowest (59 dairy cows). The average derived income by farmers from dairy related activities varied between the four countries from 72.5% in Sweden to 82.0% in Germany. Swedish organic dairy cows produced relatively more than (9000 kg milk/cow v. 6036 kg milk/cow) French dairy cows.
Preference scores
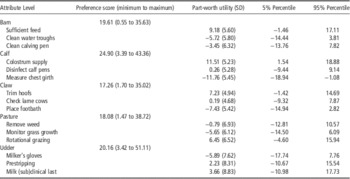
Average preference scores and utility values for the management areas and measures are presented in Table 2. Calf management had on average the highest preference score (24.9) compared with all other attributes. Within calf management the measure ‘colostrum supply’ was most preferred and the measure ‘chest girth’ was least preferred. Farmers had a utility value close to zero for the measure ‘disinfect calving pens’ suggesting no specific preference for this measure. Within barn management the provision of sufficient feed for at least 12 h per day was the most preferred management measure. Both ‘clean calving pen’ and ‘clean water troughs’ had a negative utility value suggesting a low preference. Within pasture management the measures ‘rotational grazing’ was the most preferred management measure whereas ‘monitor grass growth’ was the least preferred management measure. Farmers had a slightly negative utility for the measure ‘remove weed’.
The preference scores for the different management areas (minimum to maximum) and final part-worth utility scores (5% to 95%) for the related management levels

Higher values indicate a higher preference for the respective management area or measure.
Udder health management was on average more preferred than claw health management. Within udder health management both ‘prestripping’ and ‘milk (sub)clinical last’ were given a positive utility value in which the latter measure was more preferred. ‘Use of milker’s gloves’ was least preferred. Within claw health management ‘trim hoofs’ was preferred most and ‘place footbath’ was least preferred. Variation among part-worth utility values was large and preferences for the most and least preferred measures varied substantially between farmers.
Cluster analysis
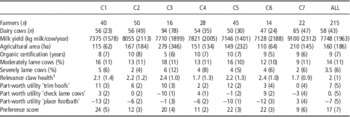
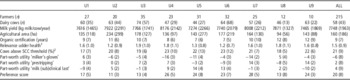
The cluster analysis was performed on the utility values of udder health management and claw health management to obtain insights in farmers’ preferences with respect to animal health management measures. The cluster analyses on the part-worth utility values of claw health and udder health management revealed, respectively, 7 (C1 to C7) and 9 (U1 to U9) distinct clusters (Tables 3 and 4). The R 2 of the claw health cluster analysis was equal to 0.853 and of the udder health cluster analysis to 0.785. Generally, there was a large variation in preference scores and part-worth utility values between clusters.
Description of mean herd characteristic, health issues and ACA results of part-worth utilities and preference score per claw health cluster (C1 to C7) and for all farms (n=215)

ACA=adaptive conjoint analysis.
Higher values indicate a higher preference for the respective management area or measure.
1 Farmers were asked to rank the following production diseases: fertility problems, udder diseases, claw and limb diseases, metabolic disorders and other in which 1 was most relevant and 5 was least relevant.
Description of mean herd characteristic, health issues and ACA results of part-worth utilities and preference score per udder health cluster (U1 to U9) and for all farms (n=215)

Standard deviation is put between brackets.
1 Farmers were asked to rank the following production diseases: fertility problems, udder diseases, claw and limb diseases, metabolic disorders and other in which 1 was most relevant and 5 was least relevant.
2 Threshold was set at 300.000 cells/ml.
Cluster C1, C3, C5 and C6 had an average preference score ⩾20 (24, 20, 22 and 22), while clusters C2, C4 and C7 had an average preference score <20 (12, 11 and 9). General herd characteristics nor country significantly influenced the cluster outcome. Clusters C3 and C7 gave a higher part-worth utility value to the measure ‘place footbath’ than to the other claw clusters. On average C3 and C7 had a larger herd size (94 and 65 dairy cows) and agricultural area (279 and 210 ha) than other herds. Cluster C3 was found to be least experienced in organic farming with 5 years of organic experience. Cluster C7 had a high production per cow (9101 kg milk/cow/year) compared with the overall herd average ( 7747 kg milk/cow/year). Clusters C1, C5 and C6 were least productive with a production of 7375, 7146 and 7128 kg milk/cow/year, respectively. The on farm assessment of claw health following the welfare quality protocol indicated that on average 14% of all cows was moderately lame and 4% severely lame. Cluster C3 had on average the highest point prevalence of dairy cows both moderately and severely lame (18% and 6%), while cluster C7 had the lowest point prevalence of lame dairy cows (9% and 2%). C1 and C5 had on average a higher point prevalence of moderately lame animals compared with the herd average (both 16%), while C2 and C7 had a lower point prevalence of severely lame animals (both 2%). Clusters C4 and C7 indicated claw health as more relevant on their farm compared with the other clusters.
Clusters U4, U5, U6, U7 and U9 had an average preference score ⩾20 (26, 24, 23, 28 and 24) and clusters U1, U2, U3 and U8 had an average preference score <20 (17, 11, 13 and 13). Within the nine clusters preference for the three management measures varied greatly. However, in most clusters (U2, U3, U4, U5 and U7) the measure ‘milker’s gloves’ was least preferred. Clusters U4, U5 and U6 were certified as organic the shortest (8, 7 and 7 years) whereas all other clusters were certified for a duration above average (varying from 9 to 12 years). The average number of years of education varied between 10 and 13 years between clusters. Cluster U2 had on average the largest agricultural area (233.6 ha) and cluster U8 had the smallest (94 ha). Average milk production was highest in cluster U4 (8176 kg milk/cow/year), although all clusters represented a production close to the overall herd average of 7748 kg milk/cow/year. All clusters with a preference score⩾20 had a higher prevalence of dairy cows above a SCC threshold of 300.000 cells/ml than clusters with a preference <20. Clusters U2, U5 and U6 indicated udder health as more relevant on their farm compared with the other clusters.
Discussion
Response
Too complex attributes and levels or a poor constructed ACA will result in negative consistency coefficients (indication of inconsistent answers) and/or respondents rushing (or taking too much time) through the questionnaire. In our study the average consistency coefficient is lower compared with previous comparable ACA studies (Valeeva et al., Reference Valeeva, Lam and Hogeveen2007: 75.7% to 88.8%; Boersema et al., Reference Boersema, Noordhuizen and Lievaart2013: 67%±19.4). Feedback from the farmers indicated that the third task, the paired-comparison, was sometimes experienced as difficult to assess. This might explain why the consistency coefficient is lower compared with comparable ACA studies. However, consistency coefficients and the time used to complete the ACA gave no reason to exclude farmers. We concluded that although some farmers found the paired comparison task hard they understood the overall concept. Therefore the results are valid. Furthermore, the part-worth utilities indicate a large variation in preference between farmers for the different management measures, which indicates farmers were able take the assumption on time availability into account (otherwise management measures would be ranked similar between farmers with the least laborious measure preferred most).
Preference scores
Given the results, udder health management is more preferred than claw health management, which might suggest that udder health is experienced as more of a problem than claw health in organic dairy systems. In general, culling is one of the main contributors to the costs of mastitis and lameness on a dairy farm (Bruijnis et al., Reference Bruijnis, Hogeveen and Stassen2010; Hogeveen et al., Reference Hogeveen, Huijps and Lam2011). In Swedish and French organic dairy herds it was found that the main reason for culling dairy cows was primarily related to udder health problems and less to leg problems (Seegers et al., Reference Seegers, Beaudeau, Fourichon and Bareille1998; Ahlman et al., Reference Ahlman, Berglund, Rydhmer and Strandberg2011). Perception of the farmer on the impact of the problem also influences the preferences as losses due to mastitis are more visible as they imply direct effects (discarded milk, treatment costs) whereas losses due to lameness are more gradual (drop in milk yield) and therefore experienced as less of a problem by farmers (Bruijnis et al., Reference Bruijnis, Hogeveen, Garforth and Stassen2013).
Cluster analysis
Increased herd size could affect farmers preference in favour of less labour intensive measures. Generally ‘place footbath’ implies less labour compared with ‘check lame cows’ or ‘trim hoofs’ which might explain why ‘place footbath’ is more preferred by clusters C3 and C7 in comparison to the other clusters. Next to herd size, C3 could comprise farmers relating their farm management to conventional system where the use of a footbath is more common practice (Stiglbauer et al., Reference Stiglbauer, Cicconi-Hogan, Richert, Schukken, Ruegg and Gamroth2013), since they were more recently converted to organic farming. Animal health clusters were unlikely to be affected by agricultural area, which is correlated to herd size, since most organic feed is traditionally home-grown (Hovi et al., Reference Hovi, Sundrum and Thamsborg2003).
The level of animal health problems is likely to affect preference score and part-worth utility. A review by Dufour et al. (Reference Dufour, Fréchette, Barkema, Mussell and Scholl2011) found ‘prestripping’ to be associated with low somatic cell count (SCC) herds to detect early cases of clinical mastitis. However, we did not find that ‘prestripping’ was more preferred in clusters with a low SCC. In a study of Jansen et al. (Reference Jansen, van Schaik, Renes and Lam2010) increased bulk milk somatic cell count was found to affect farmers’ behaviour; our study suggests SCC could influence farmers’ towards a higher preference score for udder health.
Most clusters with a higher than average prevalence of severely lame cows were found to have an average preference ⩾20, although cluster C4 had a preference <20. Poor animal health status is correlated with a drop in milk production (Warnick et al., Reference Warnick, Janssen, Guard and Gröhn2001; Halasa et al., Reference Halasa, Huijps, Osteras and Hogeveen2007; Bicalho et al., Reference Bicalho, Warnick and Guard2008). A drop in milk production could be a more important indicator for claw health other than udder health and might influence the cluster outcome, which is supported by the lower milk production in clusters C1, C5, C6 compared with the relatively high milk production and good claw health status in clusters C2 and C7. Although not significantly indicated by the results from this study, some herd characteristics as milk production, prevalence of severely lame cows, and SCC could influence the outcome of part of the clusters, but not all.
It is likely that other aspects, which are not easily derived from herd recordings or veterinary visits, play an important role in farmers preference, which was also suggested by Huijps et al. (Reference Huijps, Hogeveen, Lam and Huirne2009). Farmers’ decisions are influenced by multiple factors related to personal characteristics (age, education, etc.) (Vanslembrouck et al., Reference Vanslembrouck, Van Huylenbroeck and Verbeke2002), structure of the farm (farm type, farm size, technical performance, etc.) (Potter and Gasson, Reference Potter and Gasson1988; Edwards-Jones, Reference Edwards-Jones2006), social background (information flow, local culture, attitude of friends, etc.) (Solano et al., Reference Solano, León, Pérez and Herrero2003) and job satisfaction (procrastination of boring or nasty jobs). It would be interesting to investigate how socio-economic characteristics and social capital (e.g. social norms, obligations and expectations) would affect farmers’ preferences on management areas by using a similar approach as for example Burton et al. (Reference Burton, Rigby and Young1999) and Mathijs (Reference Mathijs2003). Knowledge on the key factors affecting farmers’ preference will aid veterinary advisors towards a better understanding of why farmers might remain incompliant with their advice.
Implications veterinary advice
Our aim was to explore farmers’ preferences towards animal health and not to evaluate specific veterinary advice. The constructed measures were used as examples of potential improvements to the specific management area. In real life many different management measures could be advised by a veterinary advisor (Dufour et al., Reference Dufour, Fréchette, Barkema, Mussell and Scholl2011) which would be impossible to fit in an ACA. To correct for the imbalance in labour requirements among management measures, farmers were asked to assume they would experience no labour restrictions in implementing the measure. This assumption influences the results when considering the actual adaptation of measures in practice. For these reasons the outcome of our study cannot be seen as a potential set of measures suitable for a veterinary advice. Results of our study show a large variation in preferences between farmers and confirms our belief that veterinary advisors cannot presume a certain preference based on herd characteristics alone.
The expertise and advice from veterinary advisors remain indispensable to the farmers. However, Derks et al. (Reference Derks, van Woudenbergh, Boender, Kremer, van Werven and Hogeveen2013) showed that veterinarians were not always aware of the goals of farmers regarding herd health management. Our findings suggest that veterinary advisors should become aware of the farmers preferences towards different animal health management in relation to other areas of farm management. A more thorough understanding of the trade-off decisions of an individual dairy farmer will lead to a better mutual understanding of the veterinary advisor and farmer. When veterinary advisors are aware that their advice is directed at an unfavourable management area they need to strengthen their advice further by discussing with the farmer why the disease is a problem to the farmer and/or by showing the benefits of their advice (e.g. health benefits or economic benefits). ACA methodology can be a good method to explore which management measures are (un)favourable by farmers.
In conclusion this study shows that EU organic dairy farmers differ in their preferences for improved animal health management within the farming system. In general improved claw health management is the least preferred management area, while improved udder health management is of intermediate preference. Generally it is expected that advise directed at claw health will have a larger number of farmers incompliant with the advice relative to udder health management advice. The results indicate a high degree of variation in farmers’ preference, which cannot be explained by the typical herd characteristics. With the individual preferences revealed by ACA, a veterinary advisor can now find out whether his intended advice is directed at a favourable or unfavourable management area of the farmer. If the latter is the case the veterinarian should first create awareness of the problem to the farmer. Which measures are then best implemented on the farm remains a task of the veterinary advisor and cannot be based on the ACA results. Insights in individual farmers preferences will allow veterinary advisors to better understand why farmers were incompliant with their advice and improve their advice by showing, for example, the potential benefits of their advice.
Acknowledgements
Work on this paper was supported by the European Commission under grant agreement number 311824, seventh framework programme, project IMPRO: Impact matrix analysis and cost-benefit calculations to improve management practices regarding health status in organic dairy farming. The authors would like to thank Isabel Blanco Penedo (IRTA, Spain), Julie Duval (ONIRIS, France), Susanne Hoischen (University of Kassel, Germany), Karin Jonasson (SLU, Sweden), Margret Krieger (University of Kassel), and Timothee Petit (ONIRIS), for contacting the farmers, field application of the ACA, and the farmers for participating in the study.