


Introduction
Snow deposition and redistribution are influenced by topography and land cover, so snow covers have spatial variations in depth. The energy available to melt snow varies with small-scale advection of heat from snow-free patches or exposed vegetation and variations in radiation with slope and aspect, so snowmelt will also be spatially variable. For both reasons, snow covers generally become patchy when melting. This occurs on a wide range of length scales; indeed, snowpatch geometries and snow-depth distributions have been found to have fractal characteristics (Reference Shook, Gray and PomeroyShook and others, 1993; Reference Shook and GrayShook and Gray, 1996). Because several of the factors influencing the melt energy also influence snow redistribution, there may be some spatial association between patterns of melt and snow water equivalent (SWE). Reference Faria, Pomeroy and EsseryFaria and others (2000) found a negative correlation between SWE and melt rate for snow beneath mixed boreal-forest canopies and suggested that longwave radiation and horizontal advection of heat from tree trunks accelerated the melt of shallow snow near trunks. In a dense spruce stand, however, Reference Pomeroy, Hanson and FariaPomeroy and others (2001) found a distribution of melt energy but no significant correlation with SWE measured along a transect with 1 m spacing. R. J. Harding (personal communication, 2002) found an opposite tendency at larger scales for melt measured on a 20 m grid crossing an Arctic hill slope: the melt rate was greatest for the deepest snow, possibly because of a reduction in albedo caused by dust blown onto a drift from a scoured upwind area. Reference Pomeroy, Toth, Granger, Hedstrom and EsseryPomeroy and others (2003) found a negative correlation on scales of hundreds of metres across a subarctic valley with a snowdrift on its north-facing slope. They noted that redistribution of snow by wind could lead to either positive or negative correlation on small catchment scales depending on the aspect of the slopes on which prevailing winds build drifts. Processes operating on different scales will give spatial associations changing with the scale on which snow distributions are considered. The characteristics of observed SWE and melt distributions are further discussed by Reference Pomeroy, Essery and TothPomeroy and others (2004).
Because snow has a strong influence on land-surface characteristics such as albedo, hydrological models and land-surface schemes used in atmospheric models have to represent the influence of heterogeneity at scales smaller than the model grid. This is usually done by using the fraction of snow cover to calculate effective surface parameters or to weight separate flux calculations for snow-covered and snow-free areas. From the average SWE S over the entire area (snow-covered and snow-free), snow-cover fraction f is obtained using a snow-cover depletion (SCD) curve. Functional forms assumed by models for these curves have included

used by BATS (biosphere–atmosphere transfer scheme; Reference Yang, Dickinson, Robock and VinnikovYang and others, 1997), ISBA (interaction soil–biosphere– atmosphere; Reference Douville, Royer and MahfoufDouville and others, 1995) and MOSES (Meteorological Office surface exchange scheme; Reference Essery, Best and CoxEssery and others, 2001),
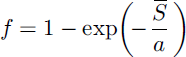
used by GISS (Goddard Institute of Space Studies; Reference HansenHansen and others, 1983) and UKMO (U.K. Meteorological Office; Reference EsseryEssery, 1997), and
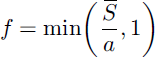
used by CLASS (Canadian land-surface scheme; Reference VerseghyVerseghy, 1991) and SiB (simple biosphere; Reference SellersSellers and others, 1996); a is a parameter with the same dimensions as S̄ (mm or kgm- 2) in each case. Reference Gray and LandineGray and Landine (1987), Reference Donald, Soulis, Kouwen and PietroniroDonald and others (1995) and Reference Hamlin, Pietroniro, Prowse, Soulis and KouwenHamlin and others (1998) also used linear functions to fit observed snow-cover depletion and albedo decay. In an offline test of BATS, Reference Yang, Dickinson, Robock and VinnikovYang and others (1997) found that the alternative function
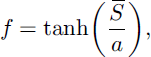
based on albedo measurements by Reference Baker, Skaggs and RuschyBaker and others (1991), gave a better match to observed snow-cover fractions for short vegetation than Equation (1). Reference Roesch, Gilgen, Wild and OhmuraRoesch and others (2001) also suggested this form for flat, non-forested regions and introduced modifications for gridboxes with forests and substantial subgrid topography.
Applying SCD curves such as Equations (1–4) in atmospheric models, the parameter a is often taken to be proportional to the roughness length of the surface on the assumption that a greater snow depth is required to mask taller vegetation. Hydrological investigations have more often focused on the fraction of snow-free ground emerging as shallower snow melts out in a snow cover of variable depth. In this paper, a synthesis is attempted by comparing the functional forms in Equations (1–4) with results obtained by integrating over SWE distributions assuming homogeneous melting. This is then extended to the case of inhomogeneous melt which may or may not be associated with SWE.
Homogenousmelt
Because topography and vegetation have strong influences on the redistribution of snow, there can be large contrasts in the statistical characteristics of snow cover over complex landscapes. Stratified sampling techniques are often employed to estimate the total snow mass over an area (Reference Steppuhn and DyckSteppuhn and Dyck, 1974; Reference WooWoo 1998); snow surveys are performed within representative landscape units, and the results are averaged using fractional areas of the surface types within the area of interest. Reference PomeroyPomeroy and others (1998) gave a table of coefficients of variation (standard deviation divided by average) in SWE obtained from a large number of surveys categorized by land use, vegetation and land form. Values range from <0.05 in forests to >0.5 on prairies. Reference ListonListon (2003) suggested a classification scheme based on temperature, topography and vegetation to provide values for use in global models. Data on snow distributions from small and mesoscale surveys may not be appropriate for application to large-scale model grids, and further investigations are required.
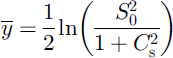
Several studies (Reference Donald, Soulis, Kouwen and PietroniroDonald and others, 1995; Reference ShookShook 1995; Reference Essery, Li and PomeroyEssery and others, 1999; Reference Faria, Pomeroy and EsseryFaria and others, 2000) have found that pre-melt distributions of SWE over reasonably homogeneous surfaces can be approximated by the log-normal distribution

where
and

for pre-melt average SWE S0 and coefficient of variation Cs. Beta and gamma distributions have also been used to fit observed snow distributions (Reference Kuchment and GelfanKuchment and Gelfan, 1996; Reference Brubaker and MenoesBrubaker and Menoes, 2001). The scales on which such unimodal distributions can be applied will depend on the complexity and length scales of the landscape under consideration.
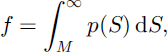
Assuming a homogeneous melt amount M for a snow cover with pre-melt distribution p(S), the fractional area retaining snow cover is
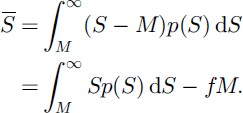
and the average SWE remaining is
For log-normal p(S), Reference Donald, Soulis, Kouwen and PietroniroDonald and others (1995) obtained the results
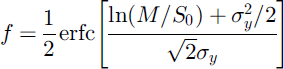
and

where erfc is the complementary error function. Reference ShookShook (1995) and Reference Luce, Tarboton and CooleyLuce and others (1999) used numerical integrations of Equations (8) and (9) to give equivalent results. Curves for Cs between 0.1 and 0.5 are plotted in Figure 1; greater values of Cs give flatter curves.
(a–d) Log-normal SCD curves with Cs = 0.1; . . . ; 0.5 (solid lines) compared with Equations (1–4) (dashed lines) in (a–d), respectively. Lower curves are for larger values of Cs.

The SCD curves defined by Equations (10) and (11) have some inconvenient features for practical applications. A minor problem is that erfc is not provided as a standard intrinsic function by Fortran compilers. A library function could be used (e.g. NAG S15ADF), or Reference Abramowitz and StegunAbramowitz and Stegun (1976) give

where
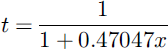
and the residual  for 0 ≤ x < ∞; values for negative x are obtained using erfc(-x) = 2-erfc(x). A more compact, though less accurate, approximation is given by
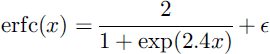
with  for all x.
A more serious problem with the log-normal SCD curve is that it is given in the parametric form f(M) and S̄(M), whereas the SCD curves reviewed in the introduction all have the closed form f(S). The parametric form can be used by storing the pre-melt S0 and accumulated melt (Reference ListonListon 2003), but to assess closed forms we attempt to adjust the parameters in Equations (1–4) to fit log-normal SCD curves; results are shown by dashed lines in Figure 1, and the minimum rms errors obtained using each equation are shown in Figure 2. Because the shape of the log-normal SCD curve depends on Cs only, the parameter a can be expected to be proportional to pre-melt standard deviation σ0. This does not work for Equation (1); numerical minimization of the rms error gives
Minimum rms errors obtained by fitting Equations (1–4) to log-normal SCD curves.
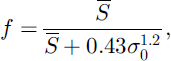
but a close fit is not obtained. Equations (2) and (3), however, give reasonable fits for small Cs with
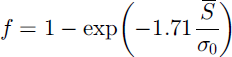
and
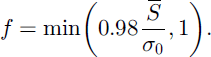
The best overall fit is given by Equation (4) with
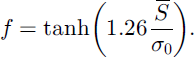
The common observations that snow depths have lognormal distributions and that SCD curves can be fitted by Equation (4) are therefore consistent. An extremely close fit can be obtained by taking f as a cubic polynomial in S̄, but estimates of the coefficients as functions of Cs are not robust.
Inhomogeneous Melt
For in homogeneousmelt, Equations (8) and (9) are replaced by double integrals over the joint SWE and melt distributions. These integrals will generally be intractable, but SCD curves can still be obtained by numerical integration or simulation. Reference Pomeroy, Hanson and FariaPomeroy and others (2001) simulated SCD curves by applying spatially varying melt rates obtained from either a linear function of SWE or an uncorrelated distribution. Here, we consider correlated distributions of SWE and melt.
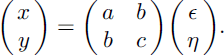
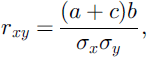
Correlated patterns of SWE and melt with log-normal distributions can be synthesized by first generating independent random fields ϵ and η with zero means, unit variances and normal distributions. Correlated normal fields x and y are then obtained by the matrix multiplication
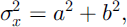
The variances and correlation of x and y are
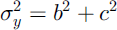
and
from which
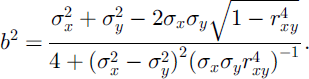
Taking the negative root of Equation (23) for b gives negative correlation. Log-normal fields are given by the transformations

and

To generate fields with coefficients of variation Cs and Cm, the variances of x and y are set to

and

The influences of melt variance and correlation on simulated SCD curves are shown in Figure 3a and b. A melt distribution with coefficient of variation Cm applied without correlation (r = 0) to a SWE distributionwith coefficient of variation Cs gives a SCD curve lying below the homogeneous melt curve. This tendency is increased by negative correlation because areas with shallow snow cover melt faster and become snow-free sooner. For sufficiently strong positive correlation, however, the SCD curve lies above the homogeneous melt curve because slower melt of shallow snow delays the appearance of snow-free patches. The influence of spatial variations in melt is similar to the influence of different coefficients of variation for snow covers undergoing homogeneous melt and so can be represented within the same framework for the cases shown.
Plotting snow-cover fractions from simulations with differing correlation against cumulative melt as in Figure 3c and d, rather than average remaining SWE, gives curves that cross over between early (M < S0) and late (M > S0) times. A positive correlation between SWE and melt delays the initial appearance of snow-free ground, compared with negative correlation, because the melt rate of the shallowest snow is reduced. The increased rate of melting for the deepest snow, however, leads to an earlier completion of melt.
(a, b) The influence of (a) melt variance (Cm = 0.2; 0.4; 0.6 for Cs = 0.4 and r = -0.4) and (b) correlation (r = -0.8; -0.4; 0; 0.4; 0.8 for Cs = 0.4 and Cm = 0.4) on simulated SCD curves. Dashed lines show the homogeneous melt curve for Cs = 0.4. (c, d) The evolution of snow-cover fractions with cumulative applied melt.
Conclusions and Discussion
Assuming a log-normal distribution of SWE and homogeneous melt over an area, a SCD curve relating fractional snow cover to average snow depth during melt can be obtained in a parametric form. Of several more convenient closed forms, a hyperbolic tangent function was found to give the closest fit to the log-normal form; this may explain previous success in fitting tanh functions to albedo and snow-cover measurements over flat sites with short vegetation (Reference Yang, Dickinson, Robock and VinnikovYang and others, 1997; Reference Kunkel, Isard, Hollinger, Gleason and BeldingKunkel and others, 1999). The assumption of a log-normal SWE distribution limits the scales on which simple relationships can be applied, but they may be extended by stratification of heterogeneous areas according to topography and vegetation cover.
The energy available for melting snow can have spatial variations that may be correlated with SWE because of topographic or vegetative influences on both accumulation and ablationof snow(Reference Pomeroy, Essery and TothPomeroy and others, 2004). A random ornegatively correlated melt rate gives a SCD curve lying below the homogeneous melt curve, whereas positive correlation can reduce or reverse the influence of variations in melt.
Monotonic melt gives a well-defined SCD curve, but this will not always be the case. An ephemeral snowpack may go through several cycles of accumulation and ablation over the winter, introducing hysteresis in the relationship between SWE and f. Instead of the diagnostic SCD curves currently used in models, prognostic schemes may be required to account for the deposition, redistribution and melt history of a snowpack. Reference Moore, Bell, Austin and HardingMoore and others (1999) and Reference ListonListon (2003) have introduced simple prognostic schemes.
This paper has assumed that SWE distributions are approximately log-normal, as observed from small-scale surveys within homogeneous landscape units. Above some length scale determined by topography and vegetation distributions, this assumption may break down as landscape units are bridged. In analogy with the stratification used in snow surveying (Reference Steppuhn and DyckSteppuhn and Dyck, 1974) or the tiling used in land-surface modelling (Reference Essery, Best, Betts, Cox and TaylorEssery and others, 2003), snow cover could then be represented by a sum of distributions. Changes in the relationship between SWE and melt rate with scale are discussed in a companion paper (Reference Pomeroy, Essery and TothPomeroy and others, 2004).
Acknowledgements
This work was supported by UK Natural Environment Council grants NER/J/S/2001/00812 and NER/A/S/2001/01089.



