Implication
Mid-infrared spectroscopy demonstrated the potential to predict fatty acid (FA) composition by non-destructive, low cost and fast analysis. The prediction models were able to identify high and low values of individual and groups of FA in milk. Models developed in this study might be used in Brown Swiss population breeding programs aimed at improving the value of milk for human health and nutrition.
Introduction
Milk fat is a mix of glycerides, complex lipids and liposoluble substances, and the main components (96% to 98%) are the triglycerides (Jensen, Reference Jensen2002). According to their saturation, fatty acids (FAs) are classified as saturated (SFA), monounsaturated (MUFA) and polyunsaturated (PUFA). Fat of bovine milk is composed of 70% SFA, 25% MUFA and 5% PUFA (Grummer, Reference Grummer1991; Shingfield et al., Reference Shingfield, Ahvenjärvi, Toivonen, Ärölä, Nurmela, Huhtanen and Griinari J2003).
Milk quality aspects are gaining interest among consumers, particularly those related to human health. The SFA increase blood cholesterol, which in turn is associated with increased cardio-vascular diseases, risk of obesity, atherosclerosis and coronary heart diseases (Mensink and Katan, Reference Mensink and Katan1992; German et al., Reference German, Gibson, Krauss, Nestel, Lamarche, van Staveren, Steijns, de Groot, Lock and Destaillats2009), whereas the unsaturated FA (UFA) reduce the level of cholesterol in blood (Haug et al., Reference Haug, Hostmark and Harstad2007); among them, PUFA decrease the cholesterol content more strongly than MUFA (Williams, Reference Williams2000). In addition, milk fat is the major source of conjugated linoleic acid (CLA; c9,t11-C18:2) in human diet, accounting for 70% of total daily CLA intake (Bauman et al., Reference Bauman, Lock, Corl, Ip, Salter and Parodi2005). Experimental evidences suggest that CLA may have anticarcinogenic, antiatherosclerotic, antidiabetic and immunomodulating effects (Bhattacharya et al., Reference Bhattacharya, Banu, Rahman, Causey and Fernandes2006). Because of the relevance of milk fat on health aspects, it would be interesting to enhance the production of favorable FA through feeding of cows (Chilliard and Ferlay, Reference Chilliard and Ferlay2004; Mele, Reference Mele2009) and breeding (Arnould and Soyeurt, Reference Arnould and Soyeurt2009).
Several studies estimated genetic variation of FA (Soyeurt et al., Reference Soyeurt, Gillon, Vanderick, Mayeres, Bertozzi and Gengler2007; Stoop et al., Reference Stoop, Van Arendonk, Heck, Van Valenberg and Bovenhuis2008; Mele et al., Reference Mele, Dal Zotto, Cassandro, Conte, Serra, Buccioni, Bittante and Secchiari2009) but gas chromatography (GC) is an expensive and time-consuming analysis; hence, a rapid method to determine FA in milk is crucial to extend the collection of phenotypic records at the population level.
Mid-infrared spectroscopy (MIR) is widely used in official milk recording schemes to determine the chemical composition of milk (Lynch et al., Reference Lynch, Barbano, Schweisthal and Fleming2006). Its potential has also been demonstrated to predict coagulation properties of bovine milk (Dal Zotto et al., Reference Dal Zotto, De Marchi, Cecchinato, Penasa, Cassandro, Carnier, Gallo and Bittante2008; De Marchi et al., Reference De Marchi, Fagan, O'Donnell, Cecchinato, Dal Zotto, Cassandro, Penasa and Bittante2009b), detail milk protein composition (De Marchi et al., Reference De Marchi, Bonfatti, Cecchinato, Di Martino and Carnier2009a) and acetone content for the detection of subclinical ketosis (Heuer et al., Reference Heuer, Luinge, Lutz, Schukken, van der Maas, Wilmink and Noordhuizen2001). Soyeurt et al. (Reference Soyeurt, Dardenne, Lognay, Veselko, Mayeres and Gengler2006) and Rutten et al. (Reference Rutten, Bovenhuis, Hettinga, van Valenberg and van Arendonk2009) demonstrated the accuracy of the prediction of FA composition using MIR, but only for the most representative FA. Recently, Coppa et al. (Reference Coppa, Ferlay, Leroux, Jestin, Chilliard, Martin and Andueza2010) reported that near-infrared spectroscopy might be used to predict FA of oven-dried milk, whereas less satisfactory results are obtained for liquid milk.
The aim of this research was to predict individual and selected categories of FA of bovine milk using MIR.
Material and methods
Sample collection
Samples used for GC analysis (n = 267) were randomly selected from 1200 Italian Brown Swiss cows involved in a wide research project conducted in northern Italy from June 2006 to July 2007 (for details, see Cecchinato et al., Reference Cecchinato, De Marchi, Gallo, Bittante and Carnier2009). Briefly, the project was based on the collection of individual milk samples from cows of different parity and stage of lactation, progeny of 50 AI sires, and reared in 30 herds located in the plain, hill and mountain. Herds largely differed in terms of feeding systems, particularly when comparing those from mountain and plain. The later used mainly silages and concentrates, whereas the former were mainly based on hay and fewer concentrates. After collection, samples destined to GC analysis were stored at −20°C without any preservative and transferred to the milk quality laboratory of the University of Pisa (Pisa, Italy).
FA analysis
Milk fat was extracted according to Mele et al. (Reference Mele, Dal Zotto, Cassandro, Conte, Serra, Buccioni, Bittante and Secchiari2009). Methyl esters of medium- and long-chain FA were prepared by the alkali-catalyzed trans-methylation procedure in Christie (Reference Christie1982) with C9:0 and C23:0 methyl esters (Sigma Chemical Co., St. Louis, MO) as the internal standards. FA composition was determined by GC using a ThermoQuest (Milan, Italy) gas chromatograph equipped with a flame ionization detector and a high polar fused silica capillary column (Chrompack CP-Sil 88 Varian, Middelburg, the Netherlands; 100 m × 0.25 mm i.d.; film thickness 0.20 μm). Helium was used as the carrier gas at a flow of 1 ml/min. The split ratio was 1 : 100. An aliquot of the sample was injected under the following GC conditions: the oven temperature was programmed at 60°C and held for 4 min, then increased to 120°C at a rate of 10°C/min, held for 1 min, increased to 180°C at a rate of 2°C/min, held for 18 min, increased to 200°C at a rate of 2°C/min, held for 1 min, increased at 230°C at a rate of 5°/min and maintained at this temperature for 19 min. The injector temperature was set at 270°C, whereas the detector temperature was at 300°C. Individual FA methyl esters were identified by comparing them with a standard mixture of 52 Component FAME Mix (Nu-Chek Prep, Inc., Elysian, MN, USA), and the identification of C18:1 isomers was based on a commercial standard mixture (Supelco, Bellefonte, PA, USA) and on chromatograms published by Kramer et al. (Reference Kramer, Hernandez, Cruz-Hernandez, Kraft and Dugan2008). All the methods that used peak normalization and that expressed results as a relative percentage of the area of the analyzed peaks were subject to overestimation because the small peak areas were not considered. To avoid this problem, two internal standards were used: C9:0 for FA from C:4 to C:13 and C23:0 for FA from C:14 to C:24. Milk FA composition was determined by GC and expressed as g/kg of milk. For each FA, response factors to flame ionization detector and inter- and intra-assay coefficients of variation were calculated by using a reference standard butter (CRM 164, Community Bureau of Reference, Brussels, Belgium). Intra-assay coefficients of variation ranged from 0.5% to 1.5%, whereas inter-assay coefficients of variation ranged from 1.5% to 2.5%.
Only major FA with carbon chain no longer than 20 and categories of FA were studied. In particular, FA were grouped according to either the length of the carbon chain: medium-chain FA (MCFA; from C11 to C17); long-chain FA (LCFA; from C18 to C22); or to the saturation degree: SFA; MUFA; PUFA; UFA; or to the characteristics of the carbon chain: branched-chain FA (BCFA; iso-14:0, anteiso-C15:0, iso-C16:0, anteiso-C17:0); trans FA (TFA; t6,8-C18:1, t9-C18:1, t10-C18:1, t11-C18:1, t12-C18:1,c9,t11-C18:2).
Mid-infrared spectra acquisition and multivariate data analysis
Mid-infrared spectra were collected on the day of sampling in the Food Lab of the Department of Animal Science (University of Padova) from 0.25 ml of milk over the spectral range of 4000 to 900 cm−1 using a Milko-Scan FT120 (Foss Electric A/S, Hillerød, Denmark). Duplicate spectra were captured for each individual sample using the calibration mode and averaged before data analysis. Principal component analysis (PCA) and partial least squares (PLS) regressions were carried out through the Unscrambler software (version 9.6; Camo A/S, Oslo, Norway), and a new smaller set of variables called principal components and loadings (L) were obtained. A graphical representation of similarities and differences between spectra was derived from PCA; this allowed the identification of possible outliers in the spectral data set (Martens and Naes, Reference Martens and Naes1989). Prediction models were computed by PLS regression and confirmed using full cross-validation, and prediction residuals were combined to calculate the root mean square error of cross-validation (RMSECV; Hubert and Vanden Branden, Reference Hubert and Vanden Branden2003). Besides the untreated spectra, two mathematical treatments were tested: first derivative (Savitzky-Golay, three data points each side) and multiplicative scatter corrected (MSC) plus first derivative (Savitzky-Golay, three data points each side) spectra. The accuracy of the prediction models was evaluated using RMSECV, the correlation coefficient in cross-validation (r CV) and the optimum number of L (Hubert and Vanden Branden, Reference Hubert and Vanden Branden2003).
The range error ratio (RER), calculated as the ratio between the range and the RMSECV of the parameter (Williams, Reference Williams2001), was used to test the practical utility of the prediction models. RER is a method of standardizing the RMSECV by relating it to the range of the reference data. For example, RER values of less than six indicate very poor classification and are not recommended for any application; RER values between 7 and 20 classify the model as poor to fair and indicate that the model could be used in a screening application; and RER values between 21 and 30 indicate a good classification suggesting that the model would be suitable for a role in a quality control application (Williams, Reference Williams2001). However, calibrations with lower statistical performance may still be useful depending on the accuracy required in field conditions.
Results
FA composition
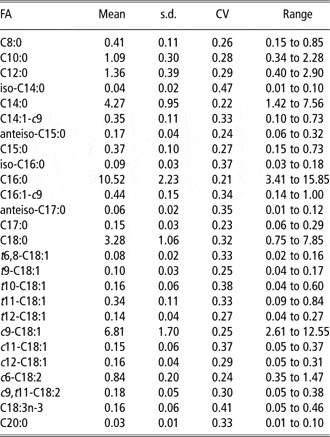
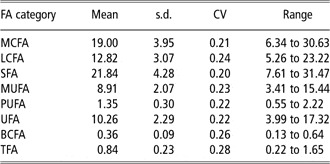
Mean, standard deviation (s.d.), coefficient of variation (CV) and range of individual FA and of selected categories are presented in Tables 1 and 2. The C16:0 (10.52 g/kg) and c9-C18:1 (6.81 g/kg) were the major FA in milk, followed by C14:0 (4.27 g/kg) and C18:0 (3.28 g/kg). As expected, SFA represented the prevalent fraction (21.84 g/kg), followed by MCFA (19.00 g/kg) and LCFA (12.82 g/kg). All FA and selected categories showed large variability with CV that ranged from 0.21 (C16:0) to 0.47 (iso-C14:0) for individual FA (Table 1), and from 0.20 (SFA) to 0.28 (TFA) for groups of FA (Table 2).
Descriptive statistics of individual FA (expressed in g/kg of milk) determined by GC analysis

FA = fatty acids; GC = gas chromatography; CV = coefficient of variation.
Descriptive statistics of FA categories (expressed in g/kg of milk) determined by GC analysis

FA = fatty acids; GC = gas chromatography; CV = coefficient of variation; MCFA = medium-chain FA; LCFA = long-chain FA; SFA = saturated FA; MUFA = monounsaturated FA; PUFA = polyunsaturated FA; UFA = unsaturated FA; BCFA = branched-chain FA; TFA = trans FA.
MIR spectra
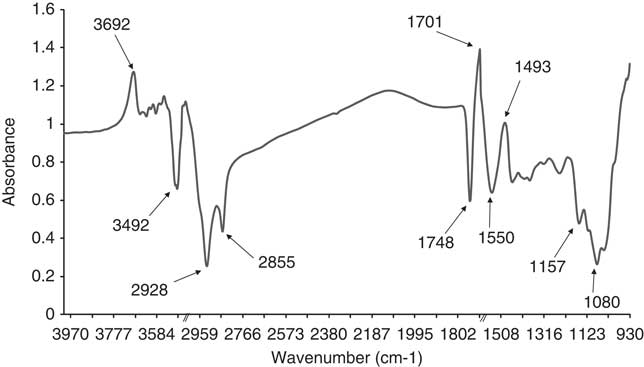
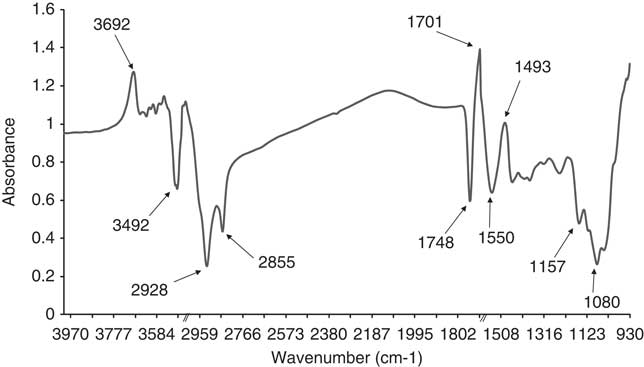
Figure 1 shows an example of MIR spectrum. A portion of the spectrum was truncated before the analysis due to its low signal-to-noise ratio (Pillonel et al., Reference Pillonel, Luginbuhl, Picque, Schaller, Tabacchi and Bosset2003); two spectra regions (3470 to 3040 cm−1 and 1700 to 1600 cm−1) were omitted from PLS analysis. The high level of noise at these wavelengths may be the consequence of the absorption of water in the spectral regions (Hewavitharana and Brakel, Reference Hewavitharana and Brakel1997; Jørgensen and Næs, Reference Jørgensen and Næs2004). The principal MIR regions used to estimate FA composition of milk were located between 1736 and 1805 cm−1 and between 2823 and 3016 cm−1. Coates (Reference Coates2000) and Lefèvre and Subirade (Reference Lefèvre and Subirade2000) indicated that 1745, 2928 and 2855 cm−1 are the frequencies correlated with the vibration of the FA carbonyl group. The wavenumbers between approximately 1050 and 1600 cm−1 are associated with several specific chemical bonds such as C–H bending (1493 cm−1) and C–O stretching. PCA of the untreated spectra allowed for the investigation of the influence plot and hence the identification of possible outliers.
Example of algorithm unprocessed MIR spectrum for milk.
Prediction models
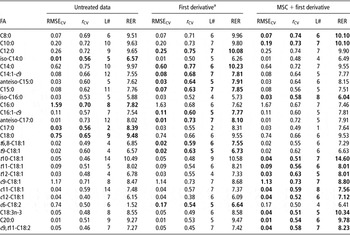
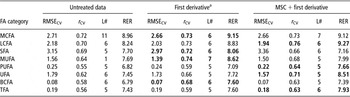
Tables 3 and 4 summarized the RMSECV, r CV, L and RER of each calibration equation built from spectra and FA contents. Prediction models were developed using spectra in several forms: untreated, first derivative and MSC plus first derivative giving three models for each predicted trait. A normalized and second derivative pre-treatment offered no improvement of prediction; hence, these results are not reported. The RMSECV, r CV and L were used to compare models for accuracy. If two models produced similar results for a given trait, the preferred model was that with the lowest RMSECV, the highest r CV and the lowest number of L.
PLS predictions for individual FA (expressed in g/kg of milk) using untreated and pretreated mid-infrared spectra (preferred model in bold)

PLS = partial least squares; FA = fatty acids; MSC = multiplicative scatter correction; RMSECV = root mean square error of cross-validation; r CV = coefficient of correlation of cross-validation; L = number of partial least squares loadings; RER = range error ratio.
aSavitzky–Golay, three data points each side.
PLS predictions for FA categories (expressed in g/kg of milk) using untreated and pretreated mid-infrared spectra (preferred model in bold)

PLS = partial least squares; FA = fatty acids; MSC = multiplicative scatter correction; RMSECV = root mean square error of cross-validation; r CV = coefficient of correlation of cross-validation; L = number of partial least squares loadings; RER = range error ratio; MCFA = medium-chain FA; LCFA = long-chain FA; SFA = saturated FA; MUFA = monounsaturated FA; PUFA = polyunsaturated FA; UFA = unsaturated FA; BCFA = branched-chain FA; TFA = trans FA.
aSavitzky–Golay, three data points each side.
Prediction models were calculated using FA concentration in milk and FA concentration in fat as reference data. Overall, the pre-treated MIR spectra with first derivative or MSC plus first derivative gave the best results. The PLS method using untreated spectra provided good outcomes only for the prediction of iso-C14:0, C16:0, C17:0 and C18:0.
The r CV of FA ranged from 0.51 (t10-C18:1 and C18:3n-3) to 0.77 (C14:0) for individual FA (Table 3), and from 0.63 (TFA) to 0.76 (LCFA) for groups of FA. Williams (Reference Williams2003) suggested that r CV between 0.70 and 0.80 indicate that discrimination between high and low values can be made. Prediction models for C8:0, C10:0, C12:0, C14:0, anteiso-C17:0, c9-C18:1, MCFA, LCFA, SFA, MUFA and UFA allowed for discrimination between high and low FA values. For these prediction models, the number of L ranged from five to seven; ideally, a lower number of L would be preferable. The RER values for models used to predict C8:0, C10:0, C12:0, C14:0, t10-C18:1, and C18:3n-3 showed fair practical utility (Williams, Reference Williams2001).
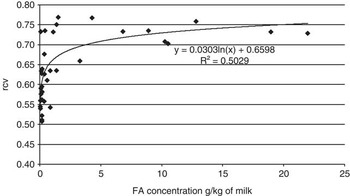
The relationship between FA concentration and modeling success is shown in Figure 2. Although major individual FA and FA groups (concentration > 5.0 g/kg of milk) presented acceptable r CV, the minor FA and categories exhibited quite variable results. In particular, MCFA and anteiso-C17:0 exhibited r CV similar to those of major FA and categories.
Relationship between fatty acids (expressed in g/kg of milk) and modeling success expressed as g/kg v. r CV (coefficient of correlation of cross-validation).

Discussion
FA composition
The FA composition of Brown Swiss milk was consistent with findings from Mele et al. (Reference Mele, Dal Zotto, Cassandro, Conte, Serra, Buccioni, Bittante and Secchiari2009) for Holstein Friesian cows reared in north Italy, but it was slightly lower than results reported by DePeters et al. (Reference DePeters, Medrano and Reed1995) on Brown Swiss milk in a study aimed at comparing the variation of FA composition among three breeds fed and managed similarly in the United States. Regarding the saturation of milk fat, as reported in Table 2, SFA was the most important group of FA followed by MUFA and PUFA; this is in accordance with the literature that reported a normal presence of SFA, MUFA and PUFA of 70%, 25% and 5%, respectively (Grummer, Reference Grummer1991). Regarding the chain length, the MCFA was the most represented group according to Jensen et al. (Reference Jensen, Ferris and Lammi-Keefe1991). The iso-C14:0, C18:3n-3, t10-C18:1, iso-C16:0 and c11-C18:1 showed the largest CV (0.47, 0.41, 0.38, 0.37 and 0.37, respectively). The CLA c9,t11-C18:2 showed lower CV than Mele et al. (Reference Mele, Dal Zotto, Cassandro, Conte, Serra, Buccioni, Bittante and Secchiari2009) and Stoop et al. (Reference Stoop, Van Arendonk, Heck, Van Valenberg and Bovenhuis2008).
Prediction models
Prediction models refer to FA concentration in milk (g/kg of milk), which provided better results with respect to prediction models developed for FA concentration in fat (data not shown). This could be explained by a different distribution of values of FA in milk and fat. Moreover, the prediction of FA by MIR is the combined effect of predicting fat content and fat composition and it is performed on milk samples, whereas the reference methods for FA determination (GC) is performed on fat extracted from milk, which means that their relationship is affected by the variation in fat percentage (Soyeurt et al., Reference Soyeurt, Dardenne, Lognay, Veselko, Mayeres and Gengler2006).
On average, the accuracy of the prediction models for major FA was better than for minor FA. This was found also by Soyeurt et al. (Reference Soyeurt, Dardenne, Lognay, Veselko, Mayeres and Gengler2006) and Rutten et al. (Reference Rutten, Bovenhuis, Hettinga, van Valenberg and van Arendonk2009), who reported a clear relationship between FA concentration and coefficient of determination (R 2).
Overall, the pre-treated MIR spectra with first derivative or MSC plus first derivative gave the best results; the same mathematical treatments were also the best to predict coagulation properties of milk (De Marchi et al., Reference De Marchi, Fagan, O'Donnell, Cecchinato, Dal Zotto, Cassandro, Penasa and Bittante2009b).
Predictions of FA from our study were slightly less accurate compared with Soyeurt et al. (Reference Soyeurt, Dardenne, Lognay, Veselko, Mayeres and Gengler2006) and Rutten et al. (Reference Rutten, Bovenhuis, Hettinga, van Valenberg and van Arendonk2009), probably because of less data availability and low variability of several FA. In particular, the accuracy of prediction models for C10:0, C12:0, C14:0, C16:0 and C18:0 were worse than prediction of the same FA in Soyeurt et al. (Reference Soyeurt, Dardenne, Lognay, Veselko, Mayeres and Gengler2006) and Rutten et al. (Reference Rutten, Bovenhuis, Hettinga, van Valenberg and van Arendonk2009); however, similar or better results were found for C8:0, C15:0, t11-C18:1, C18:3n-3, c9,t11-C18:2, t9-C18:1 and c11-C18:1. Regarding the categories of FA, we detected lower accuracy of prediction models for SFA, MUFA and UFA and similar accuracy for PUFA compared with results from Soyeurt et al. (Reference Soyeurt, Dardenne, Lognay, Veselko, Mayeres and Gengler2006). The differences in the accuracy of predictions compared with results reported in literature could be related to several reasons: the variability of the reference data (Rutten et al., Reference Rutten, Bovenhuis, Hettinga, van Valenberg and van Arendonk2009), the reference method to determine FA composition, the spectra treatments and statistical procedures used to develop the models.
The present study confirmed the potential of MIR for the rapid and non-destructive measurement of several FA. The proposed models are not enough accurate to be transferred to the dairy industry for quality control, but they might become interesting for breeding purposes. Recent studies on milk coagulation properties (Cecchinato et al., Reference Cecchinato, De Marchi, Gallo, Bittante and Carnier2009) and meat physical traits (Cecchinato et al., Reference Cecchinato, De Marchi, Penasa, Albera and Bittante2011) reported that, despite the accuracy of prediction models being quite low, the genetic response for these traits predicted by MIR was comparable with that obtained using the reference data. Thus, the implementation of models developed in the present study in routine milk recording schemes would allow for selection strategies aiming at improving the FA profile of milk.
Conclusion
The potential of MIR to predict several FA was demonstrated using individual milk samples. The prediction models developed for C8:0, C10:0, C12:0, C14:0, C16:0, anteiso-C17:0, c9-C18:1, MCFA, LCFA, SFA, MUFA and UFA were able to identify high and low values of these FA in milk. The methods using a first derivative or MSC plus first derivative resulted, on average, in the best predictions. Nevertheless, for some FA the improvement in the accuracy was negligible and thus untreated data might be used. However, results evidenced that MIR is not directly applicable to predict detailed milk FA for milk payment system, as suggested by other studies, but the implementation of such models might be evaluated in the future as a tool for breeding programs aimed at enhancing FA content of milk.
Acknowledgements
The authors want to thank the Italian Ministry of University and Research for financial support (PRIN2005-prot. 2005074889_002).