Introduction
The growth of epitaxial graphene (EG) on silicon carbide (SiC) has been established as one of the most promising methods for obtaining large graphene samples (also see the introductory article in this issue, as well as the articles by Ruan et al. and Nyakiti et al.). On the two SiC basal plane surfaces, SiC(0001) and SiC $(000\overline 1 )$, large crystalline regions of graphene can be prepared with homogeneous thickness and uniform properties.
Notably, the two crystal faces are characterized by dramatically different growth modes for graphene. On SiC(0001) (the so-called Si face), graphene layers develop in a well-defined epitaxial relationship to the SiC substrate, and additional layers of graphene emerge with the same rotational orientation, so that both monolayer graphene and electronically coupled few-layer graphene (FLG) slabs can be prepared.Reference Emtsev, Speck, Seyller, Ley and Riley1, Reference Riedl, Zakharov and Starke2 In contrast, on SiC $(000\overline 1 )$(the so-called C face), graphene layers exhibit a varying rotational relationship with respect to the substrate, and in particular, subsequent layers typically assume different rotational orientations, so that stacks of graphene monolayers emerge.Reference Berger, Song, Li, Wu, Brown, Naud, Mayou, Li, Hass, Marchenkov, Conrad, First and de Heer3
The reason for this difference appears to be the strongly differing strengths of the interactions between EG and the SiC substrate on the two surfaces. On SiC $(000\overline 1 )$, the rather weak influence of the substrate leads to almost charge-neutral graphene layers, a fact that has been extensively exploited to investigate the remarkable electronic properties of graphene on a wafer size scale.Reference First, de Heer, Seyller, Berger, Stroscio and Moon4 However, it also leads to an undefined rotational orientation of the first grown layer with respect to the substrate and even rotational disorder among different patches of the first graphene layer.Reference Hiebel, Mallet, Varchon, Magaud and Veuillen5, Reference Starke and Riedl6
In contrast, on SiC(0001), strong coupling between EG and the substrate fixes the epitaxial angle of each layer.Reference Emtsev, Speck, Seyller, Ley and Riley1 This interaction leads to covalent bonds between the topmost silicon atoms of SiC and the initial carbon layer grown. Because of these bonds, this initial carbon layer does not have a delocalized π-band system. The layer is rather electronically inactive and is therefore often called zero-layer graphene (ZLG). When thicker slabs of graphene are grown, the layer closest to the substrate assumes this ZLG structure and serves as a buffer layer for the layers above; it is only for these additional layers that the typical π bands for monolayer graphene (MLG), bilayer graphene (BLG), and so forth appear. Most importantly, the bond configuration of the coupling between ZLG and SiC induces considerable n-doping in the overlying graphene layers. As-grown MLG on SiC(0001), for instance, has a charge carrier concentration of n ≈ 1 × 1013 cm–2.
This review focuses on graphene grown on SiC(0001) and, in particular, on the possibilities for engineering the electronic structure of the graphene layers. For this purpose, we use work from our group to explain details of the methodology, augmented by a review of other efforts carried out on this topic. In the next two sections, we discuss growth techniques and present the properties of the SiC–graphene interface, thereby providing the basis to understand such manipulation techniques. The subsequent section describes a technique used to counter the intrinsic n-doping effect, namely, transfer doping from an adlayer material deposited on top of the graphene–SiC structure, which is outlined for the case of an electronegative molecule.Reference Coletti, Riedl, Lee, Patthey, Klitzing, Smet and Starke7 However, this approach can treat only the symptoms of the interfacial interaction: The interface donates charge into the graphene layer, and the attached species counter these charges. To eliminate the undesired influence of the interface, its bonding configuration has to be modified. This can be achieved by intercalating foreign elements between graphene and SiC, so that the graphene layers become decoupled from the substrate. Different means to achieve this goal are discussed in the final part of this review. Specifically, intercalation of hydrogen saturates the silicon dangling bonds of the topmost SiC bilayer, so that the covalent bonding of the carbon layer to the substrate is eliminated.Reference Riedl, Coletti, Iwasaki, Zakharov and Starke8, Reference Forti, Emtsev, Coletti, Zakharov, Riedl and Starke9 Germanium forms a new interface layer by itself and, in this way, decouples the graphene layer from the substrate.Reference Emtsev, Zakharov, Coletti, Forti and Starke10 By tailoring the germanium layer, one can tune the electronic properties of the emerging decoupled graphene layers and stabilize p–n junctions on a mesoscopic scale.
Sample preparation, graphene growth, and experimental techniques
The common technique for growing EG layers on SiC(0001) is annealing-induced sublimation of silicon from the surface. For this process, SiC(0001) wafer pieces of different polytypes are used with so-called on-axis orientation. For surface studies on the graphene layers, the SiC substrates must be doped with nitrogen to a typical level in the range of 1017–1018 cm–3, because only such samples have sufficient conductivity for electron-based surface-science techniques. Alternatively, graphene on SiC(0001) has been prepared by carbon deposition aiding the sublimation process, either by molecular beam epitaxyReference Al-Temimy, Riedl and Starke11–Reference Maeda and Hibino13 or by chemical vapor deposition.Reference Strupinski, Grodecki, Wysmolek, Stepniewski, Szkopek, Gaskell, Grüneis, Haberer, Bozek, Krupka and Baranowski14
The 4H- and 6H-SiC wafers used in our experiments were purchased from SiCrystal. We make sure to always have less than 0.1° misalignment from the basal-plane normal. Starting from the mechanically polished wafer pieces, atomically flat SiC surfaces can be obtained by an initial hydrogen etching process.Reference Soubatch, Saddow, Rao, Lee, Konuma and Starke15–Reference Ramachandran, Brady, Smith, Feenstra and Greve17 This can be achieved by inductively heating the SiC samples by radio-frequency (RF) waves to about 1400°C in a quartz-glass reactor under a flow of palladium-purified molecular hydrogen at about 500–1000 mbar. An alternative or supplementary possibility is to smooth the samples by chemical-mechanical polishing. The 3C-SiC(111) samples used in one of the experiments described in the later section “Hydrogen intercalation” were grown by a physical vapor-transport technique on a 4H-SiC(0001) substrate that was subsequently removed to obtain a pure 3C-SiC bulk crystal.Reference Chaussende, Latu-Romain, Auvray, Ucar, Pons and Madar18
Graphene is grown on top of SiC substrates by thermal decomposition of SiC, whereby the silicon atoms of the topmost SiC layers sublimate and the remaining carbon atoms form the typical graphene honeycomb structure. If the growth is carried out under ultrahigh vacuum (UHV), as in early experiments,Reference Emtsev, Speck, Seyller, Ley and Riley1, Reference Riedl, Zakharov and Starke2, Reference Ohta, Bostwick, McChesney, Seyller, Horn and Rotenberg19, Reference Riedl, Starke, Bernhardt, Franke and Heinz20 surface-science characterization can be done in situ in the same chamber. However, the resulting graphene layers are not very homogeneous.Reference Riedl, Starke, Bernhardt, Franke and Heinz20–Reference Ohta, El Gabaly, Bostwick, McChesney, Emtsev, Schmid, Seyller, Horn and Rotenberg25 To obtain high-quality and homogeneous EG layers, the graphene growth must be performed in a furnace at higher pressures.Reference Emtsev, Bostwick, Horn, Jobst, Kellogg, Ley, McChesney, Ohta, Reshanov, Rotenberg, Schmid, Waldmann, Weber and Seyller26–Reference de Heer, Berger, Ruan, Sprinkle, Li, Hu, Zhang, Hankinson and Conrad28 In a typical approach, which is also used in our laboratory, the SiC samples are annealed in a quartz-glass chamber by RF heating under an argon atmosphere (RF/Ar),Reference Emtsev, Bostwick, Horn, Jobst, Kellogg, Ley, McChesney, Ohta, Reshanov, Rotenberg, Schmid, Waldmann, Weber and Seyller26 which indeed yields much smoother graphene layers than UHV growth.Reference Forti, Emtsev, Coletti, Zakharov, Riedl and Starke9, Reference Emtsev, Bostwick, Horn, Jobst, Kellogg, Ley, McChesney, Ohta, Reshanov, Rotenberg, Schmid, Waldmann, Weber and Seyller26 The thickness of the emerging graphene slab depends on the annealing temperature. With increasing annealing temperature, the carbon interface layer or zero-layer graphene (ZLG), a graphene monolayer, and thicker graphene films can, in turn, be prepared. The surface morphology and thickness of the emerging graphene samples must be characterized precisely, for which different techniques can be used, such as atomic force microscopy, x-ray photoelectron spectroscopy (XPS), angle-resolved photoemission spectroscopy (ARPES), low-energy electron diffraction (LEED), and low-energy electron microscopy (LEEM).Reference Riedl, Zakharov and Starke2, Reference Starke and Riedl6, Reference Riedl, Starke, Bernhardt, Franke and Heinz20, Reference Riedl, Coletti and Starke29
When hydrogen was intercalated under the graphene layer, as discussed in the later section “Hydrogen intercalation,” the samples were again annealed in the presence of molecular hydrogen at pressures close to 1 bar using the same quartz-glass chamber system at ∼800°C.Reference Riedl, Coletti, Iwasaki, Zakharov and Starke8, Reference Forti, Emtsev, Coletti, Zakharov, Riedl and Starke9 This method has also been employed by other groups,Reference Speck, Ostler, Roehrl, Jobst, Waldmann, Hundhausen, Ley, Weber and Seyller30–Reference Robinson, Hollander, LaBella, Trumbull, Cavalero and Snyder35 and one group used atomic hydrogen to decouple ZLG and MLG in situ in UHV.Reference Virojanadara, Zakharov, Yakimova and Johansson36, Reference Watcharinyanon, Virojanadara, Osiecki, Zakharov, Yakimova, Uhrberg and Johansson37 In all stages described so far, the samples are always stable in air and can be investigated after only mild outgassing at about 300°C following transfer into the UHV analysis chamber. In contrast, intercalation of germanium and alkali and transition metals is always carried out directly in UHV by depositing the intercalant on the graphene samples from evaporators or Knudsen cells and then annealing.
In the experiments by our group, the electronic structure and doping level of the graphene layers were analyzed by ARPES in a laboratory-based setup at the Stuttgart Institute using monochromatic helium II radiation (hν = 40.8 eV) from a UV discharge source or at the Surface and Interface Spectroscopy (SIS) high-resolution photoemission spectroscopy (HRPES) beamline of the Swiss Light Source (SLS) of the Paul-Scherrer-Institute (PSI) in Villigen, Switzerland, using synchrotron radiation. The chemistry and spatial formation of the graphene layers and areas of different thicknesses were studied by LEEM, photoelectron emission microscopy (PEEM), micro-LEED, and micro-XPS using the ELMITEC III instrument at beamline I311 of the MAX-Lab synchrotron radiation facility in Lund, Sweden.
The interface between SiC and graphene
The SiC(0001) surface is terminated by a SiC bilayer of hexagonal symmetry, in which each silicon atom in the upper sublayer is coordinated to three carbon atoms in the lower sublayer. The surface forms a hexagonal unit cell with unit vectors of 3.08-Å length that contains one silicon atom and one carbon atom, as displayed in Figure 1a. Because each silicon atom in the top layer of a bulk terminated surface contributes one dangling bond, a bulk truncated surface is not energetically favorable. Energy minimization leads to a variety of stable surface reconstructions of different stoichiometries ranging from silicon-rich to carbon-rich compositions.Reference Starke, Choyke, Matsunami and Pensl38
(a) Schematic model of the SiC(0001) unit cell (red diamond) in top view. (b) Schematic model of a graphene layer, where the unit cell is indicated by the green diamond. (c) Superposition of a SiC layer and a graphene layer with a 30° mutual rotation. The carbon atoms in SiC and in graphene [C(gr)] are presented in different colors to distinguish the two layers. (d) Commensurate  $(6\sqrt 3 \times 6\sqrt 3 )R30^\circ $ superstructure of graphene on SiC(0001), where the unit cell is indicated by the yellow diamond. (e) Low-energy electron diffraction (LEED) pattern of
 $(6\sqrt 3 \times 6\sqrt 3 )R30^\circ $ reconstructed zero-layer graphene (ZLG) on SiC(0001), with first-order diffraction spots of SiC and graphene indicated (primary beam energy = 126 eV) (adapted from Reference Reference Riedl, Coletti, Iwasaki, Zakharov and Starke8). (f) Micro-x-ray photoelectron spectroscopy (μ-XPS) of the carbon 1s core level of ZLG with SiC bulk component and two components of the ZLG carbon layer, S1 and S2, representing carbon atoms with and without covalent bonds to the SiC substrate, respectively (photon energy = 380 eV) (adapted from Reference Reference Forti, Emtsev, Coletti, Zakharov, Riedl and Starke9).

A monolayer of graphene consists of a honeycomb lattice with two carbon atoms per unit cell (Figure 1b). With a unit vector length of 2.46 Å, the graphene unit cell cannot easily be arranged epitaxially on the SiC substrate. Yet, rotated by 30°, as sketched in Figure 1c, a graphene layer can arrange itself with negligible lattice mismatch on top of SiC(0001) in a commensurate  $(6\sqrt 3 \times 6\sqrt 3 )R30^\circ $ superlattice, as shown in Figure 1d. This situation corresponds to the most carbon-rich reconstruction present on the SiC(0001) surface and represents the first step toward EG growth on this substrate. The difference in the densities of carbon atoms in the SiC substrate bilayer and the
 $(6\sqrt 3 \times 6\sqrt 3 )R30^\circ $ carbon layer requires about three SiC layers (nominally 3.13) to be decomposed for the development of a full
 $(6\sqrt 3 \times 6\sqrt 3 )R30^\circ $ overlayer. The periodicity of the coincidence lattice (often called a moiré pattern) can be observed in the corresponding LEED pattern (Figure 1e).Reference Emtsev, Speck, Seyller, Ley and Riley1, Reference Riedl, Starke, Bernhardt, Franke and Heinz20
The high intensity of the  $(6\sqrt 3 \times 6\sqrt 3 )R30^\circ $ superstructure spots indicates the presence of a notable reconstruction, namely, a strong buckling in the carbon layer.Reference Riedl, Coletti and Starke29 The reconstruction is a result of the fact that the carbon layer is connected to the SiC substrate by covalent bonds. Because of the higher atomic density in the carbon layer as compared to the SiC layer and the varying local registry of the individual carbon and silicon atoms at the interface, as seen in Figure 1d, only a fraction of the carbon atoms are involved in the covalent bonding. The two different bond environments of the carbon atoms in the
 $(6\sqrt 3 \times 6\sqrt 3 )R30^\circ $ supercell can, in fact, be observed as two distinct components in the carbon 1s core-level x-ray photoelectron spectrum,Reference Emtsev, Speck, Seyller, Ley and Riley1, Reference Riedl, Coletti and Starke29 as shown in Figure 1f. About 30% of the surface peak intensity (component S1 in Figure 1f) is attributed to the bonded carbon atoms.
Because such a large fraction of the pz orbitals in this initial carbon layer are involved in covalent bonding, the layer does not exhibit the electronic properties of graphene. This is true despite the fact that, structurally, this layer is equivalent to a graphene layer with the carbon atoms arranged in a honeycomb lattice, as recently confirmed by scanning tunneling microscopy (STM).Reference Goler, Coletti, Piazza, Pingue, Colangelo, Pellegrini, Emtsev, Forti, Starke, Beltram and Heun39 At the  $\bar K$ point of the graphene Brillouin zone, where one expects the π bands of graphene to be visible by ARPES, only two diffuse surface states of the
 $(6\sqrt 3 \times 6\sqrt 3 )R30^\circ $ reconstruction can be seen close to the Fermi level,Reference Emtsev, Speck, Seyller, Ley and Riley1, Reference Emtsev, Zakharov, Coletti, Forti and Starke10, Reference Riedl, Coletti and Starke29 as shown in Figure 2a. The lack of well-defined π bands is, in fact, why this layer is commonly called zero-layer graphene (ZLG).
(a–c) Valence-band maps (energy versus electron momentum ky in the azimuthal direction perpendicular to  $\overline {\Gamma K} $) measured at the
 $\bar K$ point of the graphene Brillouin zone with angle-resolved photoemission spectroscopy (ARPES) for (a) ZLG, showing non-dispersing surface states of the
 $(6\sqrt 3 \times 6\sqrt 3 )R30^\circ $ reconstruction (contrast enhanced) (adapted from Reference Reference Emtsev, Zakharov, Coletti, Forti and Starke10), and for (b) monolayer graphene (MLG) (adapted from Reference Reference Forti, Emtsev, Coletti, Zakharov, Riedl and Starke9) and (c) bilayer graphene (BLG), showing one and two sets of π bands, respectively. (d) Sketch of the graphene Brillouin zone (hexagon) with high-symmetry points indicated (
 $\overline \Gamma$,
 $\overline K $,
 $\overline M $). The dashed arrows represent the reciprocal unit vectors b1 and b2. The blue (horizontal) arrow corresponds to the ARPES measurement direction along the
 $\overline {\Gamma K} $ direction (kx), and the red (vertical) line corresponds to the perpendicular measurement direction (ky).

The formation of a second carbon layer proceeds by further decomposition of SiC (which is already covered by a carbon layer). The new carbon layer emerges underneath the existing carbon film and assumes the same interface properties as described for ZLG.Reference Emtsev, Speck, Seyller, Ley and Riley1, Reference Hannon, Copel and Tromp40 The former ZLG instead becomes decoupled from the substrate. As a consequence, it now behaves as a true graphene monolayer and displays π bands with the typical linear Dirac-like dispersion.
The bond configuration at the ZLG–SiC interface induces an n doping of n ≈ 1 × 1013 cm–2 in this graphene monolayer. Accordingly, in MLG, the Fermi energy, E F, is displaced from the neutrality level known as the Dirac point (the crossing point of the π bands, with an energy of E D) by about 420 meV as measured by ARPESReference Riedl, Zakharov and Starke2, Reference Forti, Emtsev, Coletti, Zakharov, Riedl and Starke9, Reference Bostwick, Ohta, Seyller, Horn and Rotenberg41, Reference Zhou, Gweon, Fedorov, First, de Heer, Lee, Guinea, Castro Neto and Lanzara42 (Figure 2b). It is this doping that needs to be controlled to exploit the unique properties of graphene (e.g., ambipolar transport) for epitaxial layers on SiC(0001).
To extract the excess electrons from the graphene layer, one approach is to compensate the electron doping by means of transfer doping with holes, which is accomplished by depositing electronegative elements on top of the graphene. Eventually, charge neutrality (E D ≈ E F) can be reached, as described in the next section. Instead of just countering the doping, a more complete approach is to eliminate the interface and its influence by decoupling the graphene layers through intercalation of foreign atomic species between graphene and the substrate, as discussed in detail in the later section “Intercalation”.
For completeness, we note that, for AB-stacked graphene bilayers, two π-band branches exist in both the conduction and valence bands, because of the electronic coupling among twice the number of electrons. For epitaxial BLG on SiC(0001), the influence of the bonding at the interface is similar to that in the case of MLG and also causes an intrinsic n doping that results in a band shift of about 0.3 eV.Reference Ohta, Bostwick, Seyller, Horn and Rotenberg43 In addition, the electric dipole present at the graphene–SiC interface imposes an electric field perpendicular to the graphene plane. As a consequence, a bandgap of about 100 meV opens between the valence and conduction bands (i.e., at E D but below E F because of the doping).Reference Ohta, Bostwick, Seyller, Horn and Rotenberg43 The corresponding π-band structure as measured by ARPES is shown in Figure 2c.
Transfer doping
Intrinsic doping, if present at the surface of a two-dimensional conductor, can be compensated by extracting the excess carriers through transfer doping.Reference Coletti, Riedl, Lee, Patthey, Klitzing, Smet and Starke7, Reference Ristein44–Reference Gierz, Riedl, Starke, Ast and Kern46 For this purpose, an additional layer of electron-acceptor species must be placed on top of the EG sample, for example, by deposition of elemental antimony or bismuth. The Fermi energy shifts closer to the Dirac point.Reference Gierz, Riedl, Starke, Ast and Kern46 However, even with a full atomic layer, charge neutrality cannot be reached.
In contrast, full compensation of the excess negative charge is possible by molecular functionalization of the graphene surface. As an example, we used the strong electron-acceptor molecule tetrafluorotetracyanoquinodimethane (F4-TCNQ). With an electron affinity of 5.24 eV, F4-TCNQ provided charge neutrality upon deposition of the equivalent of a full molecular layer.Reference Coletti, Riedl, Lee, Patthey, Klitzing, Smet and Starke7 The F4-TCNQ molecules were deposited by thermal evaporation from a resistively heated crucible under UHV, so that the progressive counterdoping could be monitored in situ by ARPES without exposing the sample to air. As noted in the preceding section, for an as-grown monolayer of graphene on SiC(0001), E F is located about 420 meV above E D (n ≈ 1013 cm–2). For increasing amounts of deposited F4-TCNQ, E F was found to move toward E D, corresponding to electron transfer from the graphene layer to the molecular layer. After deposition of a 0.8-nm-thick layer of molecules, charge neutrality was reached (i.e., E F = E D).Reference Coletti, Riedl, Lee, Patthey, Klitzing, Smet and Starke7
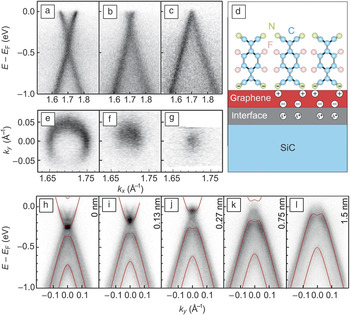
The modifications in the π-band dispersion as measured by ARPES are plotted in Figure 3a–c for a clean graphene monolayer, an intermediate F4-TCNQ coverage, and charge-transfer saturation at full coverage, respectively. For a nominal molecular-film thickness above 0.8 nm, no additional shift of the Fermi energy was observed, which indicates charge-transfer saturation.Reference Coletti, Riedl, Lee, Patthey, Klitzing, Smet and Starke7 Additional core-level photoemission measurements indicated that only two of the four CN groups of the F4-TCNQ molecule were involved in the charge-transfer process,Reference Coletti, Riedl, Lee, Patthey, Klitzing, Smet and Starke7 which suggests an upright or at least upward-tilted orientation, as sketched in Figure 3d. Notably, the thickness of 0.8 nm, when charge transfer saturates, corresponds to a close-packed layer of upright molecules.
Transfer doping of epitaxial graphene on SiC(0001) by tetrafluorotetracyanoquinodimethane (F4-TCNQ) deposition. (a–c) π-band dispersions in the kx direction showing the shift in the Fermi energy E F toward the Dirac point at E D for (a) pristine (as-grown) MLG, (b) intermediate F4-TCNQ coverage, and (c) F4-TCNQ saturation (circularly polarized light, 30 eV). (d) Schematic structure of a F4-TCNQ layer deposited on top of a graphene layer grown on SiC. The charges induced in the graphene layer due to the interface dipole and the molecular charge transfer are indicated. (e–g) Constant-energy maps at E F, showing the shrinking of the Fermi disk, for the same coverages as in (a)–(c): (e) pristine MLG, (f) intermediate F4-TCNQ coverage, and (g) F4-TCNQ saturation. (h–l) π-band dispersions (along ky) for (h) BLG without F4-TCNQ coverage and (i–l) BLG with increasing F4-TCNQ deposition (UV source, 40.8 eV). Bands calculated within a tight-binding model are superimposed (red solid curves) on the experimental data (adapted from Reference Reference Coletti, Riedl, Lee, Patthey, Klitzing, Smet and Starke7).

By evaluating high-resolution Fermi surface maps, quantitative values for the carrier concentrations can be obtained as 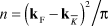 $n = {{\left( {{\bf{k}}_{\rm{F}} - {\bf{k}}_{\bar K} } \right)^2 } \mathord{\left/ {\vphantom {{\left( {{\bf{k}}_{\rm{F}} - {\bf{k}}_{\bar K} } \right)^2 } {\rm{\pi }}}} \right. \kern-\nulldelimiterspace} {\rm{\pi }}}$, where
 ${\bf{k}}_{\bar K} $ is the wave vector at the boundary of the graphene Brillouin zone and kF is the wave vector of the Fermi surface pocket. Constant-energy maps at E F are shown in Figure 3e–g for the same series as shown in Figure 3a–c. The k-vector values for the evaluation of n were extracted using Lorentzian fits of the maxima of the momentum distribution curves of the electronic dispersion spectra. The resulting carrier concentrations were 7.3 × 1012 cm–2, 9 × 1011 cm–2, and 1.5 × 1011 cm–2 for the clean graphene monolayer and the intermediate and higher F4-TCNQ coverages, respectively, with an error estimate of Δn ≈ ±2 × 1011 cm–2 from the variance of the Lorentzian fits.Reference Coletti, Riedl, Lee, Patthey, Klitzing, Smet and Starke7 Note that this error value is rather close to the minimum detectable carrier concentration, which we estimated to be ∼1 × 1011 cm–2, corresponding to a resolution in momentum space of Δk ≈ 0.005 Å–1.Reference Emtsev, Zakharov, Coletti, Forti and Starke10
The transfer-doping scheme can also be applied to epitaxial BLG. As for the monolayer, F4-TCNQ deposition onto bilayer graphene induces a shift of the Fermi energy, that is, a reduction of the intrinsic n-type doping. This is illustrated by the dispersion plots in Figure 3h–l. In the plots, bands obtained from tight-binding calculations are superimposed on the experimental spectra (see Reference Reference Coletti, Riedl, Lee, Patthey, Klitzing, Smet and Starke7 for details), which facilitates an analytical evaluation of the Dirac energy position and the size of the bandgap. As E F shifted closer to E D, the sample became a true semiconducting bilayer (i.e., the Fermi energy moved into the bandgap) for a molecular-layer thickness of 0.4 nm.
Notably, in addition to achieving transfer doping, the same deposition process simultaneously increased the bandgap, which can be attributed to the growing electric field across the bilayer slab caused by the additional dipole developing at the graphene–F4-TCNQ interface. As evaluated from the simulated bands, the bandgap rose from 116 meV for a clean as-grown bilayer to 275 meV upon deposition of a 1.5-nm-thick layer of F4-TCNQ molecules. At this thickness level, the change of the band parameters became saturated, indicating the completion of charge transfer.Reference Coletti, Riedl, Lee, Patthey, Klitzing, Smet and Starke7
Intercalation
Hydrogen intercalation
As an alternative to transfer doping, a more complete, and also more elegant, approach is to suppress the influence of the interface entirely by decoupling the ZLG from the SiC(0001) substrate. This is indeed possible by processing the pristine (as-grown) ZLG or graphene layers in a hydrogen atmosphere at elevated temperatures. Hydrogen intercalates between the ZLG and the SiC substrate, so that the covalent bonds are broken and the topmost silicon atoms are passivated by hydrogen. Thus, the carbon interface layer is decoupled from the substrate, and for example, a ZLG film is converted into quasi-free-standing monolayer graphene (QFMLG).Reference Riedl, Coletti, Iwasaki, Zakharov and Starke8, Reference Speck, Ostler, Roehrl, Jobst, Waldmann, Hundhausen, Ley, Weber and Seyller30, Reference Riedl, Coletti, Iwasaki, Zakharov and Starke47
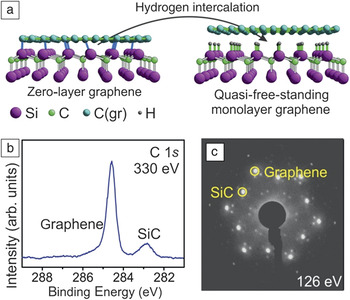
Sketches of the bond configurations in ZLG before treatment and in QFMLG after treatment are shown in Figure 4a. The structural decoupling is manifested by a change in the carbon 1s core-level emission (Figure 4b). The components due to the covalent interface–SiC bonding (cf. Figure 1f) vanish, and a sharp peak emerges corresponding to a homogeneous, purely sp Reference Riedl, Zakharov and Starke2-bonded carbon layer. Also, the intense superstructure spots (cf. Figure 1e) of the reconstruction are weakened, and the LEED pattern is dominated by the independent integer-order diffraction spots of SiC and graphene, as shown in Figure 4c.
(a) Schematic model of ZLG and quasi-free-standing monolayer graphene (QFMLG) after hydrogen intercalation. (b) μ-XPS of the carbon 1s core level in QFMLG, showing no evidence of the multiple peaks in Figure 1f related to ZLG–substrate bonding, and (c) LEED pattern of QFMLG, showing only weak reconstruction-related peaks, unlike in Figure 1e (adapted from Reference Reference Forti, Emtsev, Coletti, Zakharov, Riedl and Starke9).

Whereas the initial observation of the decoupling process by hydrogen intercalation was made using more disordered UHV-grown graphene samples,Reference Riedl, Coletti, Iwasaki, Zakharov and Starke8 the development of the band structure was thoroughly investigated using more homogeneous furnace-grown samples.Reference Forti, Emtsev, Coletti, Zakharov, Riedl and Starke9, Reference Bostwick, Speck, Seyller, Horn, Polini, Asgari, MacDonald and Rotenberg31, Reference Walter, Bostwick, Jeon, Speck, Ostler, Seyller, Moreschini, Chang, Polini, Asgari, MacDonald, Horn and Rotenberg32 Furthermore, the influence of the substrate polytype on the hydrogen intercalation process was investigated using RF/Ar-grown ZLG layers on 6H-SiCReference Forti, Emtsev, Coletti, Zakharov, Riedl and Starke9 and 3C-SiC.Reference Coletti, Emtsev, Zakharov, Ouisse, Chaussende and Starke48Figure 5a shows the resulting band structure for QFMLG on 6H-SiC(0001).
(a–b) ARPES measurements of the π bands of QFMLG after hydrogen intercalation on 6H-SiC(0001) (a) after mild outgassing and (b) after annealing at 700°C. (c) Scanning tunneling microscopy image obtained after annealing at 750°C, indicating re-emerging ZLG patches (upper left and right, showing the  $(6\sqrt 3 \times 6\sqrt 3 )R30^\circ $surface reconstruction) within the QFMLG terrace (graphene on 6H-SiC) (adapted from Reference Reference Forti, Emtsev, Coletti, Zakharov, Riedl and Starke9). (d) π bands of QFMLG after hydrogen intercalation on 3C-SiC(111) (adapted from Reference Reference Coletti, Emtsev, Zakharov, Ouisse, Chaussende and Starke48).

In the decoupled graphene films, the strong n-type doping induced in pristine graphene layers by the SiC–graphene interface is suppressed. We note, however, that the quasi-free-standing layers are not exactly charge-neutral. QFMLG on 6H-SiC(0001) exhibits a significant p doping that can reach up to 4 × 1012 cm–2, corresponding to a shift of E F to 300 meV below E D.Reference Walter, Bostwick, Jeon, Speck, Ostler, Seyller, Moreschini, Chang, Polini, Asgari, MacDonald, Horn and Rotenberg32
The exact doping level can vary somewhat. This variation is currently attributed to possible instabilities of the intercalation process itself, such as the presence of isolated unsaturated silicon dangling bonds that counterdope the p carriers with n charge, and also to the presence of chemisorbed species from air. Indeed, we found that, starting from a fully intercalated sample, isolated hydrogen atoms could be partially desorbed upon annealing at ∼700°C. As a consequence, presumably through this charge injection connected to single sites, the π bands are gradually filled until charge neutrality (E F = E D) is reachedReference Forti, Emtsev, Coletti, Zakharov, Riedl and Starke9 (Figure 5b).
Only at a slightly higher temperature of about 750°C did larger surface areas de-intercalate coherently and retransform into patches of ZLG structure.Reference Forti, Emtsev, Coletti, Zakharov, Riedl and Starke9 Correspondingly, the  $(6\sqrt 3 \times 6\sqrt 3 )R30^\circ $ corrugation was observed by STM in islands embedded in a flat QFMLG environment,Reference Forti, Emtsev, Coletti, Zakharov, Riedl and Starke9 as displayed in Figure 5c.
Interestingly, in graphene grown on 3C-SiC(111), E F was always found to be slightly above E D (Figure 5d), corresponding to a weak n-type doping of about 1 × 1012 cm–2.Reference Coletti, Emtsev, Zakharov, Ouisse, Chaussende and Starke48 A possible explanation for this difference was recently put forward by Ristein et al.,Reference Ristein, Mammadov and Seyller49 who argued that the spontaneous polarization of the hexagonal SiC polytypes, notably 4H and 6H, due to their pyroelectric character induces an effect equivalent to having a layer of positive charge at the interface, which they called “pseudocharge.” As a consequence, an image charge is induced in the graphene layer. In contrast, for cubic 3C-SiC, this effect is absent for symmetry reasons.
In addition to shifting the Fermi level, intercalation has a profound influence on the detailed band-structure parameters. Thus, for instance, one finds a renormalization of the π-band velocity of about 3% at energies approximately 200 meV below the Fermi level, which originates from electron–phonon interactions. (See also the article in this issue by Hicks and Conrad.)
Simulation of the spectral function observed in the experiments allowed analysis of the coupling of the Dirac electrons to different quasiparticles in different energy regimes.Reference Forti, Emtsev, Coletti, Zakharov, Riedl and Starke9, Reference Bostwick, Ohta, Seyller, Horn and Rotenberg41 Through intentional n doping of hydrogen-intercalated QFMLG samples on SiC(0001), so-called plasmarons, representing the interaction of plasmons with electron–hole pairs, were observed by ARPES for the first time.Reference Bostwick, Speck, Seyller, Horn, Polini, Asgari, MacDonald and Rotenberg31, Reference Walter, Bostwick, Jeon, Speck, Ostler, Seyller, Moreschini, Chang, Polini, Asgari, MacDonald, Horn and Rotenberg32 It should be noted that the process of hydrogen intercalation is not restricted to the initial ZLG on SiC. Rather, the interface layer can be decoupled for mono- and bilayer graphene as well, yielding quasi-free-standing bilayer (QFBLG) and trilayer (QFTLG) graphene, respectively.Reference Riedl, Coletti, Iwasaki, Zakharov and Starke8, Reference Virojanadara, Zakharov, Yakimova and Johansson36, Reference Coletti, Forti, Principi, Emtsev, Zakharov, Daniels, Daas, Chandrashekhar, Ouisse, Chaussende, Polini and Starke50
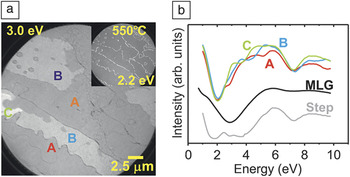
Combining RF/Ar-furnace growth of pristine ZLG or graphene with decoupling through hydrogen intercalation can produce highly homogeneous quasi-free-standing graphene layers with atomically flat terraces over several micrometers.Reference Forti, Emtsev, Coletti, Zakharov, Riedl and Starke9 This was demonstrated by LEEM, as shown in Figure 6a. The majority of the displayed surface area appears gray in the figure (more than 90%), with subtle differences in the LEEM intensity level between different terraces.
(a) Low-energy electron microscopy (LEEM) images of QFMLG outgassed at 550°C measured at a primary electron energy of 3.0 eV (25-μm field of view). Inset: Same surface area imaged at 2.2 eV, to enhance step positions (white lines). (b) LEEM reflectivity spectra averaged over areas with similar contrast, indicated by A, B, and C in panel (a). Additional spectra were obtained at the dark lines (white in the inset) between QFMLG terraces in panel (a) (labeled “Step”) and from a large-area pristine graphene monolayer (labeled “MLG”) (adapted from Reference Reference Forti, Emtsev, Coletti, Zakharov, Riedl and Starke9).

The number of graphene layers in different areas can be determined by measuring LEEM reflectivity curves as outlined by Hibino et al.Reference Hibino, Kageshima, Maeda, Nagase, Kobayashi and Yamaguchi51 In thin graphene slabs, the low reflectivity in the energy range of the graphitic conduction band (ca. 0–7 eV) shows interference minima and maxima, with the number of dips corresponding to the number of layers. A corresponding spectrum acquired from a large-area pristine graphene monolayer sample is displayed in black (middle curve) in Figure 6b and shows one dip at ∼2.8 eV.Reference Forti, Emtsev, Coletti, Zakharov, Riedl and Starke9 The LEEM reflectivity curves taken from different terraces (A–C) of the area displayed in Figure 6a are shown in Figure 6b. They all show one dip in the corresponding energy range, confirming that all of these areas represent QFMLG.Reference Forti, Emtsev, Coletti, Zakharov, Riedl and Starke9 The additional dip slightly above 7 eV is not related to this interference phenomenon, but its origin is not yet understood.Reference Forti, Emtsev, Coletti, Zakharov, Riedl and Starke9
The slight contrast differences for different terraces in the LEEM image (Figure 6a) can be attributed to residual deviations from sample alignment in the normal orientation in the LEEM apparatus. Notably, the minimum energy in the reflectivity curve for QFMLG is different from that of pristine MLG on SiC(0001).Reference Forti, Emtsev, Coletti, Zakharov, Riedl and Starke9 Small inclusions and lines, which are mainly restricted to the boundaries between different substrate terraces, are imaged with dramatically different contrast (more visible as white lines in the inset of Figure 6a, which shows the same surface area imaged at a different electron energy). Reflectivity spectra taken from the dark lines in Figure 6a (white in the inset) display two minima at ∼1.5 eV and ∼4 eV (gray curve in Figure 6b), which unambiguously identifies these areas as small inclusions of quasi-free-standing bilayer graphene, cf. Reference Reference Riedl, Coletti, Iwasaki, Zakharov and Starke8, indicating the onset of growth of the next graphene layer from the step edges onto the terraces.Reference Forti, Emtsev, Coletti, Zakharov, Riedl and Starke9
Ambipolar doping of graphene on SiC(0001) by germanium intercalation
Not only can an EG film grown on SiC(0001) be rendered quasi-free-standing, but its electronic properties can also be tailored on a mesoscopic scale by functionalizing the graphene–SiC interface with germanium, which allows for the specific selection of different doping levels. For example, germanium was deposited on a ZLG sample on SiC(0001) under UHV, and subsequent annealing was found to lead to the intercalation of an atomically thin germanium film underneath the carbon layer. The covalent bonds between the carbon atoms in the ZLG and the topmost silicon atoms of the SiC substrate were broken upon the diffusion of germanium atoms between the two layers; that is, the interface bonding was again removed, as discussed in the previous section for hydrogen, and the ZLG was structurally decoupled from the SiC surface. As in the case of hydrogen intercalation, the structural decoupling was manifested in changes detected by XPS and LEED as a clear signature for elimination of the covalent interface bonds and removal of the interface reconstruction.Reference Emtsev, Zakharov, Coletti, Forti and Starke10 Similarly, after intercalation of germanium, the former ZLG layer exhibited the Dirac-like band structure of graphene, as demonstrated in Figure 7a.
Photoemission valence-band maps (energy versus electron momentum) in the vicinity of the  $\bar K$ point (k = 0) of the graphene Brillouin zone taken after deposition of five monolayers of germanium on a ZLG sample followed by vacuum annealing at (a) 720°C, (b) 820°C, and (c) 920°C (photon energy = 90 eV). (d) Germanium 3d core-level spectra obtained after deposition and for different annealing temperatures. The intensities are normalized with respect to the substrate silicon 2p emission (photon energy = 1253.6 eV) (adapted from Reference Reference Emtsev, Zakharov, Coletti, Forti and Starke10).

Unlike the case for hydrogen, however, distinct p or n doping could be achieved, as shown in Figure 7a and 7c, simply by using different annealing temperatures. After the initial deposition of approximately five monolayers of germanium, the p phase was obtained by annealing at 720°C, whereas the n phase developed after further heating to 920°C. Alternatively, the n phase can also be prepared directly by initially depositing a smaller amount of germanium and annealing to 720°C, which indicates that the two phases with different types of doping are characterized by different amounts of intercalated germanium. This conclusion is also corroborated by the different intensities in the germanium 3d core-level emission measured by XPS, as demonstrated in Figure 7d. Notably, after starting with a p phase, coexistence of the p- and n-doped graphene regions could be achieved during the transition between the two phases, as displayed in Figure 7b. In this situation, an intermediate germanium concentration was observed by XPS (Figure 7d). The doping level for the two phases, however, was fixed, as indicated by the persistent sharpness and reproducible energy position of the two π-band branches observed (Figure 7b).Reference Emtsev, Zakharov, Coletti, Forti and Starke10 This necessarily means that, at this stage, the surface is split into coexisting p and n patches, which suggests the presence of lateral graphene p–n junctions.
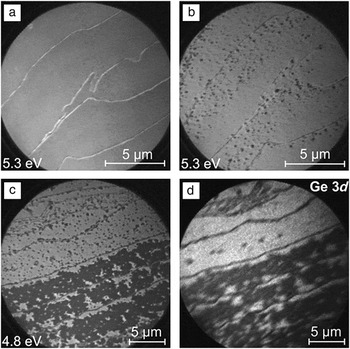
To analyze the spatial distribution of the differently doped patches, the surface was investigated by LEEM and PEEM during this transition stage.Reference Emtsev, Zakharov, Coletti, Forti and Starke10Figure 8a shows a LEEM image of p-phase germanium-decoupled graphene, obtained after annealing at 720°C (cf. Figure 7a). The graphene layer was quite homogeneous and covered the entire surface. The graphene domains were determined by the size of the SiC substrate terraces and were thus on the order of 3–5 μm in width. Successive stages (shorter and longer annealing) of the emergence of the n-doped graphene phase are displayed in Figure 8b–c, respectively.
(a–b) LEEM images of the quasi-free-standing graphene layer obtained by intercalation of germanium atoms at the interface with a SiC(0001) surface: (a) homogeneous p-doped graphene phase and (b) initial stage of the annealing-induced graphene p–n junction formation. Dark inclusions in (b) correspond to n-doped graphene islands embedded in p-doped graphene. (c) LEEM image and (d) PEEM germanium 3d intensity map of the graphene p–n coexistence stage. In (c) and (d), bright (dark) regions correspond to p-doped (n-doped) quasi-free-standing graphene regions (adapted from Reference Reference Emtsev, Zakharov, Coletti, Forti and Starke10).

In Figure 8d, the PEEM image corresponding to Figure 8c reveals a significant contrast in intensity of the germanium 3d core-level signals for the two graphene phases. Contrast in PEEM is determined by the concentration of germanium atoms located beneath the EG layer, and the spatial distribution coincides with the contrast obtained by LEEM (cf. Figure 8c). This corroborates the conclusion that the n phase is induced upon partial desorption of germanium from under the surface (i.e., partial de-intercalation). Surprisingly, the desorption process was found to be initiated not at the step edges but rather on the terraces (see Figure 8b), suggesting a local reaction through the graphene layer, a mechanism that is very different from the common intercalation processes known for graphite. This local process leads to the formation of n-doped graphene islands as small as 100 nm embedded in the p-doped graphene sheet, so that lateral p–n junctions develop. With further annealing, the islands grow in size and coalesce to form extended n-doped graphene areas.
Germanium intercalation has also been studied theoretically.Reference Deretzis and La Magna52 In agreement with experiment,Reference Emtsev, Zakharov, Coletti, Forti and Starke10 the calculations found the insertion of germanium adatoms at the graphene–SiC interface to be energetically favorable. Thus, the ZLG is detached from the substrate, and “a stable electron-doped phase is obtained as a result of the pinning of the Fermi level by sp 3-type germanium dangling bond states.”Reference Deretzis and La Magna52 Germanium chemisorbed on top of the graphene layer was found to be unstable. However, a situation favoring a p-doped phase could not be found.Reference Deretzis and La Magna52
Transition-metal, alkali-metal, and silicon intercalation
Graphene can also be grown on many transition-metal surfaces; hence, the study of the interactions of transition metals with EG on SiC(0001) is also of interest. Indeed, gold was found to intercalate between ZLG and SiC(0001) in a manner similar to that described for germanium.Reference Gierz, Suzuki, Weitz, Lee, Krauss, Riedl, Starke, Höchst, Smet, Ast and Kern53 In this case as well, two doping levels can be achieved; however, one phase has weak p doping, and the other exhibits strong n doping. This discovery triggered theoretical investigations that verified the experimental findings,Reference Chuang, Lin, Huang, Hsu, Kua, Ozolins and Yeh54 more detailed measurements of π-band parameters,Reference Walter, Bostwick, Jeon, Speck, Ostler, Seyller, Moreschini, Chang, Polini, Asgari, MacDonald, Horn and Rotenberg32 and further theoretical efforts to study transition metals.Reference Hsu, Lin, Ozolins and Chuang55 In fact, in our own laboratory, we are currently continuing to study the potential intercalation behavior of other transition and lanthanide metals.
For early investigations of the π-band structure of EG on SiC(0001), the layers were intentionally n-doped so that a larger portion of the π bands could be imaged by ARPES.Reference Ohta, Bostwick, Seyller, Horn and Rotenberg43 For this purpose, alkali metals such as potassium are well suited. Interestingly, a number of alkali metals have been found not only to serve as strong n-type transfer dopants, but also to intercalate between graphene layers and the SiC substrate.Reference Virojanadara, Watcharinyanon, Zakharov and Johansson56, Reference Watcharinyanon, Johansson, Zakharov and Virojanadara57 Notably, lithium intercalates immediately upon room-temperature deposition,Reference Watcharinyanon, Johansson, Xia and Virojanadara58 whereas one group reported that moderate annealing to 75°C is necessary for sodium.Reference Watcharinyanon, Johansson, Xia and Virojanadara58 Nevertheless, both lithium and sodium still induce strong n doping in the decoupled graphene layer,Reference Watcharinyanon, Johansson, Xia and Virojanadara58 as also corroborated by theoretical work.Reference Deretzis and La Magna59
In contrast to Reference Reference Watcharinyanon, Johansson, Xia and Virojanadara58, Sandin et al. reported that sodium intercalation takes place even at room temperature (accompanied by electron doping of the graphene).Reference Sandin, Jayasekera, Rowe, Kim, Buongiorno Nardelli and Dougherty60 At low coverages and room temperature, they found that intercalation occurred through small chainlike structures and that the sodium was inserted between single-layer graphene and the interfacial layer. Sodium deposited at higher coverages and then annealed formed a second intercalation structure in which the sodium penetrated beneath the interfacial layer and decoupled it to form a second graphene layer. The two phases were observed to coexist.Reference Sandin, Jayasekera, Rowe, Kim, Buongiorno Nardelli and Dougherty60 Recently, silicon was also found to intercalate between the interface layer and the SiC substrate, but only upon annealing of the deposited silicon adlayer to about 800°C.Reference Xia, Watcharinyanon, Zakharov, Yakimova, Hultman, Johansson and Virojanadara61
Summary and outlook
The intrinsic n doping of epitaxial graphene (EG) on SiC(0001) can be overcome either by transfer-doping techniques or, more elegantly, by intercalation of foreign elements at the SiC–EG interface. Hydrogen intercalation decouples zero-layer graphene (ZLG, i.e., the initial, covalently bound, electronically inactive carbon layer) and transforms it into quasi-free-standing monolayer graphene (QFMLG). The resulting layers are nearly charge-neutral, with slight deviations from neutrality due to different properties of the substrate polytype. The electronic structure of decoupled graphene layers can be tailored by intercalating other atomic species. For example, by intercalating different amounts of germanium, either p or n doping can be achieved, and lateral p–n junctions, where unconventional quantum phenomena might be expected,Reference Katsnelson, Novoselov and Geim62, Reference Cheianov, Fal’ko and Altshuler63 can be prepared. The intercalation process appears to proceed directly through the graphene layer, not by incorporation at step edges and subsequent migration underneath graphene terraces. However, the nature of the microscopic kinetics is still unclear and requires further investigation on an atomic scale. Also, the electronic interaction between the intercalating species and the graphene layer, which leads to quite different charge-transfer behaviors in different cases, is not yet fully understood.
Acknowledgments
This work was supported by the German Research Foundation (DFG) within the framework of the Priority Program 1459 Graphene. C.C. acknowledges an Alexander von Humboldt research fellowship for financial support. Part of this research was funded by the European Community’s Seventh Framework Programme: Research Infrastructures (FP7/2007–2013) under Grant 226716. Support by the staff at MAX-Lab (Lund, Sweden) and SLS (Villigen, Switzerland) is gratefully acknowledged.