I. INTRODUCTION
Phosphors have a broad application in our daily life, e.g., cathode ray tubes, television, fluorescent lamps, detectors, and light-emitting diodes.Reference Jüstel, Nikol and Ronda1, Reference Höppe2 The luminescent lifetime of phosphors applied in above fields is usually short, while some phosphors possess a long lifetime, which is called long afterglow. It refers to a luminescence phenomenon that persists for a long time after excitation. Materials with long afterglow can store the absorbed energy from external irradiation and release the energy usually as visible light gradually. Due to this energy storage characteristic, visible light can be obtained from long afterglow materials in dark environment without electricity. It more or less assists to energy saving and sustainable development. Phosphors with long afterglow are commercially applied in emergency indications, road signs, displays, decoration, etc.Reference Lei, Sha, Zhang, Liu, Man and Yue3, Reference Ju, Wei, Zheng, Gao, Zhang and Liu4 More recently, the application of long afterglow phosphors (LAPs) was extended to medical diagnostics.Reference de Chermont, Chanéac, Seguin, Pellé, Maîtrejean, Jolivet, Gourier, Bessodes and Scherman5, Reference Wu, Wang, Chen and Yan6 The employment of LAPs substantially enhanced the signal-to-noise ratio because the autofluorescence of tissues was avoided during the detection. Hence, LAPs possess a considerable commercial prospect.
By now, tricolor LAPs have been achieved, i.e., Sr2MgSi2O7: Eu2+, Dy3+ (blue, ∼470 nm),Reference Xiao and Xiao7, Reference Lin, Tang, Zhang, Wang and Zhang8 SrAl2O4: Eu2+, Dy3+ (green, ∼510 nm),Reference Murayama, Takeuchi, Aoki and Matsuzawa9, Reference Matsuzawa, Aoki, Takeuchi and Murayama10 and Y2O2S: Eu3+, Ti4+, Mg2+ (red, 625 nm).Reference Li, Liu and Ai11, Reference Ai, Liu, Li and Xiao12 Among these, the afterglow properties of blue and green phosphors are much superior to the red one (the afterglow duration of Sr2MgSi2O7: Eu2+, Dy3+ and SrAl2O4: Eu2+, Dy3+ lasts more than 10 h while the one of Y2O2S: Eu3+, Ti4+, Mg2+ maintains several minutes, which is far away from commercial application). To enhance the red long afterglow, some new materials are developed. Ca2Si5N8: Eu2+Reference Miyamoto, Kato, Honna, Yamamoto and Ohmi13, Reference Lei, Machida, Horikawa, Hanzawa, Kijima, Shimomura and Yamamoto14 and Ca2SnO4: Sm3+Reference Ju, Wei, Zheng, Gao, Zhang and Liu4, Reference Xu, Wang, Zeng and Gong15 have been reported to exhibit red long afterglows. However, calcining temperatures for synthesis of these materials are high (>1300 °C), and it is not conducive to industrial manufacture. In 2004, Liu et al.Reference Liu, Liu, Yuan, Zhang, Rong and Huang16 observed the long afterglow of Eu3+ in CaWO4 matrix. The afterglow duration also persisted several minutes. Since the afterglow of Y2O2S: Eu3+ can be induced by Ti4+, Mg2+ codoping,Reference Hong, Zhang, Fan and Wang17, Reference Murazaki, Arak and Ichinomiya18 one may consider if such influence occurs in Eu3+ doped CaWO4 matrix. In the present work, the influence of Ti4+ and Mg2+ codoping on the afterglow properties of CaWO4: Eu3+ is investigated and the results are encouraging. In addition, the explanation on the afterglow enhancement is discussed.
II. EXPERIMENTAL SECTION
To study the enhanced afterglow properties, four samples, Ca0.99WO4: Eu3+0.01 (denoted as CE), Ca0.98WO4: Eu3+0.01, Ti4+0.01 (denoted as CET), Ca0.98WO4: Eu3+0.01, Mg2+0.01 (denoted as CEM), and Ca0.97WO4: Eu3+0.01, Ti4+0.01, Mg2+0.01 (denoted as CETM) are synthesized via high-temperature solid state reaction. The CaCO3 (99%), WO3 (99%), TiO2 (99%), MgO (99%), and Eu2O3 (99.99%) are used as the raw materials. Initially, the raw materials were weighted according to the nominal compositions. Then the powders were mixed and ground thoroughly for 2 h. After that, the powder mixtures were calcined at 1000 °C for 2 h in an oven with about 5.6 °C min−1 heating rate. After cooling to room temperature, the samples in the form of white powder are obtained.
The phase identification of all obtained samples was carried by x-ray diffraction (XRD) using a XD-2 diffractometer (Beijing PGENERAL) with Cu Kα irradiation (λ = 1.5406 Å) at 36 kV tube voltage and 20 mA tube current. The scan range was 2θ from 10 to 70° with 6° min−1 speed. The photoluminescence (PL) was investigated by a F-7000 fluorescence spectrophotometer (Hitachi, Tokyo, Japan) with a Xe lamp excitation. The afterglow spectrum was also measured using the same equipment. The samples are excited by a mercury lamp (254 nm, 60 W) for 1 min, and the measurement was carried out without external excitation (the Xe lamp was closed). The decay curves and thermoluminescence (TL) curves of the samples were measured using a FJ427A1 thermoluminescent dosimeter (CNNC Beijing Nuclear Instrument Factory, Beijing, China). 0.005 g powder for each sample was used. During detection of decay curves, the temperature was maintained at 30 °C. Prior to the detection, the powder was excited by a mercury lamp for 1 min. For the TL curves measurement, the heating rate was 1 °C Sec−1. The range of the measurement is from room temperature to 300 °C. Prior to the measurement, the powder was also exposed to a mercury lamp for 1 min. The interval between the measurement and the removal of excitation was 10 min.
III. RESULTS AND DISCUSSION
A. Phase identification
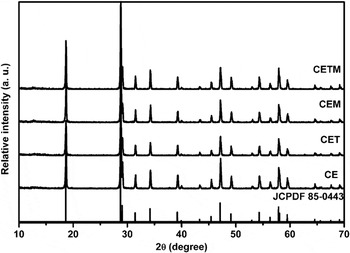
The XRD patterns of all obtained samples are measured and the results are shown in Fig. 1. The samples exhibit the similar diffraction patterns with the approximate peaks locations. According to the JCPDF No. 85-0443 standard card, the structure of the samples can be regarded as tetragonal CaWO4 with space group I41/a (No. 88). The crystal is body-centered, and the cell parameters of the samples in the present work are around a = b = 5.23 Å and c = 11.35 Å. No other structure is observed from the patterns. The incorporated Eu3+, Ti4+, and Mg2+ ions tend to substitute the Ca2+, W6+, and Ca2+ ions, respectively, due to the similar ionic sizes (Ca2+, eighth coordination, 112 p.m.; W6+, fourth coordination, 42 p.m.; Eu3+, eighth coordination, 106.6 p.m.; Ti4+, fourth coordination, 42 p.m.; and Mg2+, eighth coordination, 89 p.m.).Reference Shannon19 Small amounts of Eu3+, Ti4+, and Mg2+ incorporation has not had a significant effect on the crystal structure.
X-ray diffraction patterns of all obtained samples.

The mean crystal sizes of the obtained materials are estimated using Scherrer formulaReference Patterson20:
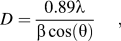
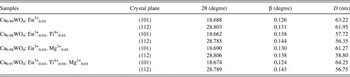
where D is the average crystal size for the particles. λ represents the wave length, which is 0.15406 nm in this work. β is the width at half intensity of the peak and θ is the degree of the maximum intensity of the peak. The (101) and (112) crystal planes are selected for estimation and the estimated results are listed in Table I. The mean crystal sizes of the samples are around 56–64 nm, indicating that incorporation of small amount of Eu3+, Ti4+, and Mg2+ is not regarded a significant influence on the crystal size.
Estimated results of the mean crystal sizes of samples.

B. PL analysis
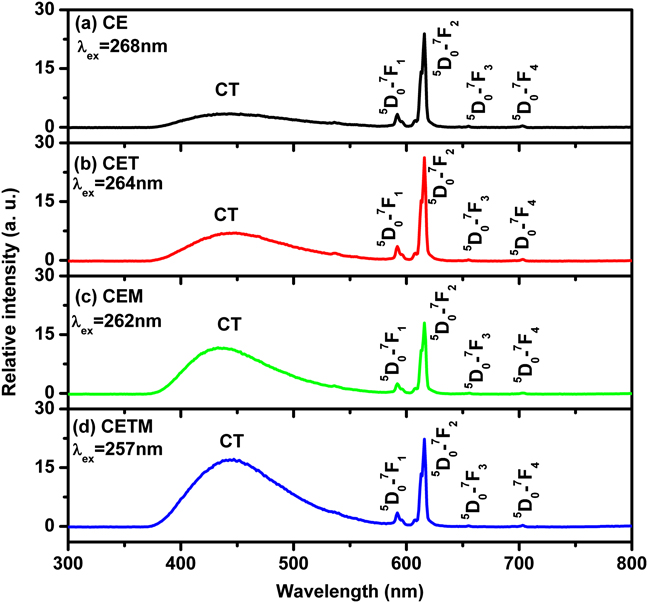
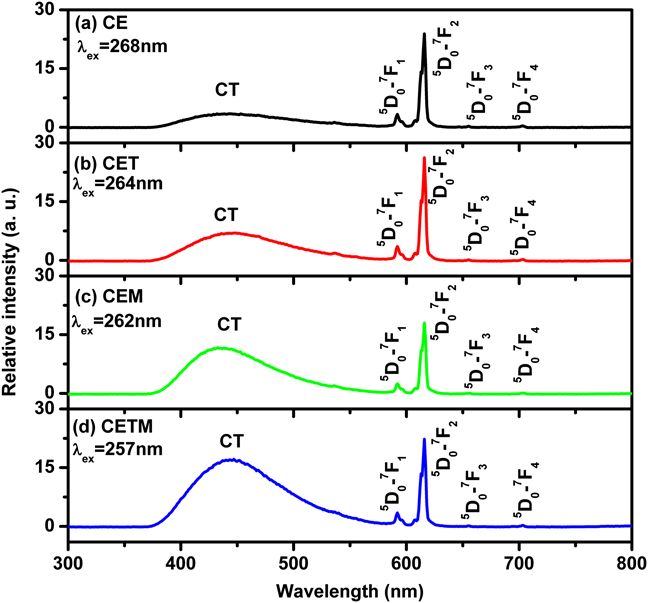
The emission spectra of the obtained samples are shown in Fig. 2. As can be seen, each spectrum consists of a broad emission band and several obvious emission sharp lines. The broad band located around 415 nm is ascribed to the charge transfer (CT) from W6+ 5d state to O2− 2p state of the matrixReference Pang, Lin, Wang, Yu, Zhou and Han21 while the sharp lines can be attributed to the f–f transitions configuration of Eu3+ ions. These sharp lines locate around 590, 616, 650, and 700 nm, which can be designated as 5D0 → 7F1, 5D0 → 7F2, 5D0 → 7F3, and 5D0 → 7F4, respectively. The intensity of the CT emission of the WO42− group is enhanced by the incorporation of Ti4+ and further enhanced by the incorporation of Mg2+. It reaches a maximum value (more than five times stronger than the one of CE) when the phosphor is incorporated with Ti4+ and Mg2+ simultaneously. It means the incorporation of small amounts of Ti4+ and Mg2+ can improve the luminescence of CaWO4 matrix.
Emission spectra of all samples.
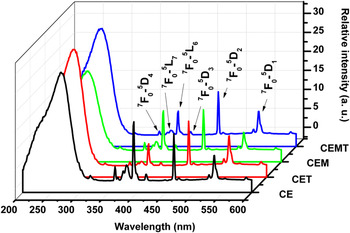
The excitation spectra of the samples monitoring 616 nm emission are presented in Fig. 3. Similarly, a broad absorption band corresponding to the CT in WO42− group can be observed. The maximum values of the bands locate around 268 nm, 264 nm, 262 nm, and 257 nm, corresponding to CE, CET, CEM, and CETM, respectively. Incorporation of Ti4+ and Mg2+ results in the blue shift of CT. The sharp lines can be ascribed to the absorption of the Eu3+ ions. The lines at 360, 380, 394, 412, 464, and 531 nm can be designated as 7F0 → 5D4, 7F0 → 5L7, 7F0 → 5L6, 7F0 → 5D3, 7F0 → 5D2, and 7F0 → 5D1, respectively. As presented in the figure, the samples with Ti4+ incorporation present weaker intensities of 7F0 → 5D4, 7F0 → 5L7, and 7F0 → 5L6 than the samples without Ti4+. Meanwhile, the CTs of the samples with Ti4+ incorporation are a bit stronger. This indicates that the Ti4+ ions in the crystal weaken the f–f absorption of Eu3+ but reinforce the energy transfer from CT to Eu3+ emission.
Excitation spectra of the samples.

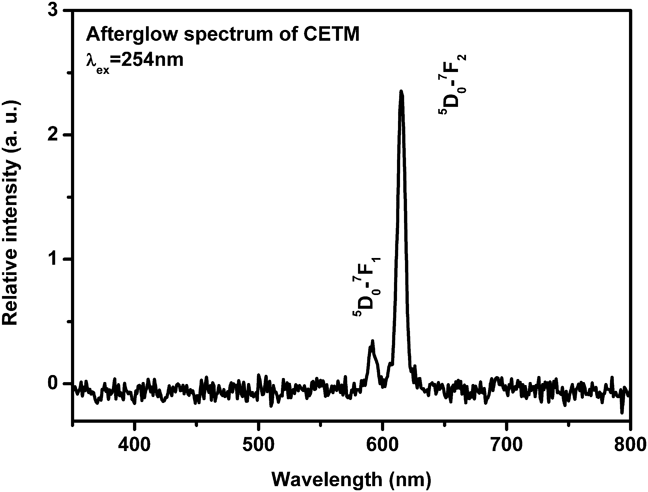
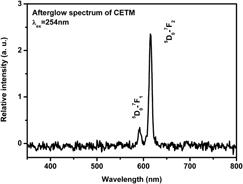
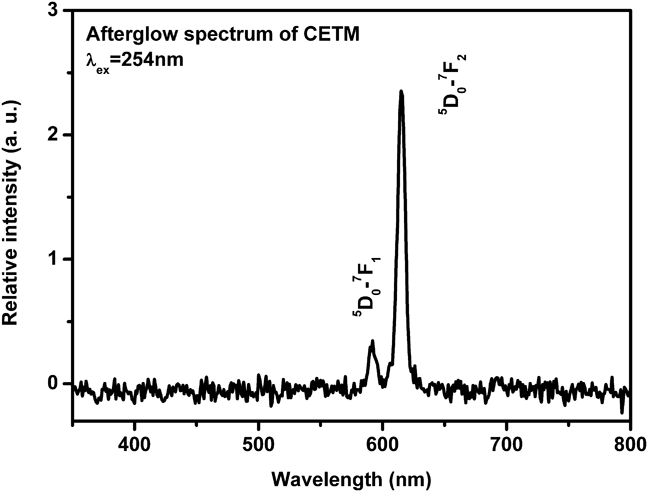
The afterglow spectrum of CETM was measured, and the result is exhibited in Fig. 4. Two sharp lines corresponding to the 5D0→7F1 and 5D0→7F2 transitions of Eu3+ ions are observed. The other samples show the similar results. Other emissions of Eu3+ or the WO42− group are not obvious, implying that 5D0 → 7F1 and 5D0 → 7F2 make the chief contribution to the afterglow emission. The calculated color coordinates (International Commission on Illumination standard) of the afterglow is (x, y:0.566, 0.346), meaning that a red afterglow can be observed.
Afterglow emission spectrum of CaWO4: Eu3+, Ti4+, Mg2+.
C. Decay characterization
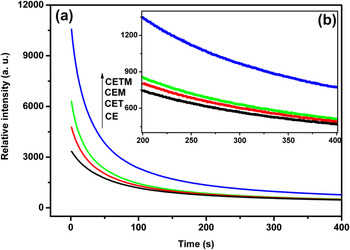
To demonstrate the afterglow properties of the samples, the decay curves were recorded and shown in Fig. 5. It clearly shows that the initial intensity of the afterglow is enhanced by Ti4+ incorporation and further enhanced by Mg2+ incorporation. The CETM, which is incorporated by Ti4+ and Mg2+ simultaneously, shows the strongest intensity. The sequence of the intensity from strong to weak maintains as CETM > CEM > CET > CE during the whole interval. This can be confirmed via Fig. 5(b), which shows the decay process in the last 200 s. From this, it can be deduced that the afterglow duration of CaWO4: Eu3+ can be significantly prolonged by Ti4+ and Mg2+ incorporation.
(a) Decay curves of the afterglow of all samples. (b) Decay curves measured in the last 200 s.

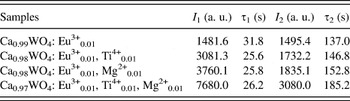
In general, the decay process of LAPs can be evaluated using curve fitting technique. In many cases, the fitting curve is the double exponential equation since the decay process can be divided into a rapid-decaying process and a slow-decaying one. To some extent, the latter reflects the duration of the afterglow because it is determined by the tail of the decay. The form of the equation is as followsReference Lin, Dong, Tan, Liu, Zhang, Chen, Qiu, Zhao and Xu22, Reference Dorenbos, Krumpel, van der Kolk, Boutinaud, Bettinelli and Cavalli23:

where I 0 is the original properties of the sample; I represents the phosphorescent intensity; I 1 and I 2 are two constants; t represents the time; and τ 1 and τ 2 are decay constants which decide the decay rate for the rapid and the slow exponentially decay components, respectively. In the present work, this equation with the identical I 0 is also utilized to fit the experimental data and the fitting results are listed in Table II. The values of τ 2 in the table imply that the sequence of afterglow duration from long to short confirms to CETM > CEM > CET > CE. Hence, it can be deduced the longest duration from CETM. In other words, incorporation of Ti4+ and Mg2+ enhances the afterglow properties of CaWO4: Eu3+ significantly.
Fitting results of the decay process of samples.

D. TL analysis
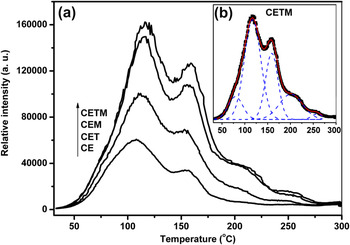
The long afterglow of phosphors is considered to be induced by the thermal liberation of trapped carriers. When phosphors are exposed under external illumination, charge carriers (electrons and/or holes) can be excited from ground state to excitation state. Then charge carriers are partially captured by the trap(s). The thermal liberation of carriers from trap(s) to luminescence centers accompanied by charge recombination results in a delay emission after the removal of external illumination. This is the afterglow of the phosphors. If the phosphors are heated, trapped carriers will be liberated rapidly in a suitable temperature, overcoming the activation energy. Thus, the higher temperature the rapid liberation of trapped carriers locates, the deeper the trap should be. A temperature dependence luminescence curve more or less reflects the status of the traps. This curve is called TL. The TL curves of the samples in the present work are exhibited in Fig. 6. The shape of the curves is similar, while the glow intensities are different. The incorporation of Ti4+ and Mg2+ increases the TL intensity. This means that the probability of the capture of carriers is lifted. The sequence of the TL intensity from strong to weak is CETM > CEM > CET > CE, which agrees well to the one of decay intensity. More carriers in the traps results in a larger number of liberated carriers, and it persists for a period of time, leading to a stronger intensity and a long duration of afterglow. That is why a stronger TL corresponds to a better property of the afterglow. In a word, the similarity of the TL curves with different intensities implies that the incorporation of Ti4+ or Mg2+ does not induce a new trap, but lifts the trapping probability of carriers.
(a) Thermoluminescence (TL) curves of all samples. (b) Deconvolution of the TL curve of CaWO4: Eu3+, Ti4+, Mg2+.

Deconvolution of the TL presents five TL bands [shown in Fig. 5(b)], implying five traps of the phosphors. The cause of traps in phosphors is still an open question, but it is agreed that lattice defects play an important role on it. One possible defect is the Ca2+ vacancies (denoted as VCa). When two Eu3+ ions replace two Ca2+ ions in the matrix, one VCa is induced due to the charge compensation. Two different Ca2+ sites in CaWO4Reference Xiao, Xiao, Liu, Ai, Li and Wang24 lead to two different VCa. The VCa has two positive charges and they act as hole traps. Eu3+ ion in the Ca2+ site is another kind of defect, and oxygen vacancies may also be the defects. The cluster of defects makes the cause of traps more complicated than we expected. Further research should be carried out to reveal it.
E. Discussions
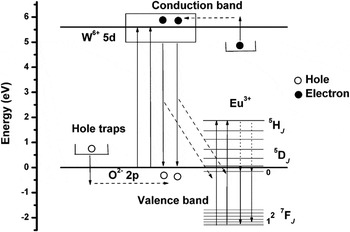
The afterglow of Eu3+ in CaWO4 can be induced by the 254 nm excitation (mercury lamp) efficiently. Due to the overlap of the 254 nm excitation and the CT of WO42− group, and the energy transfer from CT to Eu3+ is possible,Reference Gürmen, Daniels and King25 it is reasonable to deduce that the afterglow of Eu3+ in CaWO4 is originated from the energy transfer from CT to the activator. As shown in Fig. 7, the band gap of CaWO4 matrix is around 5.6 eV and the lowest level of Eu3+ is around 2.3 eV below the top of valence band (VB),Reference Shi, Liu, Gao and Zhou26 thus locations of other levels can be estimated. When the phosphors are excited by an excitation available to CT, electrons transfer from the 2p state O2− to the 5d state of W6+ and then a large number of free carriers are generated because the 5d state of W6+ dominates the bottom of conduction band (CB) while the 2p state of O2− dominates top of VB.Reference Zhang, Holzwarth and Williams27 Then carriers migrate in CB and/or VB. Some of the carriers are trapped by traps without an immediate liberation. After the removal of excitation, trapped carriers can be thermally liberated. The reverse process leads to the CT accompanied by the energy transfer to Eu3+ ions. The afterglow of Eu3+ is generated.
Scheme of mechanism on afterglow generation on CaWO4: Eu3+.

Since the Ti4+ and Mg2+ do not induce a new trap, two factors may be considered as influences on the afterglow. One is the efficiency of CT and the other is the energy transfer rate from CT to Eu3+. As shown in the emission spectra, the incorporation of Mg2+ significantly enhances the emission of CT of WO42− group. The Mg2+ ions substitute the Ca2+ ions in the crystal and then a small amount of MgWO4 structure is formed. Since the quantum efficiency of MgWO4 approaches 100%,Reference Yen, Shionoya and Yamamoto28 the small amount of MgWO4 may assist to increase the efficiency of the matrix. That is why the incorporation of Mg2+ enhances the CT emission. On the other hand, the excitation spectra monitoring 616 nm emission illustrate that the Ti4+ weakens some f–f absorptions of Eu3+ (7F0 → 5D4, 7F0 → 5L7, and 7F0 → 5L6) but reinforces the energy transfer from CT of WO42− to Eu3+ emission because of the largest value of CT absorption band. Then the energy transfer rate from CT to Eu3+ can be enhanced by Ti4+ incorporation. This result is in agreement with the work of Hong et al.Reference Hong, Zhang, Fan and Wang17 Consequently, Mg2+ and Ti4+ enhance the afterglow properties via the enhancement of efficiency of CT and the energy transfer rate from CT to Eu3+, respectively. On the other hand, in the case of incorporation of Ti4+ ions in W6+ sites, more oxygen vacancies will be created in the vicinity due to charge compensation, leading to increased trap concentration. In the case of Mg2+ substituting Ca2+, the probability of replacement of Eu3+ for Ca2+/Mg2+ is lowered because the difference of ionic size is enlarged, leading to a lower Eu3+ concentration in matrix. This is beneficial to the enhancement of Eu3+ phosphorescence due to the longer activator—vacancy distance for a given concentration of VCa.Reference Clabau, Rocquefelte, Le Mercier, Deniard, Jobis and Whangbo29 However, this does not play a crucial role on the enhancement of afterglow because the Mg2+ incorporation is low and the substitution of Eu3+ for Ca2+ is not affected significantly.
IV. CONCLUSIONS
A red afterglow can be observed in CaWO4: Eu3+ phosphors. It is caused by the energy transfer from CT to Eu3+ ions. The incorporation of Mg2+ enhances the efficiency of CT while the one of Ti4+ enhances the rate of the energy transfer from CT to Eu3+. The simultaneous incorporation of Ti4+ and Mg2+ significantly increases the intensity and duration of the afterglow emission. The CaWO4: Eu3+, Ti4+, Mg2+ may not yet meet commercial applications, but the present work at least provides a possible way to reinforce the afterglow properties of Eu3+.
ACKNOWLEDGMENT
The authors acknowledge the financial support from the National Natural Science Foundation of China (Nos. 21071034 and 20871033).