I. INTRODUCTION
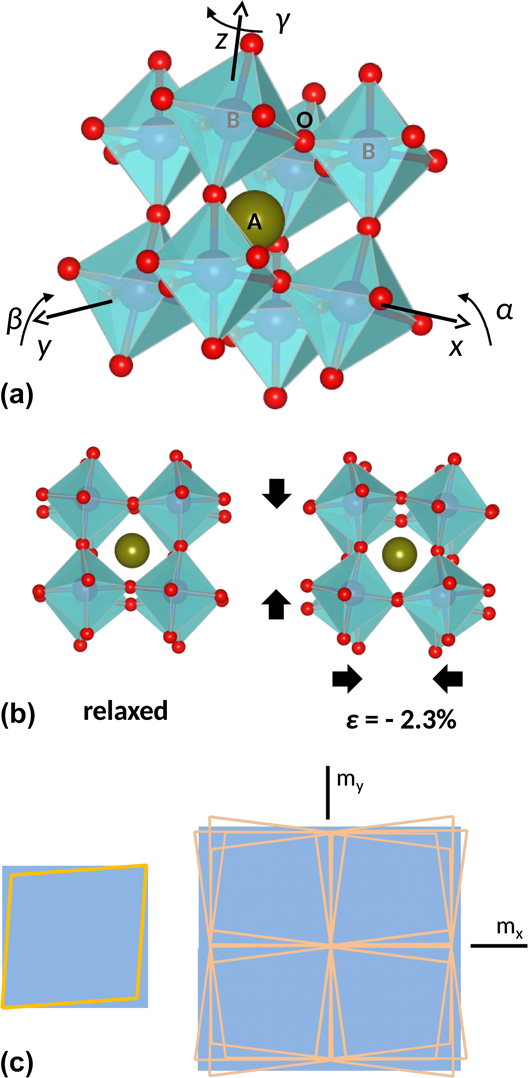
Since misfit dislocations (MDs) were conceptually conceived by Jan H. van der Merwe in 1949, Reference Frank and van der Merwe1,Reference Frank and van der Merwe2 before they were directly observed by transmission electron microscopy in the early sixties Reference Matthews3,Reference Delavignette, Tournier and Amelinckx4 (even before the first observation of a dislocation! Reference Hirsch, Horne and Wheelan5 ), misfit strains, particularly in complex oxide MDs themselves, have evolved from being the problem to represent, nowadays, a knob to new opportunities in nanoscience. His seminal works provided the theoretical grounds that led to the understanding of the mechanisms of misfit strain relief, thus inspiring the path toward the fabrication of highly perfect epitaxial films and subsequently to the optimization of their functional properties through their strain state. However, although the current knowledge describes well the semiconductor and metal epitaxy, Reference Matthews6–Reference Jain, Harker and Cowley8 it fails in modeling the behavior of materials exhibiting framework structures of linked polyhedra, as that shown in Fig. 1(a), that can deform by rotations of ideally rigid units. Reference Dove, Gambhir, Hammonds, Heine and Pryde9,Reference Carpenter, Sondergeld, Li, Liebermann, Walsh, Schreuer and Darling10 Notably, such structures can accommodate the lattice mismatch by mechanisms other than MDs, Reference Pennycook, Zhou, Chisholm, Borisevich, Varela, Gazquez, Pennycook and Narayan11–Reference Zhang, Mishra, Pennycook, Borisevich, Pennycook and Pantelides14 albeit MDs play a role in many circumstances. Reference Gao, Chen, Rafferty, Pennycook, Luo and Chu15–Reference Wang, Kim and Chen17
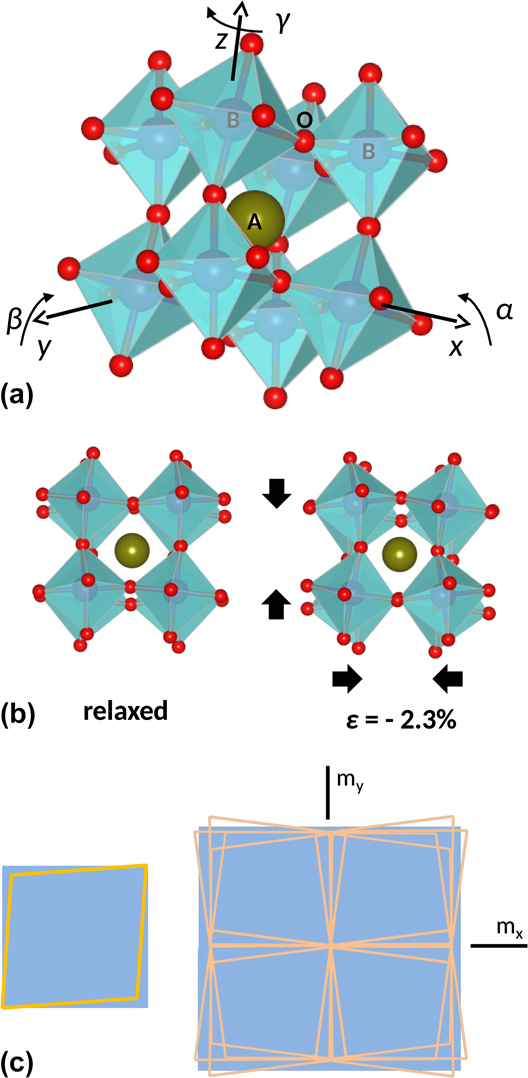
(a) Pseudocubic crystal structure of a distorted ABO3 perovskite. Oxygen atoms are shown in red; B cations occupy the center of the oxygen octahedra; and the central A cation, shown in green, is located within the cuboctahedral cavities left between the octahedra. The whole structure forms an interconnected network of corner-sharing octahedra. Lattice distortions can be derived from the cubic aristotype according to octahedral rotations about the base vectors of the cubic unit cell as indicated. The aristotype is characterized by the absence of octahedral rotations (α = β = γ = 0). (b) The crystal structure on the left corresponds to the relaxed rhombohedral LSMO phase viewed along a 〈001〉 axis. In this structure α = β = γ ∼ 5.2°, which can be reduced to a single rotation about the [111] axis of ω ∼ 7.5°. The crystal structure shown on the right is obtained from the relaxed one by applying a biaxial compressive strain of ε = −2.3% along the basal [001] and [010] directions, and allowing the lattice to deform by octahedral rotations without elastic distortions. After compression, the new rotation angles are α ∼ 10.2° and ω ∼ 14.7°, yielding a ∼7% reduction of the unit cell volume. This illustration simulates the unrealistic matching of LSMO on a LAO substrate by rigid octahedron rotations. (c) The scheme on the left shows a pseudocubic rhombohedral lattice projected on to the (001) plane of a cubic substrate. The right drawing illustrates the mesoscale matching of the rhombohedral lattice with the cubic one by restoring the m x and m y mirror planes absent in the former, to illustrate the role of ferroelastic domains in the relaxation of misfit shear strains.
Among materials exhibiting framework structures, transition metal oxides having the ABO3 perovskite structure are being focused with a huge interest owing to the rich variety of states produced by electron correlations and their effects on the lattice.
Reference Tokura18
A prototypical example is the LaMnO3 manganite, in which the strong localization of the Mn3+
 $\left( {{\rm{t}}_{2{\rm{g}}}^3{\rm{e}}_{\rm{g}}^1} \right)$
3d eg electron lifts the orbital degeneracy, inducing a Jahn–Teller distortion of the MnO6 octahedra which compresses the unit cell along the c-axis and expands it on the basal plane. Similarly, in thin films of the hole-doped compound, La1−x
Sr
x
MnO3, having partially filled Mn 3d eg levels, the coupling of the misfit strain with orbital degrees of freedom also breaks the orbital degeneracy favoring the preferential occupation of the out-of-plane
 ${d_{3{z^2} - {r^2}}}$
/in-plane
 ${d_{{x^2} - {y^2}}}$
orbitals under compressive/tensile misfit conditions,
Reference Tebano, Aruta, Sanna, Medaglia, Balestrino, Sidorenko, De Renzi, Ghiringhelli, Braicovich, Bisogni and Brookes19,Reference Pesquera, Herranz, Barla, Pellegrin, Bondino, Magnano, Sánchez and Fontcuberta20
with dramatic consequences on their transport and magnetic properties.
Reference Fang, Solovyev and Terakura21,Reference Mukherjee, Cole, Woodward, Randeria and Trivedi22
Moreover, the octahedral rotation angle, identified as the primary order parameter of antiferrodistortive phase transitions in perovskites like SrTiO3 (STO),
Reference Müller, Berlinger and Waldner23
may also couple with the misfit strain, as first exemplified by the stabilization of STO polymorphs on different substrates.
Reference He, Wells and Saphiro24
Since then, altered octahedral patterns not observed in the bulk form have been identified in various perovskite films,
Reference May, Kim, Rondinelli, Karapetrova, Spalding, Bhattacharya and Ryan25–Reference Aso, Kan, Shimakawa and Kurata30
hence signaling the opportunity to stabilize metastable structures by epitaxy. A paradigmatic example illustrating the richness and complexity of the structural behavior that perovskite oxides may attain under the misfit strain is given by multiferroic BiFeO3, as recently reviewed by Sando et al.
Reference Sando, Xu, Bellaiche and Nagarajan31
The room-temperature crystal structure of most perovskites can be derived from a prototypic cubic lattice by cation and/or anion displacements. The latter can be modeled as tiltings of the anion coordination octahedron surrounding the B cation. The common representation of octahedral tiltings follows Glazer’s classification of tilt systems, according to which the space group symmetry of any perovskites can be associated with a particular combination of octahedral rotations α, β, and γ about the 〈100〉 axes of the undistorted cubic lattice, as indicated in Fig. 1(a).
Reference Glazer32,Reference Glazer33
In the following, the term rotation will be used to specify the rotation angles α, β, and γ needed to define a particular tilting state of the octahedra, while the term distortion will be reserved to express deviations from regularity resulting from elastic deformation. A group-theoretical analysis yields 15 tilt systems,
Reference Howard and Stokes34
which are commonly designed by the manner in which the adjacent octahedra rotate one relative to each other
Reference Glazer32
; for instance, a
−/+ indicates out-of-phase/in-phase tilts, and a
0 indicates no tilt. Thus the
 $Pm\bar 3m$
space group corresponds to the a
0
a
0
a
0 tilt system, while α ≠ β ≠ γ ≠ 90° (a
−
b
−
c
−) corresponds to the triclinic
 $P\bar 1$
one. From Fig. 1(a), it can be inferred that increasing/decreasing the rotation angle about a given axis simultaneously shrinks/stretches the two unit cell axes perpendicular to it by equal amounts. For instance, Fig. 1(b) illustrates how the setting α = β = γ ≠ 0 (a
−
a
−
a
−), the same structure would exhibit auxetic behavior upon modifying the octahedral rotations. Although in practice, besides a few reported exceptions [for instance α-cristobalite,
Reference Alderson and Evans35
Co-ferrite spinel,
Reference Valant, Axelsson, Aguesse and Alford36
or (Ba0.6Sr0.4TiO3)1−x
–(Sm2O3)
x
nanocomposites
Reference MacManus-Driscoll, Suwardi, Kursumovic, Bi, Tsai, Wang, Jia and Lee37
], the auxetic behavior has been rarely observed, and the participation of octahedral rotations in the deformation mechanism of perovskites typically entails anomalies in the elastic moduli and therefore can be identified through an unexpected behavior of the lattice parameters.
Looking at Fig. 1(a), it can be realized that the tilting of the corner-sharing octahedra has a direct effect on the B–O–B bond angles, thereof on the electronic and magnetic properties of the material. In addition, the discontinuity in one or more of the charge, spin, orbital, lattice, and compositional degrees of freedom at interfaces combining dissimilar compounds promotes an extremely rich scenario leading in some cases to unanticipated and conceptually challenging states such as highly conducting electron gases between two insulating materials, Reference Ohtomo and Hwang38 interfacial superconductivity, Reference Gozar, Logvenov, Fitting Kourkoutis, Bollinger, Giannuzzi, Muller and Bozovic39,Reference Reyren, Thiel, Caviglia, Fitting Kourkoutis, Hammerl, Richter, Schneider, Kopp, Rüetschi, Jaccard, Gabay, Muller, Triscone and Mannhart40 polarization-dependent spin transfer, Reference Garcia, Bibes, Bocher, Valencia, Kronast, Crassous, Moya, Enouz-Vedrenne, Gloter, Imhoff, Deranlot, Mathur, Fusil, Bouzehouane and Barthélémy41 or the recently discovered thickness-dependent ferromagnetism in an antiferromagnetic oxide. Reference Wang, Li, Lü, Paudel, Leusink, Koek, Poccia, Vailionis, Venkatesan, Coey, Tsymbal, Ariando and Hilgenkamp42 This fascinating behavior has motivated in recent years the emergence of octahedral connectivity at oxide heterointerfaces as a cornerstone to the engineering of novel functionalities. Reference Rondinelli and Spaldin43,Reference Rondinelli, May and Freeland44 For instance, Ru–O–Ru bond angles which were never observed in bulk SrRuO3 have been engineered in SrRuO3/Ca0.5Sr0.5TiO3 multilayers, allowing control on the magnetic anisotropy. Reference Kan, Aso, Sato, Haruta, Kurata and Shimakawa45 However, despite the large effort directed toward understanding their structure and impact on the physical properties, the basic mechanisms governing the formation and stability of octahedral perturbations in epitaxial films remain elusive. Recent insights, however, have singled out two key features for the understanding of the octahedral behavior. The first one is that octahedral tilting does not only couple with the misfit strain, as previously believed, but also with the symmetry of the substrate even in the absence of a significant lattice parameter misfit. Reference Qiao, Jang, Singh, Gai, Xiao, Mehta, Vasudevan, Tselev, Feng, Zhou, Li, Prellier, Zu, Liu, Borisevich, Baddorf and Biegalski46–Reference Gao, Dong, Xu, Zhou, Yuan, Gopalan, Gao, Fong, Chen, Luo and Martin48 The second one is that the length scale of observed octahedral perturbations, typically ranging between two and several unit cells, not always includes the whole thickness of the films. Reference Jia, Mi, Faley, Poppe, Schubert and Urban49–Reference He, Ishikawa, Lupini, Qiao, Moon, Ovchinnikov, May, Biegalski and Borisevich53 Interestingly, it has been observed that the vertical extent of the perturbations depends on the size of the A-site cation, Reference Aso, Kan, Shimakawa and Kurata54 suggesting the role of optimal bonding or tolerance factor in the stabilization of altered tilt patterns.
A drawback for the prediction of the relaxation mechanism of oxide epitaxial films is that the mechanical behavior of octahedral framework structures under biaxial stress is poorly understood yet. In this regard, it is important to note that in bulk perovskites, octahedral tilting mechanisms only take place at phase transitions, while within their stability field the crystal structure deforms following classic linear elasticity principles. Reference Carpenter, Sondergeld, Li, Liebermann, Walsh, Schreuer and Darling10 Interestingly, analysis of the evolution of the elastic moduli of the manganite La0.87Sr0.13MnO3 across its rhombohedral to orthorhombic phase transition Reference Darling, Migliori, Moshopoulou, Trugman, Neumeier, Sarrao, Bishop and Thompson55 and theoretical investigations of rigid unit modes in framework structures, Reference Goodwin56 both converge in signaling that the elastic energy difference between two octahedral patterns may be extremely small. According to these considerations, octahedral tilting mechanisms observed in strained epitaxial films can be regarded as a local misfit-induced phase transition. Here, the term misfit is used in a wider sense than usually, including the symmetry mismatch between the film and the substrate (if any), in addition to misfit strain. In fact, interfacial tilt patterns at dissimilar interfaces are constrained by the resulting symmetry discontinuity, which commonly results in a symmetry reduction relative to the substrate and the film. Therefore, it can be conceived that, symmetry breaking at interfaces intrinsically entails a local structural transition as the origin of the octahedral perturbation. This mechanism would anticipate that interfacial misfits can be accommodated by octahedral tilting without significant elastic distortions of bond distances, as illustrated in Fig. 1(b). However, owing to the strong influence of tilts on the stability of the perovskite structure, Reference Woodward57 the accommodation of the misfit strain by simply varying the magnitude of octahedral rotations is limited, thus anticipating the conditions under which elastic deformation and MD formation occur is unavoidable.
In addition to the MD formation and octahedral titling distortions, oxide epitaxial films may also accommodate misfit strains by domain formation as a consequence of their ferroelastic or ferroelectric character. As first recognized by Roytburd, these domain structures can efficiently contribute to the accommodation of misfit, Reference Roytburd58 for instance, the shear strain associated with the growth of a rhombohedral film on a cubic substrate. Reference Farag, Bobeth, Pompe, Romanov and Speck59 As illustrated in Fig. 1(c), in such a case, the domain walls (DWs) separating adjacent orientation states align with the mirror planes, m x and m y , lost in the ferroic phase, thus restoring the cubic symmetry on the mesoscale. A remarkable feature of DWs is that, even if they are oriented to satisfy the strain compatibility criterion at the contact plane, Reference Sapriel60 they still sustain large strain gradients perpendicular to them. Reference Haas and Jaep61 Since the translation symmetry is broken at the contact plane, similarly to interfaces, a symmetry mismatch appears which imposes symmetry constrains on the octahedral configuration of the DW. Reference Beanland62
As a consequence of their singularities, both DWs and MDs can be regarded as strongly confined separate sheet or linear phases, respectively, possessing distinct physical properties which in the former case have been the subject of strong interest. Reference Catalan, Seidel, Ramesh and Scott63 Although dislocations have comparatively received much less attention than DWs, the discovery of resistive switching behavior in individual dislocations in STO Reference Szot, Speier, Bihlmayer and Waser64 has initiated an intense research on their intricate ionic and electronic transport behavior. Reference Marrocchelli, Sun and Yildiz65 More recently, the impact of MDs on the interfacial charge distribution, Reference Chang, Chu, Jeng, Cheng, Lin, Yang and Chen66 film topography, Reference Pandya, Damodaran, Xu, Hsu, Agar and Martin67,Reference Sandiumenge, Bagués, Santiso, Paradinas, Pomar, Konstantinovic, Ocal, Balcells, Casanove and Martínez68 and surface current distribution, Reference Sandiumenge, Bagués, Santiso, Paradinas, Pomar, Konstantinovic, Ocal, Balcells, Casanove and Martínez68 has further illustrated the strong potential of such defects for the development of conceptually new nanodevices. Considering their strong tendency toward self-organization, Reference Santiso, Roqueta, Bagués, Frontera, Konstantinovic, Lu, Yildiz, Martínez, Pomar, Balcells and Sandiumenge69,Reference Santiso, Balcells, Konstantinovic, Roqueta, Ferrer, Pomar, Martínez and Sandiumenge70 the possibility to convert misfit relieving defects into functional elements brings a great opportunity for the development of functional nanostructures on length scales hardly achievable in oxides by top-down approaches. However, a deterministic manipulation of strain and the self-organization phenomena in complex oxides requires a deeper understanding of their specific misfit strain relieving mechanisms.
This article intends to provide a compact view of the complex interplay between the various mechanisms participating in the accommodation of dissimilarity at perovskite oxide heterointerfaces, whilst giving a new perspective of misfit relaxation from the point of view of those materials. To this end, the behavior of the ferroelastic room temperature half-metal ferromagnet La0.7Sr0.3MnO3 (LSMO)
Reference Urushibara, Morimoto, Arima, Asamitsu, Kido and Tokura71
under compressive and tensile misfit strains is revisited. The room temperature of LSMO belongs to the a
−
a
−
a
− tilt system with α = β = γ ∼ 5.4°, corresponding to the rhombohedral space group
 $R\bar 3c$
.
Reference Martin, Shirane, Endoh, Hirota, Moritomo and Tokura72
Compressive films are relaxed by MDs with no signatures of octahedral tiltings,
Reference Santiso, Roqueta, Bagués, Frontera, Konstantinovic, Lu, Yildiz, Martínez, Pomar, Balcells and Sandiumenge69
and tensile films exceed the critical thickness for MD formation by hundreds of nanometers without the introduction of MDs, exhibiting a thickness-dependent hierarchical development of electronic, elastic, and tilting perturbations.
Reference Sandiumenge, Santiso, Balcells, Konstantinovic, Roqueta, Pomar, Espinós and Martínez12
The comparison of these two systems, and particularly the behavior under a tensile misfit strain, captures essential aspects of the relaxation behavior of perovskite films and brings about the consideration of several issues commented in the preceding paragraphs, providing insights into open questions. However, the misfit relaxation behavior of oxide films typically exhibits a complex sensitivity to kinetics and therefore on the precise growth conditions
Reference Tselev, Vasudevan, Gianfrancesco, Qiao, Meyer, Lee, Biegalski, Baddorf and Kalinin73
and even small variations of the film composition.
Reference Breckenfeld, Shah and Martin74
This dependence results, in practice, in an additional degree of freedom which complicates the comparison between thin films grown under different conditions and by different deposition techniques. Thus, the present perspective is thought to rationalize the behavior observed in the above mentioned systems representing pure MD-free and MD-assisted relaxation regimes, rather than to provide an extensive review on oxide epitaxial growth. Excellent reviews on different aspects of oxide thin film growth can otherwise be found for instance in Refs. Reference Martin, Chu and Ramesh75 and Reference Moyer, Mangalam, Martin, Koster, Huijben and Rijnders76. Moreover, given the current strong interest on the lateral miniaturization of oxide functional nanostructures, the implications of their particular misfit relaxation behavior on the formation of bottom-up self-organized surface nanopatterns are also addressed.
II. SOURCES OF EPITAXIAL DISSIMILARITY
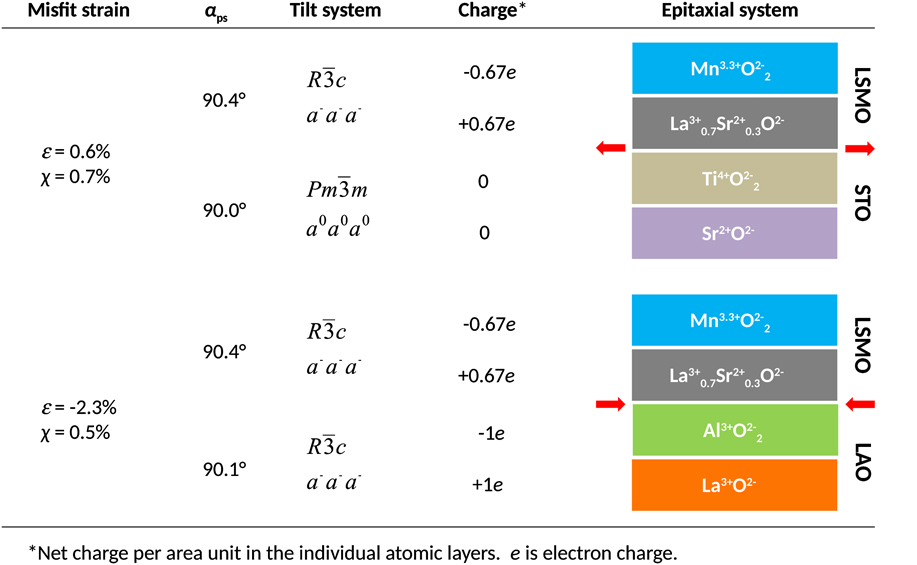
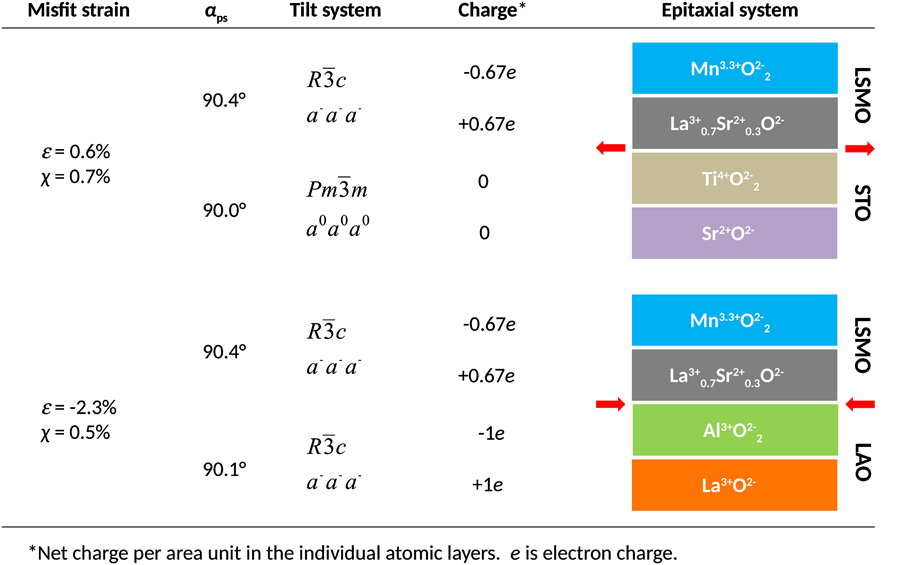
Figure 2 illustrates the different sources of dissimilarity commonly found in complex oxide epitaxy, as exemplified by the LSMO/STO and LSMO/LAO systems. These include, from right to left: (i) A polar discontinuity which results from differences between the charges carried by the AO and BO2 atomic planes of the ABO3 perovskite structure in the substrate and the film; (ii) A symmetry mismatch arising from the difference between the octahedral tilt systems of the film and the substrate, and (iii) The misfit strain, in which rhombohedral LSMO comprises of two terms: the misfit arising from the lattice parameter difference relative to the substrate ε = (a s − a f)/a f, where a s and a f are the lattice parameters of the substrate and the film, respectively, and a shear misfit χ = tan(αs − αf), where αs and αf are the interaxial angles of the film and the substrate on the contact plane, denoted by αps in reference to the pseudocubic (ps) angle.
Stacking sequences of atomic planes in the LSMO/STO and LSMO/LAO heterostructures and associated sources of dissimilarity. From right to left: Polar discontinuity resulting from the different charges carried by atomic planes in the film and the substrate; symmetry mismatch between the octahedral tilt systems of the film and the substrate; rhombohedral angle referred to the pseudocubic representation; and corresponding values of the lattice parameter (normal) and angular (shear) misfit strains.
A. Polar discontinuities in perovskite oxide heteroepitaxy
For any ABO3 interface bridging two perovskite structures, there are two possible configurations which preserve the perovskite stacking sequence across the interface, depending on whether the substrate is terminated with a BO2 or an AO atomic plane: ⋯(AO)s/(BO2)s/(AO)f/(BO2)f⋯ and ⋯(BO2)s/(AO)s/(BO2)f/(AO)f⋯, where subscripts s and f stand for the substrate and film, respectively. For the LSMO/STO case, Fig. 2 reproduces the former scheme corresponding to a TiO2 terminated STO substrate as commonly used in oxide epitaxy. In the case of LSMO/LAO, the same sequence is arbitrarily chosen because the control on the termination plane is not as strict as with STO substrates. In the La0.67Sr0.33MnO3 compound, the net charges per area unit are +2/3e and −2/3e, while they are +1e and −1e in LAO (e is the electron charge) and null for SrTiO3. In both systems, the interfaces are polar regardless of the interfacial configuration, leading, in the absence of interfacial charge reconstructions, to a diverging electrostatic potential. Reference Boschker, Verbeeck, Egoavil, Bals, van Tendeloo, Huijben, Houwman, Koster, Blank and Rijnders77,Reference Dagotto78 In the semiconductor epitaxy, polar interfaces, as found for instance in GaAs/Si or GaAs/Ge, result in a catastrophic interfacial roughening unless the interface is compositionally graded to avoid the presence of interfacial charges. Reference Harrison, Kraut, Waldrop and Grant79 In transition metal oxides, mixed valence states and oxygen loss may mediate the charge compensation if electrons can be redistributed at a lower energy cost than ions. Reference Nakawaga, Hwang and Muller80 Since LSMO is metallic and the valence of Mn cations can be varied, a 1/3e compensating charge can in principle be transferred to the interface to screen the diverging potential without the need to redistribute ions between the substrate and the film. In LSMO/STO films, the observation of a progressive reduction of Mn cations toward the a + 3 oxidation state at the first few unit cells in contact with the substrate (the average oxidation state in La0.7Sr0.3MnO3 is +3.3), indeed supports the latter mechanism. Reference Sandiumenge, Santiso, Balcells, Konstantinovic, Roqueta, Pomar, Espinós and Martínez12 This indicates that that the compensating charge is localized in the Mn 3d eg levels, causing a deterioration of the interfacial magnetic and transport behavior. Reference Sandiumenge, Santiso, Balcells, Konstantinovic, Roqueta, Pomar, Espinós and Martínez12 However, experimental and theoretical studies indicate that the thermodynamic driving force for cation interdiffusion across oxide interfaces may be very strong. Reference Sankara Rama Krishnan, Morozovska, Eliseev, Ramasse, Kepaptsoglou, Liang, Chu, Munroe and Nagarajan81,Reference Chambers, Engelhard, Shutthanandan, Zhu, Droubay, Qiao, Sushko, Feng, Lee, Gustafsson, Garfunkel, Shah, Zuo and Ramasse82 In the LSMO/LAO system, the precise location of the interface is blurred by intermixing of film and substrate cations over a few unit cells, Reference Bagués83 and interfacial charges are therefore likely avoided by chemically grading.
B. Symmetry mismatch at heterointerfaces
As far as the symmetry mismatch is concerned, it can be observed in Fig. 2 that in the selected examples this type of dissimilarity is only present in the LSMO/STO system, where the film tilt symmetry,
 $R\bar 3c$
(a
−
a
−
a
−), meets the untilted
 $Pm\bar 3m$
(a
0
a
0
a
0) symmetry of the substrate; conversely in LSMO/LAO both the film and the substrate have the same
 $R\bar 3c$
(a
−
a
−
a
−) space group. According to bicrystal symmetry theory,
Reference Pond and Vlachavas84
the symmetry of the film-substrate ensemble is given by the intersection symmetry of both crystals. Thus, the space group of the interfacial transition layer bridging the a
−
a
−
a
− and a
0
a
0
a
0 tilt configurations should be a common subgroup of the film
 $R\bar 3c$
and substrate
 $Pm\bar 3m$
space groups, which reduces the number of possible tilt systems to the monoclinic a
−
a
−
c
− and triclinic a
−
b
−
c
− ones.
Reference Howard and Stokes34
Thus, the symmetry allowed rotational degrees of freedom to enable tuning of the lattice mismatch by either by decreasing γ (c
−) or by simultaneously decreasing α (=β) (a
−) in the monoclinic case. In the triclinic case, any combination is allowed. The constrain of the cubic substrate, however, imposes equal rotations about the in-plane lattice parameters thus selecting the monoclinic a
−
a
−
c
− configuration. Density-functional theory simulations of LSMO films under tensile strain show that the misfit is accommodated by reducing the rotation about the c-axis, in consistency with the formation of a monoclinic a
−
a
−
c
− interfacial octahedral pattern.
Reference He, Borisevich, Kalinin, Pennycook and Pantelides85
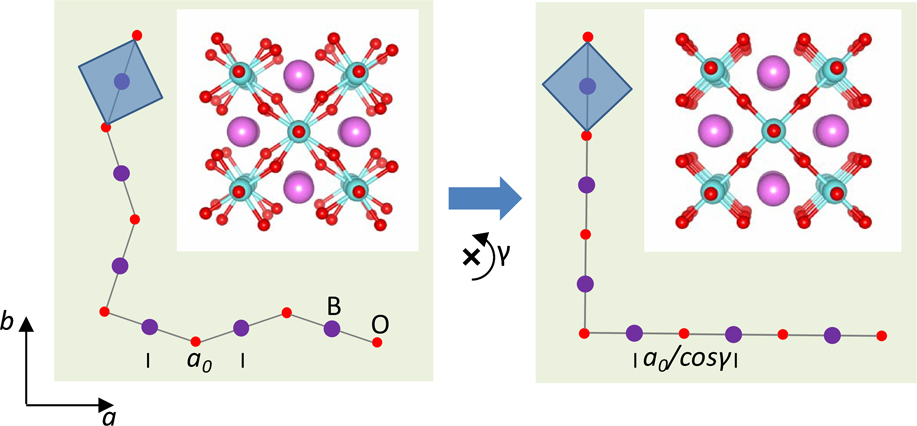
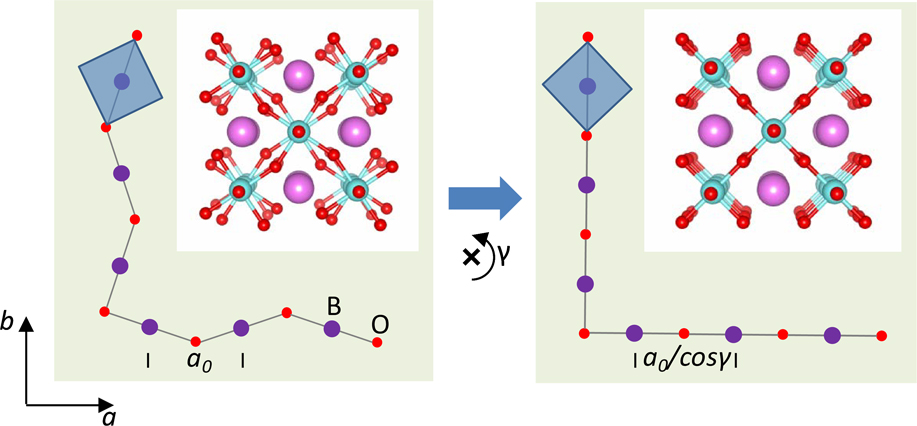
These mechanisms are illustrated in Fig. 3. For simplicity, the model considers only the rotation about the c-axis, γ. The left panel represents an hypothetical film with the lattice parameter a
0, and the symmetry allowed the tetragonal tilt system a
0
a
0
c
−, grown on a cubic substrate with lattice parameter a
0/cos γ. The film is therefore under a tensile misfit strain of cos−1 γ − 1 within reach of octahedral rotations, which can be accommodated by suppressing the γ rotation as shown in the right panel. The operation results in a dilatation of the cuboctahedral A-site cavity, as shown in the corresponding atomic models shown in the insets.
Accommodation of lattice misfit by octahedral tiltings. The left panel shows the structure of a perovskite film with the tetragonal tilt system a 0 a 0 a −, under a tensile misfit strain cos−1 γ − 1 on a cubic substrate. The misfit strain is totally relaxed by suppressing the γ rotation, as shown in the right panel. Blue squares show the equatorial plane of the BO6 octahedra. Insets depict the corresponding atomic structures. Oxygen atoms are shown in red, B-site cations in lilac, and A-site cations in pink.
Unfortunately, despite recent advances in the identification of interfacial octahedral configurations using direct transmission and scanning transmission electron microscopy techniques, Reference Jia, Mi, Faley, Poppe, Schubert and Urban49,Reference He, Ishikawa, Lupini, Qiao, Moon, Ovchinnikov, May, Biegalski and Borisevich53 convergent electron diffraction, Reference Hwang, Son, Zhang, Janotti, Van de Walle and Stemmer27,Reference Hwang, Zhang and Stemmer86 and X-ray diffraction, Reference May, Kim, Rondinelli, Karapetrova, Spalding, Bhattacharya and Ryan25,Reference Brahlek, Choquette, Smith, Engel-Herbert and May87 experimental determinations of the complete tilt system in three dimensions are still scarce owing to the difficulty to determine oxygen positions in small volumes buried at interfaces. Among these techniques, diffraction-based ones allow a more reliable determination of the symmetry at a severe cost in spatial resolution. The few reported cases refer to the epitaxial growth of a − a − a − films on a 0 a 0 a 0 substrates, see LaNiO3/(LaAlO3)0.3(Sr2AlTaO6)0.7 Reference Hwang, Zhang and Stemmer86 and LaNiO3/STO, Reference Hwang, Son, Zhang, Janotti, Van de Walle and Stemmer27,Reference May, Kim, Rondinelli, Karapetrova, Spalding, Bhattacharya and Ryan25 identifying transitions to the a − a − c − system in agreement with the symmetry considerations, and signaling a significant role of the in-plane rotations, γ, in accommodating the lattice parameter misfit. As a generalization, the intersection symmetry of the perturbed interface will be reduced with respect to the symmetries of the film and the substrate, resulting in an increase in the octahedral rotation degrees of freedom available to accommodate the superimposed misfit strain. Since, with the exception of a + a + c −, all the tilt systems can be obtained on a rigid octahedron basis, Reference Howard and Stokes34 on pure geometrical grounds, it is possible to accommodate almost all misfit scenarios without elastic distortions of the octahedra whenever the normal misfit strain is within reach of rigid rotations. Octahedral distortions, on the other hand, come into play when the necessary rotations induce the destabilization of the crystal structure or as a result of charge/orbital lattice coupling effects such as those associated with Jahn–Teller distortions or the misfit strain-induced preferential orbital occupancy. Reference Tebano, Aruta, Sanna, Medaglia, Balestrino, Sidorenko, De Renzi, Ghiringhelli, Braicovich, Bisogni and Brookes19,Reference Pesquera, Herranz, Barla, Pellegrin, Bondino, Magnano, Sánchez and Fontcuberta20
C. Misfit strain
In the absence of tiltings, the total elastic energy per interface area unit of the strained film is given by sum of the normal, ε, and shear, χ, contributions Reference Romanov, Vojta, Pompe, Lefevre and Speck88 : E(ε) = [(1 + ν)/(1 − ν)]2Gε2ℎ and E(χ) = (1/2)Gχ2 h, where h is the film thickness, ν is the Poisson’s ratio, and G is the shear modulus. For LSMO/STO (ν ∼ 0.33, Reference Sandiumenge, Santiso, Balcells, Konstantinovic, Roqueta, Pomar, Espinós and Martínez12 G ∼ 68.2 MPa Reference Darling, Migliori, Moshopoulou, Trugman, Neumeier, Sarrao, Bishop and Thompson55 ), an estimation of the elastic energies yields E(χ)/h = 1.4 MPa and E(ε)/h = 10 MPa, indicating that the energetic contribution of the normal strain is almost one order of magnitude larger than the shear one. According to standard models, one would expect E(χ) and E(ε) to be canceled independently by twinning on (100) and (010) planes perpendicular to the substrate Reference Farag, Bobeth, Pompe, Romanov and Speck59 and a square grid of MDs, Reference Matthews6–Reference Jain, Harker and Cowley8 respectively. Surprisingly, however, despite the large difference between E(χ) and E(ε), MDs do not play any significant role in an explored thickness range up to 500 nm, whilst highly ordered (100) and (010) domain patterns already start to develop at ∼3 nm. Reference Sandiumenge, Santiso, Balcells, Konstantinovic, Roqueta, Pomar, Espinós and Martínez12 As discussed in the following section, such deviations from theoretical expectations are intimately tied to the atomic and electronic structure of the octahedral framework of the film.
III. RELAXATION MECHANISMS
The following discussion on the relaxation mechanisms of perovskite-type oxides is based on the behavior observed in LSMO films grown under tensile and compressive misfits under specific growth conditions favoring pure tilting and MD mechanisms, respectively. Such model films were grown by rf magnetron sputtering at 900 °C under pO2 = 0.14 torr, favoring a 2D layer-by-layer mechanism, and subsequently annealed for 1 h at the same temperature under pO2 = 360 torr. Reference Konstantinovic, Santiso, Colson, Forget, Balcells and Martínez89 By pure mechanisms here, it is meant that under a biaxial tensile stress, those films keep their in-plane lattice parameters fully strained at least up to the maximum explored thickness of 500 nm, while under a compressive stress they relax at the theoretical critical thickness by MDs. In the former case, transmission electron microscopy observations performed in the course of this research reveal that a very low density of MDs may actually occur at thicknesses above the critical value, exhibiting a highly inhomogeneous distribution on the interface plane and having a negligible impact on the relaxation level of the film, as demonstrated by accurate X-ray diffraction determinations of the lattice parameters. Reference Sandiumenge, Santiso, Balcells, Konstantinovic, Roqueta, Pomar, Espinós and Martínez12 The growth mechanism of epitaxial oxide films, however, is strongly dependent on kinetics and therefore on the deposition technique and growth parameters. LSMO films are commonly grown by pulsed laser deposition at lower temperatures, comprised between 640 and 720 °C, and by higher partial oxygen pressures in the range 0.3–0.4 torr, Reference Maurice, Pailloux, Barthélémy, Durand, Imhoff, Lyonnet, Rocher and Contour90–Reference Lebedev, Van Tendeloo, Amelinckx, Ju and Krishnan92 than the ones investigated here. In contrast with the present films, which keep a 2D layer-by-layer growth mechanism up to the largest investigated thickness, a common trend observed in LSMO films grown by pulsed laser deposition is the relaxation by a columnar growth mode above a critical thickness of several tens of nanometers, both under a tensile Reference Maurice, Pailloux, Barthélémy, Durand, Imhoff, Lyonnet, Rocher and Contour90 and a compressive misfit strain, Reference Jiang, Henry, Gnanasekar, Chen and Meletis91,Reference Lebedev, Van Tendeloo, Amelinckx, Ju and Krishnan92 on STO and LAO substrates, respectively. It has been argued that in those cases, columnar growth results from kinetic barriers hindering the movement of surface dislocations toward the film-substrate interface. Reference Maurice, Pailloux, Barthélémy, Durand, Imhoff, Lyonnet, Rocher and Contour90 On the other hand, Pr0.48Ca0.52MnO3 films grown on STO under a tensile misfit strain of 2.4% under pO2 ∼ 0.1 torr have been reported to relax by MDs and crack formation. Reference Herpers, O’Shea, MacLaren, Noyong, Rösgen, Simon and Dittmann93 The formation of MDs at the theoretical critical thickness under a compressive stress is observed in the present films, indeed to support an enhanced dislocation mobility at 900 °C. Nevertheless, the fact that under a tensile misfit stress, MDs are not formed either at 900 °C, even in the absence of columnar growth, points to the occurrence of additional misfit relaxation mechanisms, as discussed in the following sections.
A. Thickness dependence of lattice parameters
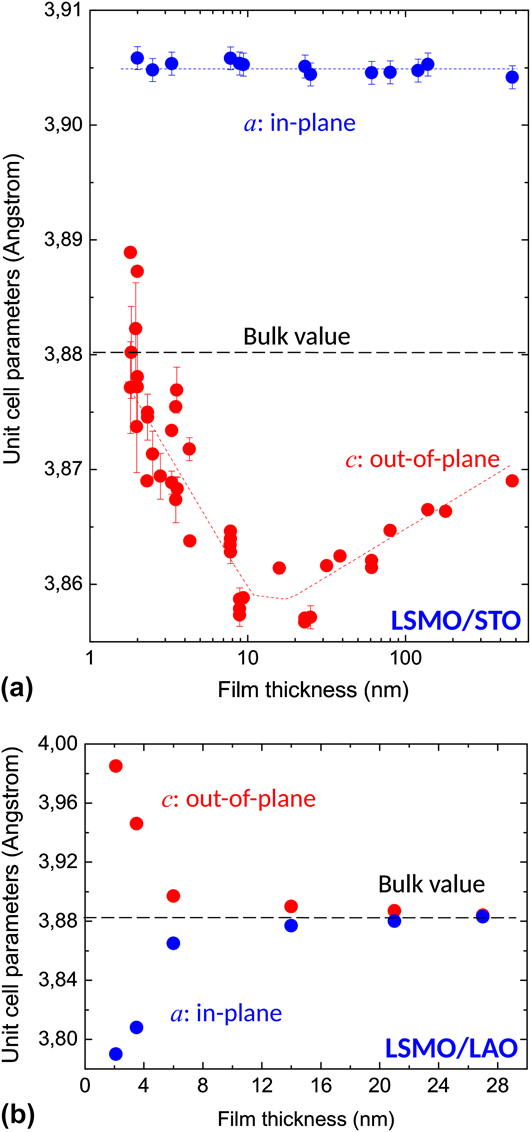
Figure 4 shows the thickness dependence of the in-plane and out-of-plane lattice parameters of LSMO films grown on STO (a) Reference Sandiumenge, Santiso, Balcells, Konstantinovic, Roqueta, Pomar, Espinós and Martínez12 and LAO (b) Reference Santiso, Roqueta, Bagués, Frontera, Konstantinovic, Lu, Yildiz, Martínez, Pomar, Balcells and Sandiumenge69 substrates, respectively [note that in Fig. 3(a) thickness values are presented in a logarithmic scale]. It can be observed that the LSMO behavior under compressive and tensile misfit strains is radically different, pointing to profound differences in the deformation mechanism. As shown in Fig. 4(a), under a tensile strain, the c-axis parameter experiences a progressive decrease from the thinnest film (h ∼ 1.9 nm) down to a minimum value at 10 nm < h < 25 nm followed by a smooth recovering. Notably, despite the critical thickness of these films is ∼10 nm, this trajectory is accompanied by a constant fully strained in-plane lattice parameter value throughout the whole explored thickness range. Reference Sandiumenge, Santiso, Balcells, Konstantinovic, Roqueta, Pomar, Espinós and Martínez12 Simultaneously, as the film grows beyond the constrain of the cubic substrate and adopts the equilibrium rhombohedral structure, the shear misfit strain is relaxed by the formation of highly ordered ferroelastic domains which start to grow at a critical thickness of ∼3 nm, coinciding with the thickness of the interface layer. Reference Sandiumenge, Santiso, Balcells, Konstantinovic, Roqueta, Pomar, Espinós and Martínez12
Thickness dependence of the in-plane and out-of-plane lattice parameters in the LSMO/STO (a) and LSMO/LAO (b) systems. Note that the thickness in (a) is plotted on a logarithmic scale. Data from Refs. Reference Sandiumenge, Santiso, Balcells, Konstantinovic, Roqueta, Pomar, Espinós and Martínez12 and Reference Santiso, Roqueta, Bagués, Frontera, Konstantinovic, Lu, Yildiz, Martínez, Pomar, Balcells and Sandiumenge69.
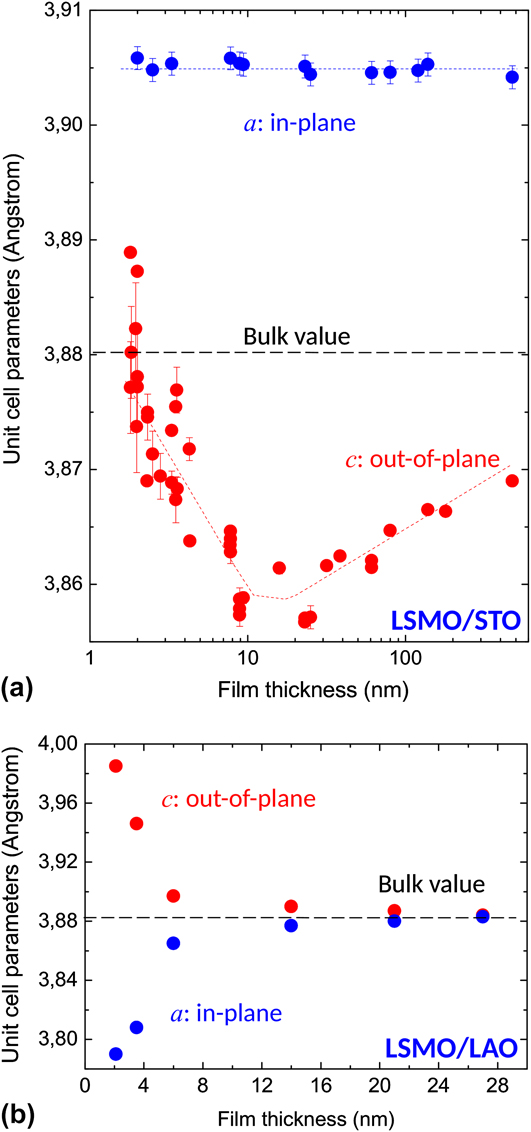
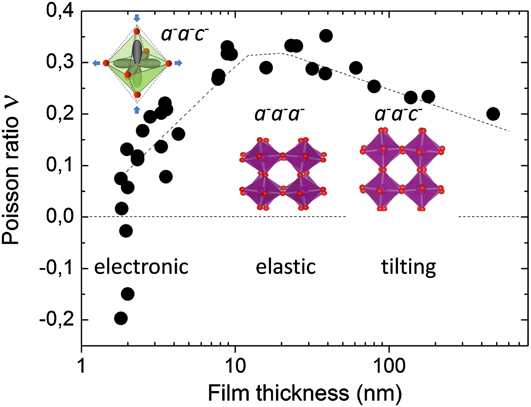
To understand the anomalous behavior of the lattice parameters observed in the LSMO/STO system, let us first focus on the thickness dependence of the lattice distortion. The variation of the Poisson’s ratio derived from the lattice parameters is shown in Fig. 5. The negative values observed at thicknesses smaller than ∼2 nm cannot be attributed exclusively to octahedral tiltings due to the concomitant effects of screening charges and charge localization on the lattice parameters. On the one hand, the larger ionic radius of Mn3+, 0.645 Å, compared to that of Mn4+ cations, 0.530 Å, Reference Shannon94 and on the other hand, the Jahn–Teller-induced compression of the Mn3+O6 octahedron along the c-axis, altogether favor a significant dilatation of the interface layer as schematically depicted in the inset. Taking this as a reference at the lattice parameters of the monoclinic phase of LSMO at low doping levels, Reference Mitchell, Argyriou, Potter, Hinks, Jorgensen and Bader95 it can be seen that in bulk samples the reduction of Mn cations from their nominal +3.3 state induces an enlargement of the pseudocubic unit cell in excess to that required to fully accommodate the tensile misfit with the STO substrate. Above the thickness of the interface layer, the oxidation state of the Mn cations progressively evolves to the bulk value. During this transition, the electronic energy gained by removing the orbital degeneracy in the Mn3+O6 octahedra becomes progressively exceeded by the elastic energy opposing a similar expansion of the equatorial Mn–O distances, until the tensilely strained rhombohedral phase condenses at a thickness of ∼10 nm. As shown in Fig. 5, at this stage the Poisson’s ratio attains the maximum value, ∼0.33, Reference Sandiumenge, Santiso, Balcells, Konstantinovic, Roqueta, Pomar, Espinós and Martínez12 which is the closest to that derived from the elastic constants determined for a La0.83Sr0.17MnO3 single crystal, ∼41 Reference Darling, Migliori, Moshopoulou, Trugman, Neumeier, Sarrao, Bishop and Thompson55 (discrepancies between thin film and single crystal values of the Poisson’s ratio may occur as a consequence of differences in the stoichiometry and in the characteristic internal microstructure of both forms of the material arising from the different populations of domain orientations). A signature of the rhombohedral phase is the convergence of the in-plane and out-of-plane components of the twin angle, as imposed by the equal tilting scheme in a − a − a −. Reference Sandiumenge, Santiso, Balcells, Konstantinovic, Roqueta, Pomar, Espinós and Martínez12 It is worth noting that this thickness also coincides with the theoretical thickness for misfit relaxation, ∼10 nm. Reference Sandiumenge, Santiso, Balcells, Konstantinovic, Roqueta, Pomar, Espinós and Martínez12,Reference Maurice, Pailloux, Barthélémy, Durand, Imhoff, Lyonnet, Rocher and Contour90 Strikingly, however, despite the fact that at the theoretical critical thickness, the film is “purely” elastically deformed and therefore conforms with the classical critical thickness theory, above this thickness, the system opts for a progressive octahedral pattern reconstruction instead of incorporating MDs. Reference Sandiumenge, Santiso, Balcells, Konstantinovic, Roqueta, Pomar, Espinós and Martínez12 This relaxation mechanism inherently establishes a strong thickness dependence of the magnetotransport properties of the film, Reference Sandiumenge, Santiso, Balcells, Konstantinovic, Roqueta, Pomar, Espinós and Martínez12 which has been recently substantiated by atomically resolved spectroscopic investigations revealing a thickness dependence of the strength of O-2p and Mn-3d orbital hybridization coupled to the octahedral tilting state. Reference Liao, Gauquelin, Green, Macke, Gonnissen, Thomas, Zhong, Li, Si, Van Aert, Hansmann, Held, Xia, Verbeeck, Van Tendeloo, Sawatzky, Koster, Huijben and Rijnders96
Thickness dependence of the Poisson’s ration in the LSMO/STO system (data from Ref. Reference Sandiumenge, Santiso, Balcells, Konstantinovic, Roqueta, Pomar, Espinós and Martínez12). The variation draws three deformation regimes: between 1.9 and ∼10 nm the evolution of the Poisson’s ration is governed by the progressive unbalance between the electronic energy gain associated to the Jahn–Teller distortion of the MnO6 octahedra and the elastic energy required to match the film with the substrate, driven by the progressive oxidation of Mn cations. The evolution of the octahedral distortion is schematically illustrated in the inset; between 10 and ∼25 nm, the LSMO film exhibits elastic behavior without tiltings, as schematically depicted in the inset, and between 25 and 500 nm, the evolution of the Poisson’s ratio is governed by the progressive unbalance between elastic and tilting contributions to the distortion. The respective tilt systems, monoclinic a − a − c − and rhombohedral a − a − a −, are indicated.

This intriguing behavior lays out a fundamental question, why above the critical thickness, once the LSMO/STO film has achieved a pure elastic state, the relaxation does not proceed by the MD formation as it occurs under a compressive misfit? Though it has been documented that the dislocation nucleation energy may depend on the sign of the misfit stress and that the critical thickness for the MD nucleation is generally larger for tensile than for compressive misfits, Reference Dong, Schnitker, Smith and Srolovitz97 this argument cannot explain huge deviations from the theory as those exhibited by these films. Moreover, the observation of MDs at thicknesses very close to the estimated theoretical critical thickness in the compressive LSMO/LAO system (see below) indicates that the observed differential behavior cannot be attributed to internal barriers to dislocation motion associated to the specific bonding and structure of the LSMO film.
B. Chemical control on relaxation mechanisms
Insights, however, can be found in the mechanisms governing phase transitions in perovskites under pressure. Reference Angel, Zhao and Ross98 At phase transitions, the deformation of these materials is governed by the interplay between the elastic distortion of the BO6 octahedra and their tilting, which in turn, appears to be controlled by the ratio of the compressibilities of the BO6 and AO12 coordination polyhedra, βB/βA Reference Angel, Zhao and Ross98,Reference Zhao, Ross and Angel99 : When the A-site cuboctahedron is more compressible than the B-site octahedron, i.e., βB/βA > 1, the tilts of the latter increase upon increasing the pressure. For the reverse situation, βB/βA < 1, the octahedra are softer than the structure as a whole, and the primary mechanisms of deformation is by compression of the B–O bond lengths. Zhao et al. observed that the resulting changes in the bond-valence sums (bond-valence strain) upon compression are equally distributed between the BO6 and AO12 polyhedra. Reference Zhao, Ross and Angel99 If this condition is fulfilled, the ratio between the compressibilities of the B- and A-sites, βB/βA, can be directly accessed from the crystal structure data according to the relation βB/βA = M A/M B, where the site specific parameters M A and M B are given by Reference Zhao, Ross and Angel99 :
 $${M_{\rm{i}}} = {{{R_{\rm{i}}}{N_{\rm{i}}}} \over B}\exp \left( {{{{R_0} - \left\langle {{R_{\rm{i}}}} \right\rangle } \over B}} \right)\quad ,$$
where 〈R i〉 is the average bond length and N i is the coordination number at site i = A, B; R 0 is a bond-valence parameter specific to any cation–anion pair, Reference Brown and Altermatt100 and B is a universal constant. Reference Brown and Altermatt100 Since this model relies exclusively on the structural properties of the materials, the underpinning concept can in principle be extended to other strain scenarios, such as biaxially strained thin films, provided that the basic principle of equal distribution of the bond-valence strain between the AO12 and BO6 polyhedra is guaranteed by the interconnectivity of the corner-sharing octahedral framework. The consideration of bond-valence parameters in the determination of the relative compressibilities of the cuboctahedral and octahedral coordination sites implicitly associates the elastic behavior of the perovskite structure to its chemical composition and bonding. Hence, considering the reduction of Mn cations to an oxidation state of +3, Reference Sandiumenge, Santiso, Balcells, Konstantinovic, Roqueta, Pomar, Espinós and Martínez12,Reference Riedl, Gemming, Dörr, Luysberg and Wetzig101 the composition of the interfacial layer can be written as La3+ 1−x Sr2+ x Mn3+O2− 3−δ, where charge neutrality imposes δ = x/2. Unfortunately, the precise stoichiometry of this layer is unknown, yet it can be very sensitive to growth conditions. The tendency of Sr ions to diffuse away from the interface toward the surface in LSMO epitaxial films has been extensively reported Reference Jalili, Han, Kuru, Cai and Yildiz102–Reference Dulli, Dowben, Liou and Plummer105 and has been suggested to behave exponentially. Reference Dulli, Dowben, Liou and Plummer105 In the limiting but unrealistic case of an interfacial LaMnO3 (δ = 0) phase, where no oxygen vacancies are formed and charge neutrality is accomplished by the total depletion of Sr ions, the A- and B-site cations have the same formal charge, implying that the MnO6 octahedra are more compressible than the AO12 cuboctahedra. Reference Angel, Zhao and Ross98 In practice an equilibrium concentration of oxygen vacancies and Sr is likely to exist owing to the proximity of the STO substrate. Thus, a partial substitution of La by Sr is expected, which would shift the M A/M B ratio toward unity making the compressibilities of the A- and B-sites more similar. As the film grows beyond the thickness of the interfacial layer, the Sr concentration is expected to evolve progressively until the nominal stoichiometry is achieved at a thickness of ∼10 nm. Hence, the compressibility ratio βB/βA at this stage can be determined from the M A and M B parameters using stoichiometry-averaged R 0 values in Eq. (1), yielding 0.958. According to this description, the thickness dependence of the B-site cation valency below a thickness of ∼10 nm appears to induce a progressive unbalance between the A- and B-site compressibilities, from βB/βA > 1 (favoring elastic deformation of interatomic distances) to βB/βA < 1 (favoring an octahedral tilting deformation mechanism), as schematically shown in Fig. 5. In this latter regime, the continuous increase of the c-axis parameter observed in Fig. 3(a) suggests a progressive transition from the elastic to the tilting regimes mediated by an unwinding of the octahedra along the in-plane [100] and [010] axes, α (=β), causing a simultaneous and equal enlargement of the three principal axes of the presudocubic unit cell. If the rhombohedral symmetry is maintained, these mechanisms would give rise to an auxetic behavior. However, it is found that the in-plane rotation is decoupled from the out-of-plane rotations, Reference Sandiumenge, Santiso, Balcells, Konstantinovic, Roqueta, Pomar, Espinós and Martínez12 indicating a structural transition back to the monoclinic tilt system a − a − c − (see Fig. 5). It is interesting to note that at very large tensile misfit strains, when the lattice parameter of the substrate is out of reach of the film one upon suppressing octahedral rotations, as is the case, for instance, of LSMO/MgO (ε = 0.086), full relaxation was observed in ∼20 nm wide and ∼5 nm high nanodots by MDs inherited from the MgO substrate. Reference Abellán, Zabaleta, Santiso, Casanove, Dix, Aguiar, Browning, Mestres, Puig, Obradors and Sandiumenge106
C. Relaxation under compressive stress
In contrast with the behavior observed under a tensile misfit strain, the evolution of the in-plane and out-of-plane lattice parameters for the compressive LSMO/LAO system, shown in Fig. 3(b), reproduces the typical behavior of a MD mediated relaxation processes. Reference Santiso, Roqueta, Bagués, Frontera, Konstantinovic, Lu, Yildiz, Martínez, Pomar, Balcells and Sandiumenge69 Transmission electron microscopy observations reveal that MDs are introduced at a thickness comprised between 2 and 3.5 nm, Reference Sandiumenge, Bagués, Santiso, Paradinas, Pomar, Konstantinovic, Ocal, Balcells, Casanove and Martínez68 in good agreement with the estimated theoretical critical thickness of ∼1.7 nm. Reference Santiso, Roqueta, Bagués, Frontera, Konstantinovic, Lu, Yildiz, Martínez, Pomar, Balcells and Sandiumenge69 In this case, the biaxial Poisson’s ratio determined for the 2 nm thick LSMO film, prior to the introduction of MDs, ∼0.35, Reference Sandiumenge, Bagués, Santiso, Paradinas, Pomar, Konstantinovic, Ocal, Balcells, Casanove and Martínez68 is similar to that determined for the tensile LSMO/STO system in the elastic regime, Reference Sandiumenge, Santiso, Balcells, Konstantinovic, Roqueta, Pomar, Espinós and Martínez12 thus signaling the absence of elastic anomalies. The reason why the compressive misfit promotes an elastic state and MD formation is very likely related to the topological constrains imposed by octahedral rotations on atom displacements. Total energy calculations show that an increase of rotation angles rapidly destabilizes the crystal structure due the concomitant enhancement of ion–ion repulsions. Reference Woodward57 Qualitative insights can be gathered from the lattice contraction required to accommodate the misfit. Assuming that the a − a − a − tilt system is preserved [see Fig. 1(b)], from crystal structure data reported for LSMO, Reference Martin, Shirane, Endoh, Hirota, Moritomo and Tokura72 the tilt angle can be estimated as α = 5.4°. Using the relation a d = a 0 cos2 α, relating the distorted lattice parameter a d to the tilt angle α (a 0 = 2d Mn–O, is the undistorted lattice parameter), it can be readily appraised that the accommodation of a −2.3% compressive misfit strain on a rigid octahedron basis would increase the octahedral tilts up to α = 10.2°, thus doubling the value of the bulk equilibrium structure. Alternatively, if the tilt system is allowed to transform to a − a − c −, the variation of the in-plane lattice parameters as a function of the two independent rotation angles, α and γ, given by a d = b d = a 0 cos α cos γ, would result in an even larger increase, up to ∼14°. Such large increments of the rotation angles are expected to cause a destabilizing contraction of the perovskite lattice, and therefore the formation of MDs under compressive strain can be attributed to the frustration of the octahedral tilt mechanism favoring the build up of elastic strains and subsequent MD formation.
IV. SELF-ORGANIZATION OF FREE SURFACES
A notable aspect of the richness and complexity of the relaxation mechanisms reviewed in this work, which has relatively received little attention, is their impact on self-organization phenomena at the free surfaces of epitaxial oxide films. Indeed, self-organization phenomena, as modeled in semiconductor epitaxy, results from stress-induced growth instabilities and a balance between surface and interface energies. Therefore, as far as the development of such instabilities is determined to a large extend by the mechanical behavior of the films, the soft mechanical response of octahedral frameworks at dissimilar interfaces very likely hinders the growth of islands in comparison with semiconductor or metal films. However, as reviewed below, oxide epitaxy offers conceptually new strategies for the creation of functional nanostructures. An example is the creation of novel surface patterns by tuning the growth kinetics. A further strategy for the fabrication of ordered nanostructures takes advantage of strain relief patterns created by TWs and MD networks under appropriate growth conditions. The interest of these patterns is 2-fold; first, they induce a quasi-periodic strain field which can modify the electronic transport and magnetic properties on the length scale of the defect spacing, which is significantly smaller than the miniaturization limit of current top-down approaches in oxides. Secondly, since the chemical composition and the atomic structure can be severely modified at the core of MDs and TWs, rendering them physical properties different from the bulk film, films containing selforganized misfit relieving defects can be regarded as ordered nanocomposites formed by distinct filamentary (MDs) or sheet-like (TWs) phases. However, despite extensive investigations devoted to the generation of three-dimensional heterophase nanostructures, Reference MacManus-Driscoll, Zerrer, Wang, Yang, Yoon, Fouchet, Yu, Blamire and Jia107–Reference Pomar, Konstantinovic, Bagués, Roqueta, Lòpez-Mir, Balcells, Frontera, Mestres, Gutiérrez-Llorente, Scepanovic, Lazarevic, Popovic, Sandiumenge, Martínez and Santiso111 those aspects considered above have been largely overlooked.
A. Island growth
As MDs, strain-induced surface undulations were originally perceived as detrimental to the quality of thin films. It was only after intense research that this phenomenon was understood as a spontaneous self-organization process of great interest for the lateral miniaturization of semiconductor structures. The origin of stress-induced surface undulations initiating self-organization processes relies on the Asaro–Tiller–Grinfeld surface instabilty, Reference Asaro and Tiller112–Reference Srolovitz114 which states that a growing stressed surface is unstable against perturbations with wavelengths longer than a critical value given by
 $${\lambda _{\rm{c}}} = {{\pi {\gamma _{\rm{s}}}} \over {{\varepsilon ^2}}}{{1 - \nu } \over {2G{{\left( {1 + \nu } \right)}^2}}}\quad ,$$
where γs is the surface energy density. According to Eq. (2), λc is strongly influenced by the rigidity, G, of the material. As discussed above, the symmetry mismatch very likely induces interfacial tilting transitions entailing the softening of the B–O–B bond angles interconnecting the octahedral framework, Reference Carpenter, Sondergeld, Li, Liebermann, Walsh, Schreuer and Darling10,Reference Darling, Migliori, Moshopoulou, Trugman, Neumeier, Sarrao, Bishop and Thompson55,Reference Goodwin56 thus anticipating large values of λc for systems under misfit strains within the reach of octahedral rotations. Conversely, for misfit strains out of reach of octahedral tiltings, the system is expected to behave elastically and relax by the introduction of MDs at the critical thickness. This particular response of perovskites to interfacial dissimilarity affects the first atomic layers and therefore has a strong influence on the growth mode of the films. Depending on the length scale of the octahedral perturbations along the growth direction, framework structures will tend to keep their free surfaces flat, thus hindering island formation through the Stranski–Krastanov growth mode. Reference Teichert115
Island growth has been otherwise achieved by increasing the interface energy in highly mismatched perovskite substrates or using combinations of different crystal structures for the film and the substrate. It is worthy to note that the consequence of the latter approach is the suppression of the octahedral connectivity at the interface, which is expected to result in a dramatic loss of wetting capability. The result is the direct growth of islands on the bare substrates according to the Volmer–Weber growth mode. Reference Teichert115 In this way, for instance, in perovskite-on-perovskite systems island growth has been accomplished in highly mismatched systems such as BaZrO3/LAO Reference Abellán, Sandiumenge, Casanove, Gibert, Palau, Puig and Obradors116 and Pb(Zr0.52Ti0.48)O3/STO, Reference Chu, Szafraniak, Scholz, Harnagea, Hesse, Alexe and Gössele117 under compressive misfit strains of −9.5% and −3.4%, respectively. Examples of perovskite island formation in structurally dissimilar substrates like rock-salt and fluorite are La0.7Sr0.3MnO3/MgO Reference Abellán, Zabaleta, Santiso, Casanove, Dix, Aguiar, Browning, Mestres, Puig, Obradors and Sandiumenge106 and La0.7Sr0.3MnO3/(Y)ZrO2, Reference Zabaleta, Valencia, Kronast, Moreno, Abellán, Gázquez, Sandiumenge, Puig, Mestres and Obradors118 respectively. Conversely, fluorite nanowires with aspect ratios above ∼100 have been obtained on perovskite substrates (CeO2/LaAlO3). Reference Gibert, Abellán, Martínez, Román, Crespi, Sandiumenge, Puig and Obradors119,Reference Gibert, Abellán, Benedetti, Puig, Sandiumenge, García and Obradors120 As a result of the large misfit strains used in these cases, interfaces appear highly dislocated and therefore are affected by strain fields that may extend over a few unit cells into the island. Such strain fields may have negative effects on the functionality of the material, such as the induction of polarization instabilities in ferroelectrics. Reference Chu, Szafraniak, Scholz, Harnagea, Hesse, Alexe and Gössele117 To circumvent this problem, alternative strategies promoting confined growth have been explored. In this way, dislocation-free PbTiO3 nanoislands exhibiting spontaneous polarization have been grown under a small tensile misfit strain of 0.15% on conducting Nb-doped SrTiO3, using block copolymer micelles followed by epitaxial crystallization. Reference Kim, Han, Kim, Lee, Alexe, Baik and Kim121 The feasibility of confined growth has also been demonstrated using track-etched polymer membranes to obtain LSMO nanowires. Reference Carretero-Genevrier, Mestres, Puig, Hassini, Oró, Pomar, Sandiumenge, Obradors and Ferain122 Self-organization of perovskite oxide substrate surfaces also offers the possibility to use them as templates for the growth of nanostructures. Reference Sánchez, Ocal and Fontcuberta123 The strong sensitivity of the growth mode to the atomic termination plane of STO substrates, for instance, was demonstrated in pulsed laser deposited Y-stabilized ZrO2, which forms continuous films or islands depending on the selected interfacial plane. Reference Cavallaro, Ballesteros, Bachelet and Santiso124
B. Surface patterning by misfit relieving defects
1. Misfit dislocations
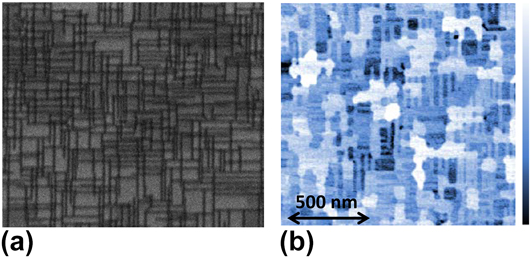
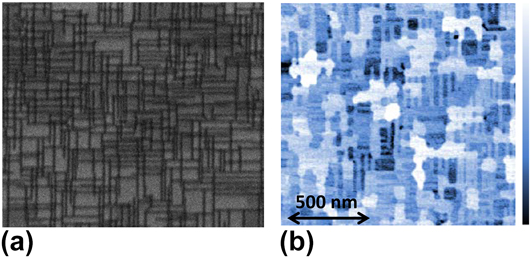
Spontaneous surface roughening and island formation, extensively studied in semiconductor epitaxy, typically produces nanostructures with broad size distributions and poor positional order. To overcome this drawback, MDs have been used to generate strain patterned surfaces in semiconductor Reference Shiryaev, Jensen, Hansen, Petersen and Larsen125–Reference Springholtz and Wiesauer127 and metal Reference Lee and Clemens128,Reference Brune, Giovannini, Bromann and Kern129 systems or more recently to tune Dirac surface sates in topological insulators. Reference Zeljkovic, Walkup, Assaf, Scipioni, Sankar, Chou and Madhavan130 However, this strategy has received little attention among the oxide film community. Two recent reports highlight the feasibility of extending this concept to the perovskite oxide epitaxy in PbZr0.2Ti0.8O3/SrRuO3/STO Reference Pandya, Damodaran, Xu, Hsu, Agar and Martin67 and LSMO/STO Reference Sandiumenge, Bagués, Santiso, Paradinas, Pomar, Konstantinovic, Ocal, Balcells, Casanove and Martínez68 heterostructures. These studies observe a growth mechanism transition from two-dimensional layer-by-layer growth to guided selforganized three-dimensional island growth upon the introduction of MDs. For LSMO/LAO, it was verified that the local strain field around the dislocations, as determined from high resolution transmission electron microscopy matches with isotropic elasticity calculations, thus allowing a quantitative determination of their effects on the free surface of the films. Reference Sandiumenge, Bagués, Santiso, Paradinas, Pomar, Konstantinovic, Ocal, Balcells, Casanove and Martínez68 The impact of the buried MD network on the film surface is illustrated in Fig. 6. A projection of the MD network on the interface plane of a 3.5 nm thick LSMO film, obtained by orientation contrast scanning electron microscopy, is shown in Fig. 6(a). This thickness is close to the critical thickness and at this stage, and the MD network is formed by irregularly spaced and short (∼100 nm) dislocation segments oriented along the [100] and [010] directions, having an average spacing of 25 nm. Reference Sandiumenge, Bagués, Santiso, Paradinas, Pomar, Konstantinovic, Ocal, Balcells, Casanove and Martínez68 Figure 6(b) shows an AFM image of the same film shown in (a) clearly revealing that the surface topography consists of a network of ridges mimicking the underlying dislocation network. Since preferential growth occurs along the locus of the buried MDs, the resulting islands are highly anisotropic. This indicates that larger MD segments could promote the growth of longer ridges or nanowires.
(a) AFM image showing the topography of a 3.5 nm thick film, consisting of ridges aligned with the [100] and [010] directions, and terraces; the color scale bar corresponds to a full range of 1.5 nm. (b) Orientation contrast SEM images revealing the MD network of the same film. The scale bar is the same for both images. It can be observed that the ridge pattern mimics the underlying buried dislocation network. Figure from Ref. Reference Sandiumenge, Bagués, Santiso, Paradinas, Pomar, Konstantinovic, Ocal, Balcells, Casanove and Martínez68.
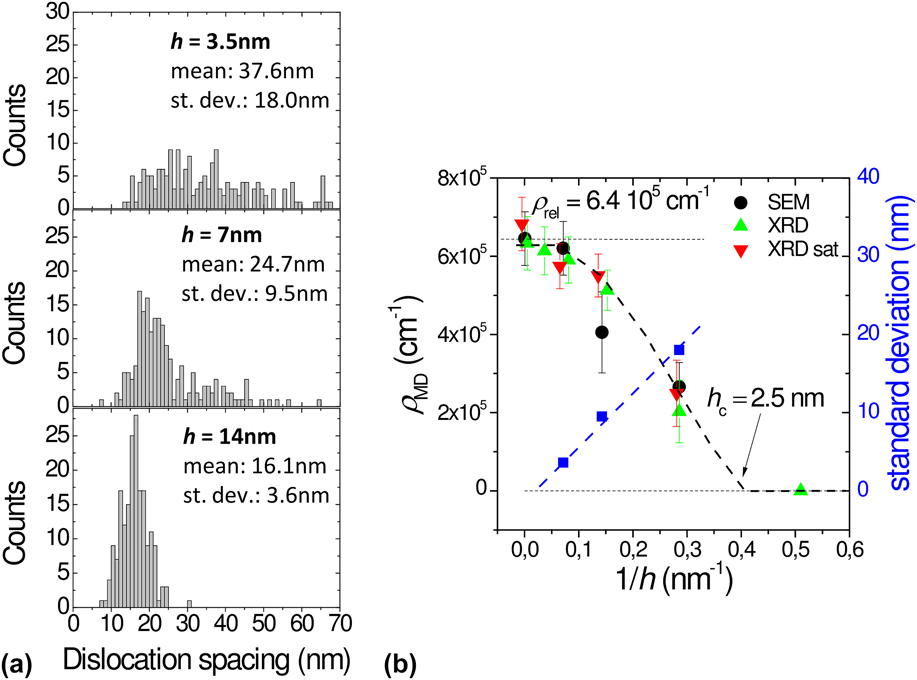
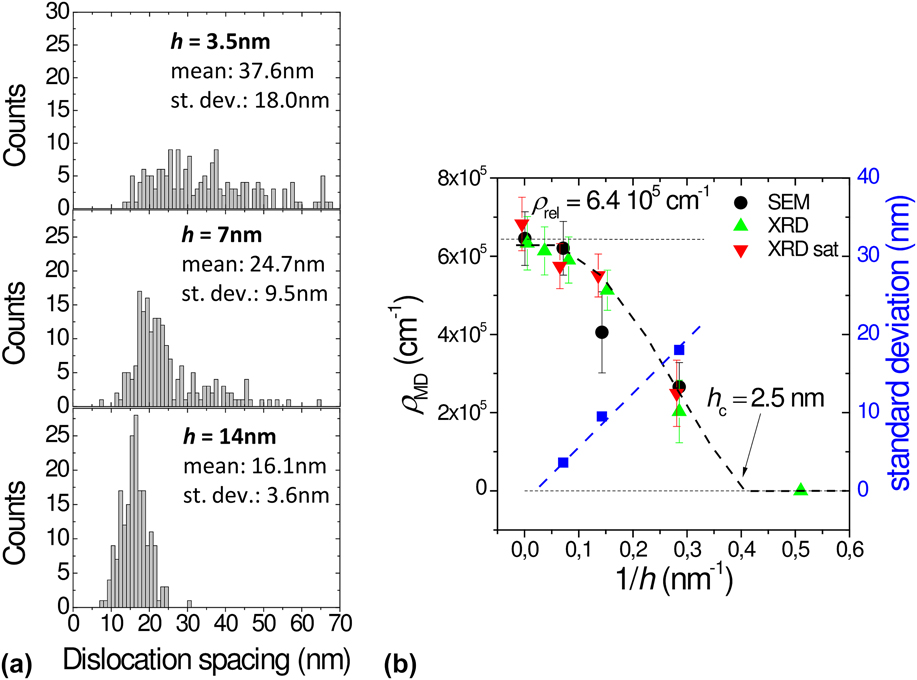
One difficulty associated to this strategy is that the density and the degree of order of the MD network depends on the film thickness and on the mobility of dislocations in the strained film. Assuming that dislocations are introduced as half-loops at the film surface, once nucleated they increase in size as the film thickens, thereby increasing the length of the MD segments. As the misfit is relieved by the expansion of existing half-loops, the nucleation of new ones becomes kinetically suppressed, Reference Hull and Bean131 while MDs segments rearrange their positions to minimize elastic interactions between them, resulting in increasingly ordered patterns. Nevertheless, as noted by Springholz and Wiesauer, Reference Brune, Giovannini, Bromann and Kern129 MD rearrangements require a high dislocation mobility, which occurs when MDs can glide on the interface plane. Moreover, the repulsive elastic interaction between neighboring MDs providing the driving force for self-organization is also maximized for this configuration. Reference Brune, Giovannini, Bromann and Kern129 Unlike in the semiconductor epitaxy, where the Burgers vectors of MDs are typically inclined with respect to the interface plane, this condition is indeed commonly fulfilled in perovskite films in which 〈100〉{010} constitutes an easy glide system. However, even in this favorable situation, dislocation movements in perovskite oxides are likely affected by intrinsic barriers. First, the atomic structure of the MD core in the LSMO/LAO system has been determined to be rather complex, being dissociated in two 1/2〈100〉 partials separated by one unit cell, Reference Sandiumenge, Bagués, Santiso, Paradinas, Pomar, Konstantinovic, Ocal, Balcells, Casanove and Martínez68 which makes the atomistic mechanism of glide more complex than for a perfect dislocation. Secondly, the ionic character of LSMO and LAO very likely induces comparatively large Peierls stresses hindering the MD glide on the interface plane. In the LSMO/LAO films considered in this work, the thickness dependence of the lattice parameters is very pronounced below the first 8 nm, and despite that total relaxation is not observed up to a thickness of ∼24 nm, films are almost relaxed at 14 nm [see Fig. 3(b)]. The evolution of the histograms of MD spacing with film thickness, shown in Fig. 7(a), clearly reflects the strong sensitivity of the degree of order of the MD network on the film thickness. The thickness dependence of the dislocation density, ρMD, and the standard deviation of the MD spacing distribution, are shown in Fig. 7(b). It can be observed that for film thicknesses larger than the critical thickness, h > h c, the dislocation density roughly follows the relation ρMD = ρrel(1 − h c/h), Reference Santiso, Roqueta, Bagués, Frontera, Konstantinovic, Lu, Yildiz, Martínez, Pomar, Balcells and Sandiumenge69 in agreement with the Matthews-Blakeslee model, Reference Matthews6 and that the standard deviation of the MD spacing distribution, indicative of the degree of order of the MD network, follows a linear dependence on 1/h. This behavior in fact suggests that under ideal kinetic conditions, intrinsic barriers to dislocation motions do not impede the achievement of highly ordered MD networks at relatively small thicknesses. This behavior is in strong contrast, for instance, with that observed in BaTiO3 epitaxial films grown also under a compressive misfit on STO by pulsed laser deposition at much lower temperatures of 700 °C, Reference Suzuki, Nishi and Fujimoto16 where despite first MDs are introduced at a thickness close to the theoretical critical thickness, complete misfit relaxation is not achieved almost up to a thickness of 500 nm. These large divergences between the relaxation behavior of the two systems clearly reflects the dramatic consequences of growth conditions on dislocation dynamics.
(a) Histograms of the lateral MD spacing in LSMO/LAO films for film thicknesses of 3.5, 7, and 14 nm, as indicated in the panels. (b) Thickness dependence of the MD density on the reciprocal film thickness, as measured by SEM (black symbols) and XRD as estimated from the LSMO cell parameter value (green symbols) and from X-ray diffraction satellite peak positions (red symbols), along with the standard deviation of the distribution. The MD density required for total relaxation is indicated by ρrel. Figure modified from Ref. Reference Santiso, Roqueta, Bagués, Frontera, Konstantinovic, Lu, Yildiz, Martínez, Pomar, Balcells and Sandiumenge69.
Let us next consider the impact of buried MD networks on the surface of the films. The link between the morphological evolution of a free surface and its strain state is given by the surface chemical potential, Reference Abellán, Sandiumenge, Casanove, Gibert, Palau, Puig and Obradors116
 $$\mu \left( x \right) = {\mu _0} + {\gamma _{\rm{s}}}\Omega \kappa \left( x \right) + \Omega w\left( x \right)\quad ,$$
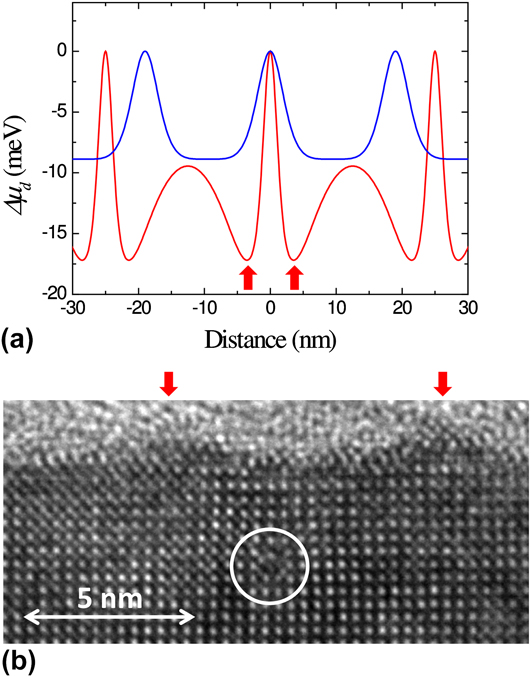
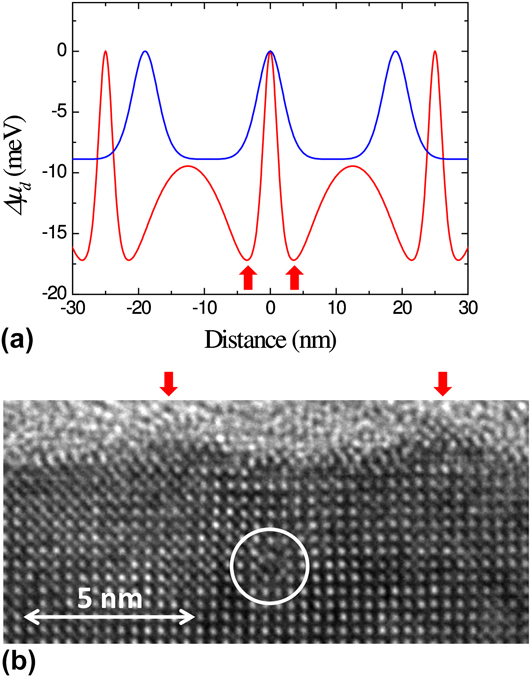
where μ0 is the chemical potential of the unstressed flat surface, γs is the surface energy density, Ω is the volume of a growth unit, κ(x) is the surface curvature, and w(x) is the local surface strain energy density. Assuming a flat surface, κ ∼ 0, the chemical potential reduction relative to the position of the MD is given by Δμd(x) = μ(x) − μd (μd is the surface chemical potential of a growth unit at the position of an underlying MD). Reference Sandiumenge, Bagués, Santiso, Paradinas, Pomar, Konstantinovic, Ocal, Balcells, Casanove and Martínez68 Therefore, MDs induce a modulation of the binding energy of adatoms, whose periodicity mimics that of the dislocation network. Figure 8(a) depicts the chemical potential reduction, Δμd(x), at the position of MDs calculated for 3.5 and 6 nm thick films, the latter exhibiting a smaller average MD spacing of 19 nm. For the 3.5 nm thick film, the fluctuation draws two minima at each side, ∼4 nm away from the MDs, corresponding to the locus of the maximum misfit relaxation, where the chemical potential is reduced by 17 meV. This calculation agrees well with the position of the ridges observed in the cross-section high resolution transmission electron microscopy image shown in Fig. 8(b). It is to be noted that once a ridge is formed, the rapid increase in surface curvature at that point causes the competition between the surface energy, γκ(x), and strain energy, w(x), terms in Eq. (3), eventually hindering its vertical growth. Reference Yang, Liu and Lagally132 This effect introduces a kinetic limitation for the vertical growth of strain-induced nanostructures. Figure 8(a) also shows the calculation for a 6 nm thick film. It can be observed that the amplitude of the Δμd(x) fluctuation rapidly smoothes out as the film thickens, and the free surface moves further apart from the strain sources, while the MD spacing is reduced, resulting in the disappearance of the nanostructure. Reference Sandiumenge, Bagués, Santiso, Paradinas, Pomar, Konstantinovic, Ocal, Balcells, Casanove and Martínez68 Therefore, since the degree of order of the MD network increases with the film thickness, the optimum thickness for the generation of MD-induced topographic patterns result from a compromise between the degree of dislocation order and the amplitude of the surface chemical potential fluctuation.
(a) Calculated modulation of the surface chemical potential for 3.5 and 6 nm thick films. Sharp maxima occur at the locus of the buried MDs. The calculation was performed using average MD spacings experimentally determined for each thickness. (b) Cross-section high resolution transmission electron microscopy image corresponding to a 3.5 nm thick film, exhibiting a MD shown inside the white circle and an undulated surface (outgrowths are indicated by red arrows). Note that the sharp minima in Δμd(x) found in the 3.5 nm thick film occurs at the locus of the outgrowths identified in (b). Data from Ref. Reference Sandiumenge, Bagués, Santiso, Paradinas, Pomar, Konstantinovic, Ocal, Balcells, Casanove and Martínez68.
In addition to the topographic effect, current sensitive atomic force microscopy indicates enhanced resistivity along the projected locus of the MDs on the film surface.
Reference Sandiumenge, Bagués, Santiso, Paradinas, Pomar, Konstantinovic, Ocal, Balcells, Casanove and Martínez68
According to theoretical studies, a compressive strain has two competing effects on the magnetotransport properties of manganites.
Reference Fang, Solovyev and Terakura21,Reference Mukherjee, Cole, Woodward, Randeria and Trivedi22
On the one hand, it favors in-plane hopping and a metallic state, while the double exchange mechanism promotes ferromagnetism. On the other hand, a compressive strain also narrows the bandwidth and induces an orbital bias favoring preferential occupancy and localization at out-of-plane
 ${d_{3{z^2} - {r^2}}}$
orbitals. The balance between these competing effects appears to be controlled by the ratio between the out-of-plane and in-plane lattice parameters, c/a, in such a way that c/a > 1.0 works against the metallic ferromagnetic behavior and therefore results in an increased resistivity.
Reference Fang, Solovyev and Terakura21
The variation of the c/a ratio across the position of a MD, determined from high resolution electron microscopy images, nicely matches with this theoretical model, showing a clear increase at the MD position.
Reference Sandiumenge, Bagués, Santiso, Paradinas, Pomar, Konstantinovic, Ocal, Balcells, Casanove and Martínez68
2. Domain walls
As discussed above, ferroelastic-type DWs can be considered as an additional class of misfit-relieving extended defects, which form at the boundary between adjacent orientational domains. When a thin ferroelastic or ferroelectric film is grown under the constrain of a cubic substrate, its characteristic three-dimensional domain architecture may be adapted to minimize the misfit shear strain [see Fig. 1(c)]. DWs constitute a class of homointerface where symmetry breaking and strain may eventually induce the formation of chemically and structurally different phases Reference Farokhipoor, Magén, Venkatesan, Íñiguez, Daumont, Rubí, Snoeck, Mostovoy, de Graaf, Müller, Döblinger, Scheu and Noheda133 and that commonly exhibit different physical properties than that of the domains. Reference Catalan, Seidel, Ramesh and Scott63,Reference Seidel, Singh-Bhalla, He, Yang, Chu and Ramesh134 In LSMO/STO thin films, for instance, ferroelastic domains form an ordered pattern of ∼1 nm thick regions centered at (100) and (010) DWs submitted to a compressive strain of ∼3.5% relative to the tensile strained domains. Reference Balcells, Paradinas, Baguès, Domingo, Moreno, Galceran, Walls, Santiso, Konstantinovic, Pomar, Casanove, Ocal, Martínez and Sandiumenge135 Conducting atomic force and magnetic force microscopies revealed a one order of magnitude increase in conductivity and enhanced magnetic moment at the DWs, in consistency with a compressive strain-induced enhancement of Mn 3d–O 2p orbital overlapping leading to a broader bandwidth and stronger magnetic interactions. Reference Balcells, Paradinas, Baguès, Domingo, Moreno, Galceran, Walls, Santiso, Konstantinovic, Pomar, Casanove, Ocal, Martínez and Sandiumenge135
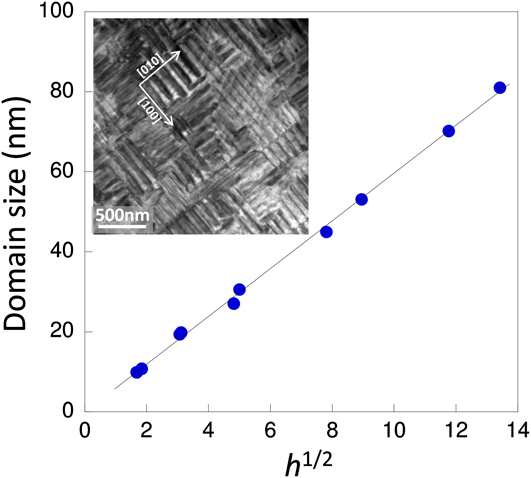
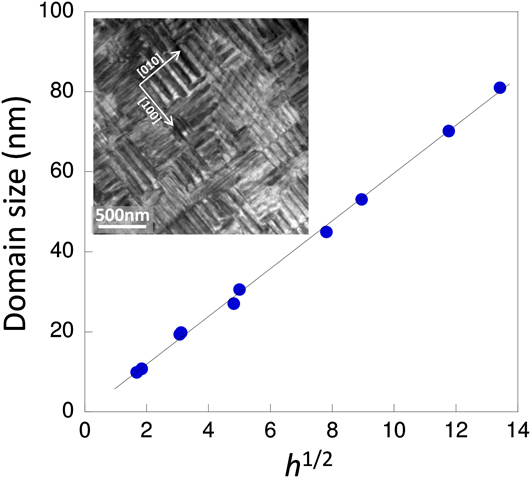
Self-organization of DWs in epitaxial systems is driven by symmetry and total elastic energy minimization considerations. Thermodynamic modeling of ferroelastic domains in epitaxial systems predicts a square root dependence of the DW spacing, Λ, on the thickness of the films, h, given by Ref. Reference Pomar, Santiso, Sandiumenge, Roqueta, Bozzo, Fronera, Balcells, Martínez and Konstantinovic139 Λ = (kD τ h)1/2, where k is a numerical constant and D τ = γDW/Gετ 2 is an elastic length–scale parameter given by the ratio of the DW energy, γDW, and the elastic energy density. Reference Konstantinović, Sandiumenge, Peńa, Santiso, Balcells and Martínez140 Here ετ is the transformation misfit strain associated to the cubic to ferroelastic phase transition. The elastic length-scale parameter, D τ, determines the film thickness at which the effect of coherency with the substrate on the development of orientational domains vanishes. Reference Farag, Bobeth, Pompe, Romanov and Speck59 Particularly, for h < D τ, an exponential increase of Λ is predicted toward the interface, where it becomes ∞. Reference Farag, Bobeth, Pompe, Romanov and Speck59 For a domain wall energy γDW = 3 mJ/m2, one obtains D τ ∼ 3 nm, in good agreement with the thickness at which ferroelastic domains are observed to nucleate in the LSMO/STO system. Reference Sandiumenge, Santiso, Balcells, Konstantinovic, Roqueta, Pomar, Espinós and Martínez12,Reference Santiso, Balcells, Konstantinovic, Roqueta, Ferrer, Pomar, Martínez and Sandiumenge70 Figure 9 depicts the thickness dependence of the domain size, Λ, along with a typical TEM image, showing a highly ordered domain pattern in LSMO/STO. Despite the mechanical evolution shown in Fig. 5, the theoretically predicted h 1/2 dependence is followed surprisingly well in the LSMO/STO system in a thickness range comprised between 3 and 500 nm, Reference Santiso, Balcells, Konstantinovic, Roqueta, Ferrer, Pomar, Martínez and Sandiumenge70 suggesting a primary role of the DW energy in the control of the spatial order of DWs.
Domain size dependence on the square root of the film thickness, h 1/2. Inset shows a bright field transmission electron microscopy image of the twin pattern viewed along the [001] zone axis of a LSMO/STO film. Data from Ref. Reference Santiso, Balcells, Konstantinovic, Roqueta, Ferrer, Pomar, Martínez and Sandiumenge70.
C. Formation of surface nanopits
An alternative approach for creating surface nanostructures takes advantage of the strong sensitivity of the film structure to the growth kinetics. For instance, the columnar growth mode observed in pulsed laser deposited films has been exploited to create selforganized vertical LSMO nanorods on top of a wetting layer grown under compressive misfit. Reference Jiang, Henry, Gnanasekar, Chen and Meletis91 On the other hand, selforganized arrays of nanopits have been created at the surface of LSMO films grown on STO substrates. Reference Konstantinović, Santiso, Balcells and Martínez138 An advantage of this method is that the formation of the surface nanostructure takes place in a 2D layer-by-layer growth mode and the overall microstructure of the film is not altered. Notably, the structural modifications induced by tuning the growth mode allow control on the magnetoresistance response of the films. Reference Pomar, Santiso, Sandiumenge, Roqueta, Bozzo, Fronera, Balcells, Martínez and Konstantinovic139 An investigation of the mechanisms underpinning the formation of the nanopits shows that they result from the morphological evolution of continuous grooves created during the first growth stages to relax the strain concentration at step edges. Reference Konstantinović, Sandiumenge, Peńa, Santiso, Balcells and Martínez140 As a consequence, the resulting surface nanopits exhibit a high degree of order along the direction normal to the underlying substrate steps and can be tuned through the miscut angle of the substrate surface. In contrast with the formation mechanism reported for semiconductor systems such as InGaN-based heterostructures, where nanopits form at the apex of threading dislocations Reference de Sousa Pereira, Martins, Trindade, Watson, Zhu and Humphreys141 or are associated to other strain sources embedded in the volume of the film Reference Liliental-Weber, Chen, Ruvimov and Washburn142 ; in this case, the presence of preexisting defects which could deteriorate the properties of the film is not required. The resulting nanostructured surfaces can be successfully used as a template as demonstrated by the integration of epitaxial Au nanocrystals exhibiting a perfect octahedral shape and excellent metallic-like behavior across the Au/La0.7Sr0.3MnO3 interface. Reference Konstantinović, Sandiumenge, Peńa, Santiso, Balcells and Martínez140
V. SUMMARY AND CONCLUSIONS
Despite the large effort directed so far toward the description of octahedral tilting perturbations and their correlation with physical properties, there are fundamental aspects related to the mechanisms governing their formation and length scales that remain poorly understood. The perspective presented in this work provides some qualitative insights into some of these mechanisms.
-
(1) Interfacial perturbations are typically associated with tilting transitions accompanying changes in the symmetry of the octahedral pattern. Experimental evidences support that the primary driving force for these transitions is the symmetry mismatch between the substrate and film tilt systems. The symmetry of the perturbation is thus constrained by the intersection of the substrate and the film ones. In the general case, this condition implies a symmetry reduction accompanied by an increase in the octahedral rotation degrees of freedom allowed to accommodate a superimposed misfit strain in an ideally rigid unit or gear wheel-like mode. Actually, however, there is a complex interplay between elastic deformation and rigid unit rotations, which is thought to be specific of each particular structure in terms of cation composition and the tilt system.
-
(2) Once perturbations nucleate at a given interface, their growth is probably limited by the tolerance factor and the relative compressibility of the A- and B-site coordination environments. However, the strain range attainable by octahedral rotations is small, particularly for compressive misfits and high symmetry systems in which octahedral rotations are strongly constrained. The behavior observed in LSMO thin films grown under a tensile misfit on STO substrates also evidences that under specific circumstances, tilting transitions may also develop above a certain film thickness, avoiding the formation of MDs. In such a case, the continuous variation of the Poisson’s ratio with film thickness observed beyond the elastic regime, suggests an increasing participation of octahedral tilts to release the elastic energy. This progressive unbalance signals a delicate equilibrium between elastic and tilting energies, which in the limiting case would drive the film to an ideal fully tilted state. Conversely, when interfacial octahedral perturbations are frustrated, elastic strains build up and misfit relaxation occurs by MD formation at the critical thickness. Shear strains, on the other hand, are accommodated by the formation of ferroelastic-like domains, whose topological order remains unaltered through the successive transformations of the film structure. This suggests that the lateral order of twin patterns is mostly determined by the DW energy.
-
(3) Epitaxial complex oxide perovskites provide a rich scenario for the self-organization of free surfaces. The ultimate expression of the capability of octahedral frameworks to develop laterally ordered nanostructures has been provided by the observation of highly periodic modulations of octahedral rotation angles accompanied by periodic transitions in the tilt system, in a Li-ion conductor based perovskite. This finding opens new directions for the investigation of bottom-up approaches in these materials. As far as classical growth modes are concerned, the reduced rigidity of the octahedral framework along with the low interfacial energy expected for interconnected dissimilar octahedral patterns, favors complete wetting of the substrate and hinders the build up of the elastic energy required for the development of morphological instabilities and island growth during the initial growth stages. However, laterally ordered nanostructured surfaces can be produced by other approaches. On the one hand, it has been demonstrated that under precise growth conditions, substrate step-induced perturbations can be preserved at the surface of films, leading for instance to ordered arrays of surface nanopits. On the other hand, the strain associated to misfit relieving defects, like MDs and DWs, also provide a solid platform for the generation of ordered surface patterns, although to date the formers have received little attention. Such misfit relief patterns not only affect the surface topography by periodic modulations of the surface chemical potential of adatoms but also alters the spatial distribution of strain-sensitive functional properties like electrical transport and magnetic order on length scales smaller than those achieved by top-down approaches in oxides. There is no doubt that octahedral frameworks still demand new challenging conceptual approaches to further exploit their potential in nanofabrication and interface manipulation.
ACKNOWLEDGMENTS
The author would like to acknowledge discussions on diverse aspects relevant to this work with J. Santiso, A. Pomar and J. Roqueta. This research has been sponsored by the Spanish MINECO (“Severo Ochoa” Program for Centers of Excellence in R&D: SEV-2015-0496, MAT2015-71664-R; MAT2012-33207, and MAT2013-47869-C4-1-P).