

Introduction
Over the last few decades the composition of public spending in the United States (US) and many other countries has changed dramatically. This is especially apparent in the US states, which used to spend the vast majority of their budget on public goods such as police protection and transportation, but which now spend a considerable portion of their resources on redistributive programmes (Jones Reference Jones1990; Jacoby and Schneider Reference Jacoby and Schneider2009). Meltzer and Richard (Reference Meltzer and Richard1981) famously argued that growing income inequality will lead to increased redistribution in democracies. Though this model has important implications for understanding budgets in the current era of rising inequality, students of the US state budgets have seldom considered whether the Meltzer-Richard (M-R) model may explain variation in the composition of public expenditure overtime and across states, a matter we take up in this article.
Growing inequality has captured the attention of scholars in numerous academic disciplines, but has been underexplored in state- and local-level public policy research. This relative neglect of inequality by students of the budget process and fiscal policy is particularly puzzling in light of the fact that some of the most prominent economic models of the last few decades are focussed on the effects of growing economic inequality on government spending. The M-R model, which suggests that growing inequality will lead to growing redistributive spending, holds the promise of helping us to understand a puzzling development in state spending over the last few decades. Many observers have argued that competition among states to avoid becoming “welfare magnets” will lead to a “race to the bottom” in welfare spending and, more generally, in redistributive spending, with states choosing to invest in other programmes that are more attractive for business investment and to wealthy residents (Peterson Reference Peterson1995; Bailey and Rom Reference Bailey and Rom2004; Fellowes and Rowe Reference Fellowes and Rowe2004). Yet, in fact, redistributive spending has grown much more rapidly than other types of spending (Rodgers et al. Reference Rodgers, Beamer and Payne2008; Witko and Newmark Reference Witko and Newmark2010). Can growing inequality explain this increase in redistribution in the states as the seminal M-R model predicts?
Though the M-R model predicts increasing redistribution, other theoretical models produce different expectations, and the empirical research into the M-R model produces inconsistent support for it (Benabou and Ok Reference Benabou and Ok2001; Moene and Wallerstein Reference Moene and Wallerstein2003). Nevertheless, because of the fact that both inequality and redistributive spending are generally increasing in the states, and because the states play an important role in the US welfare state, we think that it is well worth examining whether temporal variation in inequality may explain some of the increase in redistributive spending in the US states. We use data for 1976–2008 and a Bayesian approach that allows for robust estimation in the presence of fixed effects and temporally correlated data. After controlling for a number of other factors that have been found to affect spending outcomes, we discover evidence that higher levels of inequality are associated with larger increases in redistributive spending. In addition, we show that these findings are robust to using household or individual-level pretransfer income inequality and different definitions of redistributive spending. The results suggest that higher levels of inequality are associated with greater redistributive spending, offering empirical evidence that fiscal policy at the state level responds to “correct” for growing levels of income inequality, a process consistent with the M-R hypothesis.
The M-R model and “redistributive” spending in the American states
Beginning in the late 1970s, just as inequality was about to increase rapidly and as equalising trends were on the decrease (Sloan Reference Sloan1997), a number of economists began to consider how the distribution of income may influence government redistribution (Romer Reference Romer1975; Peppard and Roberts Reference Peppard and Roberts1977; Meltzer and Richard Reference Meltzer and Richard1981). In particular, the M-R model is one of the most influential economic models of the last several decades.Footnote 1 Part of the reason it has been so influential is that it is fairly parsimonious and highly intuitive. The key assumptions of the M-R model are that (1) in systems of universal suffrage the median voter is decisive; (2) because income distributions are typically skewed to the right, the median voter will have income considerably lower than the mean income earner; (3) this causes the median voter to prefer high taxes on the wealthy and redistribution out of economic self-interest. Further, when there is a greater gap in income between the median and mean, the median voter will prefer more redistribution. This basic assumption that welfare policies draw public attention and crystallise citizen preferences both before and after adoption is relatively unambiguous and has sufficient empirical support in the literature (Sloan Reference Sloan1997; Hayes Reference Hayes2007; Bendz Reference Bendz2015).
Not all theorists agree that growing inequality will be associated with increasing redistribution, however. The beauty of the M-R model is its simplicity. In reality, nonetheless, attitudes held by the public and the nature of the redistributive programmes themselves can influence both the preferences for and the actual amount of redistribution carried out by governments. The M-R model is essentially a one-shot game in which one’s place in the income distribution is static, and redistributive policy is updated when the income distribution changes. Though all models are abstractions from reality, Benabou and Ok (Reference Benabou and Ok2001) argue that the assumption of the M-R model that people only consider their current income when developing their redistributive preferences is misleading as income is dynamic and people tend to overestimate their possibility of upward mobility. Thus, what they call the “possibility of upward mobility” affects people’s attitudes towards redistribution because redistributive policy persists overtime. The precise implications of the model are complex and nuanced, but for our purposes it is sufficient to note that from Benabou and Ok’s (Reference Benabou and Ok2001) perspective growing inequality would not be expected to be monotonically associated with growing redistribution (see also Kelly and Enns Reference Kelly and Enns2010).
Other scholars have noted that the specific nature of redistributive programmes will condition the relationship between inequality and redistribution. Different types of redistributive programmes play different roles in society (Hayes Reference Hayes2007; Hatch and Rigby Reference Hatch and Rigby2015). Though we first think of “welfare” (i.e. payments to the poor) when we think of redistribution, much of what the modern welfare state does is provide social insurance – things like pensions, health insurance, workers’ compensation and unemployment insurance – as a hedge against risks that all workers and individuals face (Korpi and Palme Reference Korpi and Palme1998; Rehm et al. Reference Rehm, Hacker and Schlesinger2012). In a comparative study, Moene and Wallerstein (Reference Moene and Wallerstein2003) find that these types of social insurance expenditures have generally increased in response to growing inequality, whereas pure transfers to the poor (e.g. cash welfare benefits) have decreased as inequality grows. Benabou (Reference Benabou2000) also notes that different types of programmes may be more or less likely to be supported as inequality increases and that sometimes it is rational for citizens to support less redistribution as inequality grows. Given the fact that perceptions of potential for upward mobility affect attitudes, as well as the fact that structure of redistributive programmes varies dramatically across polities, it may not be surprising that empirical support for the M-R models is inconsistent. Some studies find that an increase in inequality is associated with an increase in redistribution, whereas others find the opposite (for a recent review of this literature see Bae Reference Bae2015).
Nevertheless, a number of studies do find that inequality is associated with greater demand for, and increases in, redistributive spending. In a study of 22 European countries, Finseraas (Reference Finseraas2009) finds that as inequality grows, so does the public demand for redistribution. Kenworthy and Pontusson (Reference Kenworthy and Pontusson2005) note that across Organisation for Economic Cooperation and Development (OECD) countries there is a strong positive association between a high Gini coefficient and redistribution, which they take as evidence of the M-R model. Interestingly, however, one outlier with respect to the “growing inequality-growing redistribution” link is the US (Kenworthy and Pontusson Reference Kenworthy and Pontusson2005), which has had rapidly growing inequality but less rapidly growing redistributive spending at the national level than other OECD countries. One reason that the US may stand out is because of its somewhat different mix of pure transfers versus social insurance – other affluent countries tend to have more expansive public pension and, certainly, health insurance programmes, which are the types of social insurance programmes that Moene and Wallerstein (Reference Moene and Wallerstein2003) argue grow in response to inequality. However, another major difference between the US and most other countries is that, because of fiscal federalism, the US states play an important role in the country’s welfare state, and are likely to play an important role in any redistributive response to inequality.
Though scholars have yet to examine whether the M-R model may explain temporal variation in redistributive spending among the states, studies focussing on all US government spending including state and local spending and local governments have found support for the idea that growing inequality is associated with growing redistribution. Aggregating federal, state and local US public spending, Meltzer and Richard (Reference Meltzer and Richard1983) found that from the 1940s through the 1970s redistributive spending was higher when the ratio of mean to median income was higher. Examining a panel of Texas counties, Bae (Reference Bae2015) finds that as income inequality increases redistributive spending also increases. This likely suggests that the M-R model may be more applicable in the US context – an environment with an advanced level of economic development, where capital scarcity is relatively low but labour supply is on the shorter end of the scale, akin to conditions described in Li (Reference Li2000) and de Mello and Tiongson (Reference de Mello and Tiongson2006). Moreover, compared with regional and local governments in many other countries, the US states enjoy far greater levels of fiscal autonomy.
Further, it is worth examining whether the M-R model may apply to state redistributive spending as inequality has certainly been growing in the states since the late 1970s. Kelly and Witko (Reference Kelly and Witko2012) observe that between 1976 and 2007 the pretax, pretransfer household-level Gini coefficient of income inequality increased from 0.456 to 0.502, and no state demonstrated a lower Gini coefficient at the end of the time period. However, there is substantial variation in the rate of increase and level of income inequality at the end of this period across states. For instance, in North Dakota, one of a couple of states with a very small increase, the Gini coefficient increased from 0.475 to 0.482. By contrast, Connecticut had one of the largest increases in inequality. Connecticut’s Gini coefficient grew from 0.462 to 0.523, moving it from one of the relatively equal to one of the most unequal states during this time period.
This growing inequality may influence redistributive spending because, although the federal government plays the lead role in redistribution in the US (Peterson Reference Peterson1995), the state governments also substantially contribute in this area (Noble Reference Noble1988; Bailey and Rom Reference Bailey and Rom2004; Fellowes and Rowe Reference Fellowes and Rowe2004; Rodgers Reference Rodgers2005; Rodgers et al. Reference Rodgers, Beamer and Payne2008). Part of such sharing of responsibilities is due to a balance of powers between the federal and state levels of government, as well as a growing transfer and sharing of some of the welfare provision responsibilities to state and local governments since the 1980s (Adkisson and Peach Reference Adkisson and Peach2000; Mead Reference Mead2005; Rodgers and Tedin Reference Rodgers and Tedin2006; Rodgers et al. Reference Rodgers, Payne and Chervachidze2006). Rodgers et al. note, for instance, that states differ “in the sophistication, inclusiveness, and generosity of the welfare plans they have adopted” (Reference Rodgers, Beamer and Payne2008, 527). Programmes for the elderly are largely funded and operated by the federal government but programmes providing benefits for the poor and low income, with AFDC/TANF and Medicaid being the largest such programmes, are typically jointly financed and administered by the federal government and states (Bailey and Rom Reference Bailey and Rom2004; Fellowes and Rowe Reference Fellowes and Rowe2004; Hatch and Rigby Reference Hatch and Rigby2015). For the jointly run programmes, the federal government typically sets benefit and eligibility floors, but states can use their own resources to expand programmes beyond federal minimums. States also have discretion over programme eligibility, policy method, reach, inclusiveness, structure, enrolment and policy objectives – all of which affect actual benefit distribution (Jensen Reference Jensen1988; Lerman and Mikesell Reference Lerman and Mikesell1988; Adkisson and Peach Reference Adkisson and Peach2000; Soss et al. Reference Soss, Schram, Vartanian and O’Brien2001; Beamer Reference Beamer2005; Rodgers Reference Rodgers2005; Rodgers et al. Reference Rodgers, Beamer and Payne2008). There are also smaller jointly run redistributive programmes as well as smaller redistributive programmes that are run solely by the states (such as childcare, fuel or healthcare subsidies). In addition, innovators like California have expanded social insurance programmes like paid parental leave in recent years, which make an increasingly important part of the welfare state in affluent countries.
Initially, it seems unlikely that states would expand redistribution in response to growing inequality. Scholars have argued that the states can be expected to participate in a race to the bottom to reduce redistributive spending in order to limit taxes and invest in spending to attract business investment and wealthy residents (Peterson Reference Peterson1995; Bailey and Rom Reference Bailey and Rom2004; Fellowes and Rowe Reference Fellowes and Rowe2004). Nevertheless, the share of state spending and total spending on redistributive programmes has actually grown dramatically over the last few decades with expenditures on other programmes declining substantially as a share of total state spending (Witko and Newmark Reference Witko and Newmark2010). If we consider “welfare” spending (AFDC/TANF, Medicaid and other similar transfer programmes), the share of state spending going to these programmes increased from 16 to 27% between 1976 and 2008. Nevertheless, the fact that redistributive spending has increased on average whereas states have sought to avoid becoming a “welfare magnet” is remarkable (Bailey and Rom Reference Bailey and Rom2004).
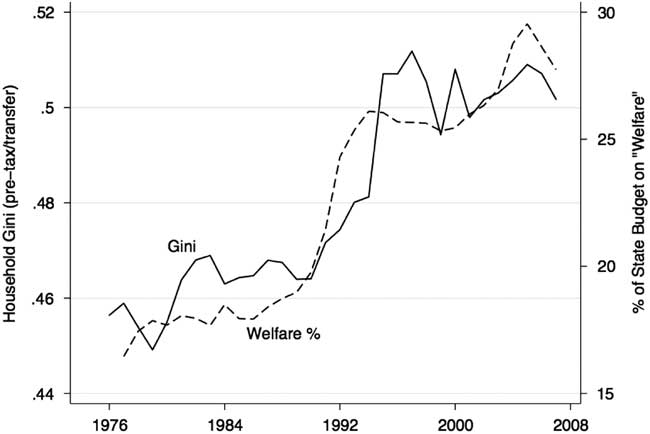
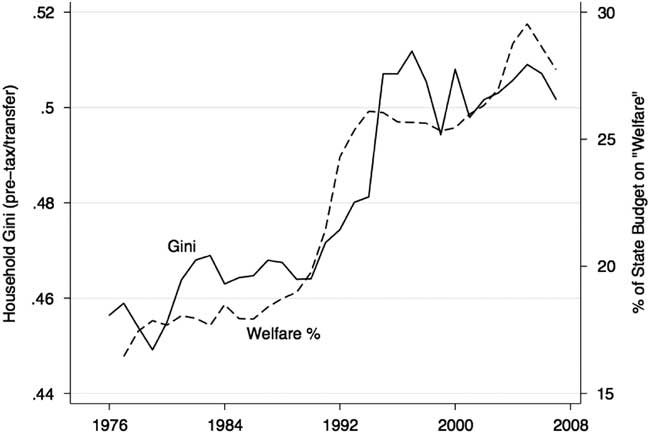
Is it possible that growing inequality is driving some of the growth and variation in redistributive spending in the US states? Figure 1 shows the time trends for the average percentage of states’ budgets dedicated to welfare programmes (as a dashed line) and the average level of income inequality as captured by the Gini coefficient (as a solid line). The horizontal axis represents the year of interest, the left side vertical axis represents possible values of the Gini coefficient and the right side vertical axis represents possible values of welfare spending. Importantly, state welfare spending here excludes both local and federal spending, as we are strictly interested in the actions of the 50 states’ governments. In this figure we can see that, averaging across states, there is a striking parallel between growing inequality and the percentage of state spending devoted to welfare programmes. Indeed, the bivariate correlation is 0.92.
State inequality and welfare spending, 1976–2008.
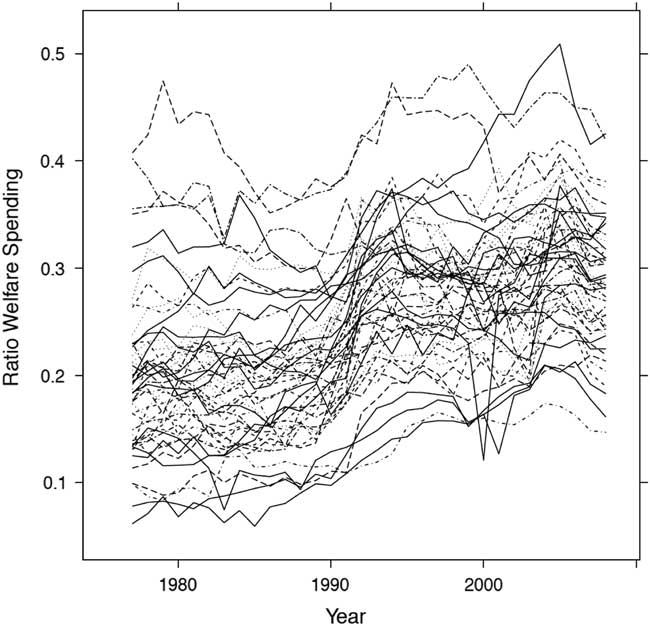
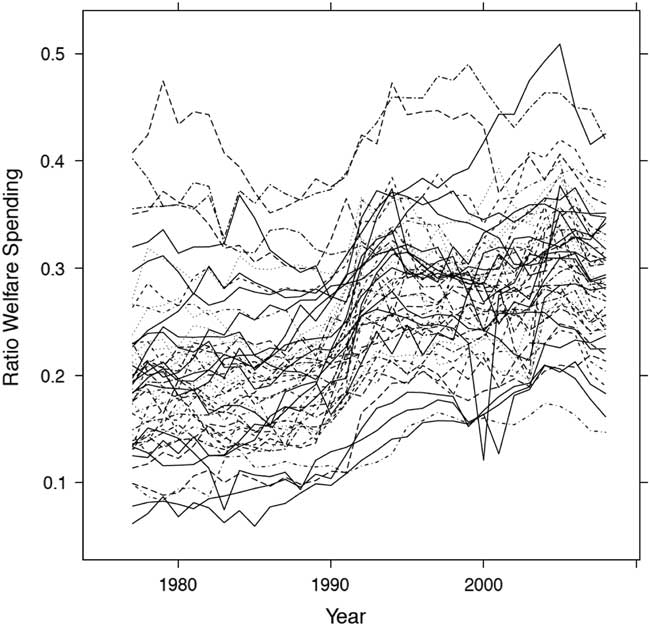
Of course, the figure of the annual averages obscures a great deal of variation. The size of the growth of redistributive spending varies among the states (Rodgers and Tedin Reference Rodgers and Tedin2006; Rodgers et al. Reference Rodgers, Payne and Chervachidze2006; Rodgers et al. Reference Rodgers, Beamer and Payne2008). Figure 2 shows the heterogeneity among states’ proportion of the budget dedicated to welfare spending. In this figure, each line represents another state, and the vertical axis represents the proportion of the state’s budget dedicated to welfare spending, without federal transfers. As can be seen, the lines are spread out to show a lot of between-state variance. On balance, the lines are trending upwards, but the trajectories overtime show a lot of variance. These differences in state-level trends may reflect the link between inequality and public opinion, in support of existing evidence that redistributive spending varies across states (Franko Reference Franko2016), and also that different state governments have varying propensities to spend on redistributive programmes (Witko and Newmark Reference Witko and Newmark2010), regardless of levels of inequality. Indeed, we can exploit this cross-state and temporal variation in inequality and spending to determine whether growing inequality is associated with increased redistributive spending after controlling for other factors affecting state spending. We now turn to a discussion of our analytical approach and data.
Line plot of the ratio of welfare spending to total spending by state, net federal transfers.
Data and modelling approach
We examine US state panel data for 1976–2008. This period is ideal as inequality began to increase significantly in the late 1970s after a number of decades of being relatively flat. Univariate statistics for measures of income inequality show significant within- and between-state variability during the more than three decades under our evaluation.
Outcome variable: state spending data
The base source for state-level finances in the study is from Pierson et al. (Reference Pierson, Hand and Thompson2014), who are researchers at the Center for Governance at Willamette University. They have compiled a comprehensive database of state government finances for 1967–2012 using US Census Data. Relevant to our study, the database provides annual information on state revenues and expenditures.Footnote 2
Redistributive spending is a common term in scholarly studies and virtually everyone has a good idea of what it is, but it is not entirely obvious how to precisely measure it. In a literal sense, redistribution takes place when beneficiaries of programmes derive more in the form of government benefits than they pay into government coffers for the cost of those benefits. In practice, determining whether programmes meet this definition can be challenging (McClellan and Skinner Reference McClellan and Skinner2006). Nevertheless, in the academic literature scholars typically categorise “welfare” (cash benefits for the poor, food and housing subsidies, free medical care, etc.) and “social insurance” programmes (old age pensions, unemployment insurance, government medical insurance, etc.) as redistributive (Korpi and Palme Reference Korpi and Palme1998; Moene and Wallerstein Reference Moene and Wallerstein2003). Social insurance programmes are arguably less redistributive than welfare programmes because workers typically pay into them and the benefits derived are often greater for higher income earners. On the other hand, at the time that users derive benefits from social insurance programmes they generally have lower incomes than those paying into them (e.g. when they are retired or out of work). Whether social insurance programmes are redistributive over the life-cycle depends on their specific structure, but the larger US social insurance programmes probably are (Liebman Reference Liebman2002; McClellan and Skinner Reference McClellan and Skinner2006). Transfers to those with a very low income or to the poor are more clearly pure redistribution (though, even here, this may not always be the case over the life-cycle). Other programmes, like education, have redistributive aspects, but are less purely redistributive in incidence or intent (Jones Reference Jones1990).
Given this range of definitions, in the main body of the article we focus on spending that is most clearly redistributive. Specifically, we examine the ratio of the categories of state spending that the US Census Bureau defines as “public welfare expenditures” to per capita total expenditure, net federal intergovernmental transfers in each of the 50 US states.Footnote 3 This ratio measures redistributive spending in the states, net federal transfer expenditures. The advantage of using this approach is that it eliminates the possibility of federal-level decisions and eligibility criteria driving the results. Rather, by subtracting federal dollars we focus exclusively on what relative importance the states have in redistribution when allocating their own resources.
The appendix shows the results for four alternative measures that include federal transfers, that evaluate the spectrum of how broadly or narrowly redistribution is defined, and that alternate between studying the proportion of money spent on wealth redistribution to the overall per capita number of dollars spent on redistribution. US state policy scholars will note that there are a number of different ways to measure welfare “effort” found in studies focussed on welfare policy, but our approach is certainly one common way to measure state spending in different types of programmes. This approach is also useful because it combines information on the different dimensions of the total cost of welfare spending, such as access and benefit levels (Bailey and Rom Reference Bailey and Rom2004), over which states have some control and make quite different choices (Soss et al. Reference Soss, Schram, Vartanian and O’Brien2001). The approach is also most consistent with the practice in comparative and national-level tests of the M-R model.
Explanatory variable: measuring income inequality
Although the M-R model focussed on the mean-median income gap because of the importance of the median voter to the theory, most scholars have not actually examined the M-R theory using this as the measure of income inequality. One reason is data availability (Moene and Wallerstein Reference Moene and Wallerstein2003). More substantively, in the US, in particular, it is certainly the case that the median voter and the median income earner are very different people because of low voter turnout, though the precise mismatch of median voter and income earner depends on the state, election year and so on. Thus, we use a broader measure of income inequality, the Gini coefficient of preredistribution income, which is a commonly used measure of inequality in policy research (Headey et al. Reference Headey, Goodin, Muffels and Dirven1997; Kenworthy and Pontusson Reference Kenworthy and Pontusson2005; Kelly and Witko Reference Kelly and Witko2012; Bae Reference Bae2015), and it is a broader measure of inequality because it captures income differences across the entire income distribution. Of course, in practice, all commonly used valid measures of income inequality are highly correlated.Footnote 4 Focussing on preredistribution incomes makes sense, as redistributive spending would occur in response to income inequality as a corrective policy tool. Although the average state income inequality has increased substantially over the last few decades (as already seen in Figure 1), there is substantial variation in the rate of increase with a handful of states having relatively modest increase, and several states having a large increase, which provides us with good leverage.
For measures of income inequality, we utilise personal and household income data collected by the US Census Bureau as part of its Annual Social and Economic Supplement (ASES). Unlike sources that were used in most previous studies, this source allows the construction of measures of pretax and pretransfer income inequality for both households as well as individuals in all US states, which is useful as governments may select to respond only to one or the other type of inequality. One limitation of this data source is that the income questions are “top-coded” on the ASES – that is, all incomes above a certain dollar threshold are coded as that threshold – meaning that the true extent of income inequality is somewhat understated. However, this means that if we do find a relationship between inequality and redistributive spending we can be fairly confident that it would plausibly be even stronger with a data source that does not “top-code” income.
Control variables
Of course, a number of other factors besides income inequality may explain growing spending and we must control for these alternative explanations. We follow recent empirical studies when selecting the most relevant variables to achieve models that sufficiently and parsimoniously fit specifications (as in Rodriguez Reference Rodriguez1999; Moene and Wallerstein Reference Moene and Wallerstein2001; Pinizza Reference Pinizza2002; de Mello and Tiongson Reference de Mello and Tiongson2006; Bae Reference Bae2015). As redistributive programmes are often countercyclical, it is necessary to control for economic conditions. Thus, we include variables for the unemployment rate, change in gross state product (GSP) and level of income for the poorest people in the state (earning at the 10th percentile).Footnote 5 As the US welfare state is geared heavily towards individuals aged over 65 years, we control for the proportion of the population that is 65 years or older. Racial antipathy generally lessens support for generous redistributive spending in the US (Bailey and Rom Reference Bailey and Rom2004; Fellowes and Rowe Reference Fellowes and Rowe2004); thus, we control for the percentage of a state’s population that is nonwhite. There may also be economies of scale or changes in demand functions associated with larger populations. We control for the log of the population to account for such economies of scale in demand. We obtained data on GSP, unemployment rates and personal incomes from the Bureau of Economic Analysis. Information on population size, population over 65, and minority populations were collected from the US Census Bureau.
The literature on political-business cycles indicates that expenditures of all types may increase in gubernatorial election years (Hansen Reference Hansen1999), and, further, it may be that pressures to spend are higher in more electorally competitive states. Thus, we respectively control for whether there is a gubernatorial election in the current fiscal year, and for electoral competitiveness, using the folded Ranney index. For the data on gubernatorial elections and the folded Ranney index we rely on Klarner’s (Reference Klarner2014) online database.Footnote 6 We measured state government ideology using the updated, NOMINATE-based measure of annual state government ideology created by Berry et al. (Reference Berry, Ringquist, Fording and Hanson1998).
A final control variable is state government ideology. Liberal or left-leaning state governments generally spend more on redistributive programmes (Nicholson-Crotty et al. Reference Nicholson-Crotty, Theobald and Wood2006). Past work also shows that as inequality increases, public opinion becomes more liberal (Franko Reference Franko2016), which in turn affects how liberally elected government officials act (Kelly and Witko Reference Kelly and Witko2012). Thus, part of the inequality’s effect may take place through the government ideology variable if we find this to be significant. Finally, though debt is not usually considered in models of redistribution, strict state laws regarding debt may constrain the ability of the states to spend on redistribution, and we examined this possibility. As 11 states are not allowed to issue state-backed debt, we include the model with this variable in the Online Appendix.
One built-in control that we consider, which almost certainly has an influence on state spending, is federal grants. In a trivial sense this must be the case because federal money given for a particular purpose must be spent for that purpose. Thus, federal grants influence spending allocations by states (Nicholson-Crotty et al. Reference Nicholson-Crotty, Theobald and Wood2006; Witko and Newmark Reference Witko and Newmark2010) and local governments (Hendrick Reference Hendrick1998). We account for federal transfers by simply removing all federal funds from the denominator of the dependent variable to examine the impact of state conditions on a state’s own resources to leave federal decisions out of the process to the extent possible. We do so in order to understand how state variation in income inequality is related to state spending decisions.Footnote 7
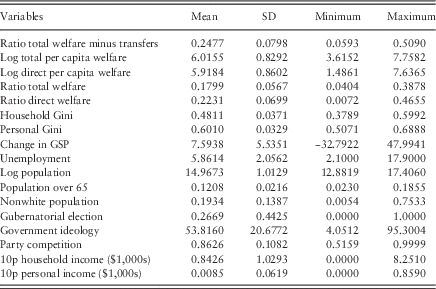
Table 1 presents the univariate descriptive statistics of each of our variables, including a few additional control variables that are described and used in the supplement. For each variable, the table shows the mean, standard deviation, minimum value and maximum value. There are five measures of redistributive spending that are listed. The first is the one we focus on in the main text of the article, total welfare spending as a proportion of all state spending, net federal transfers. The four alternate measures of this variable are considered as robustness checks in the supplement: two measures are logged as per capita welfare spending (one using total welfare expenditures including federal transfers and the other using direct expenditures of a state’s own-source revenue). The next two measures look at these two types of welfare spending, but as a ratio of all state spending.Footnote 8 Our primary predictor of interest is state inequality, as measured by the Gini index. The descriptive statistics for the Gini measure are reported for two conditions – one based on household income and another on personal income. Finally, we report the descriptive statistics for our control variables.
Descriptive statistics of variables, 1976–2008
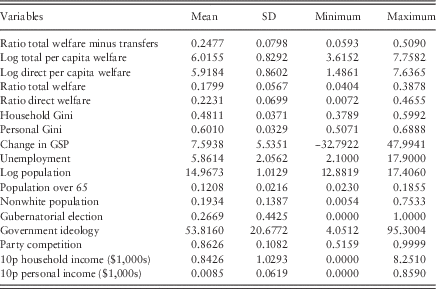
Note: Data consist of 50 states over 32 years, for 1,600 state-years.
GSP=gross state product; 10p=10th percentile.
Model
We analyse panel data of the 50 US states for 1976–2008. To address unit heterogeneity and control for any unobserved state-level factors, we incorporate fixed effects into the model. We fit a total of 22 model specifications. Of these, 20 emerge because we consider five measures of redistributive spending, two measures of the Gini coefficient for income inequality (one based on current-year household income and the other based on current-year personal income) and the choice of whether to use current or lagged values of each of the two Gini measures. For the final two specifications, we also consider a model that adds state debt as a predictor and another that allows for an overtime change in the effect. For now, we focus exclusively on modelling the ratio of redistributive spending to all state spending, net federal transfers. The interested reader is encouraged to review the other specifications in the Supplement.
We turn to Bayesian analysis to estimate our complete model for several reasons.Footnote 9 First, the 50 US states form a complete population, so methods that rely on repeated samples for inference are theoretically inappropriate. However, it is still important to capture and report uncertainty associated with any model. Bayesian inference, which has a probabilistic interpretation, serves as a natural way to characterise uncertainty in models of a complete population (Western and Jackman Reference Western and Jackman1994; Gill Reference Gill2001; Gill and Witko Reference Gill and Witko2013). In our case, a Bayesian model allows us to estimate the size of the relationship between inequality and redistributive spending and to create a credible interval that allows us to state the probability of a range of effect sizes in our observed population. A second reason to use Bayesian statistics is that complete populations of comparative data, such as those of the American states, have common data features such as multicollinearity and micronumerosity that can create more uncertainty in estimates. Bayesian methods allow the incorporation of additional information from priors, if and when necessary, to address data limitations (Western and Jackman Reference Western and Jackman1994, 415–416). Finally, in cases of models that are fragilely identified in conventional settings, such as geospatial regression models, Bayesian estimates tend to be more robust.Footnote 10
Given the functional specification we describe, Equation 1 fully specifies our Bayesian panel analysis model:
 $$y_{{it}} {\,\equals\,}{\bf{x}} \prime_{{it}} {\mib \bibeta } {\plus}\gamma _{i} {\plus}{\epsilon}_{{it}} $$
 $${\epsilon}_{{it}} \sim{\cal N}\left( {0,\sigma ^{2} } \right)$$
 $$\beta _{j} \sim{\rm flat}$$
 $$\gamma _{i} \sim{\rm flat}$$
 $$1/\sigma ^{2} \sim{\cal G}(0.001,0.001)$$
In this model, y it represents our outcome variable of redistributive spending, where i represents the state and t the year. x it is a vector of our 11 explanatory variables and a constant. β is a vector of 12 regression coefficients. γ i represents the fixed effect for each of the 50 states.Footnote 11 ϵ it is an independent and identically distributed disturbance term, given that the fixed effects have been accounted for. We therefore assume ϵ it distribution with a homoscedastic variance σ2. β j , for j∈{1, … ,12}, represents each of the 12 coefficients we estimate separately.
For each coefficient, we assume a flat prior, which means that our priors do not introduce any information beyond the data. Similarly, each fixed-effect term, γ i , has a flat prior. Finally, the inverse of the variance (i.e. the precision term 1/σ2) is assumed to have a vague Gamma prior. A Gamma prior is a conjugate prior for a precision, which helps with model convergence. With this specification, the precision is guaranteed to be positive, but will be driven primarily by the data.
Results
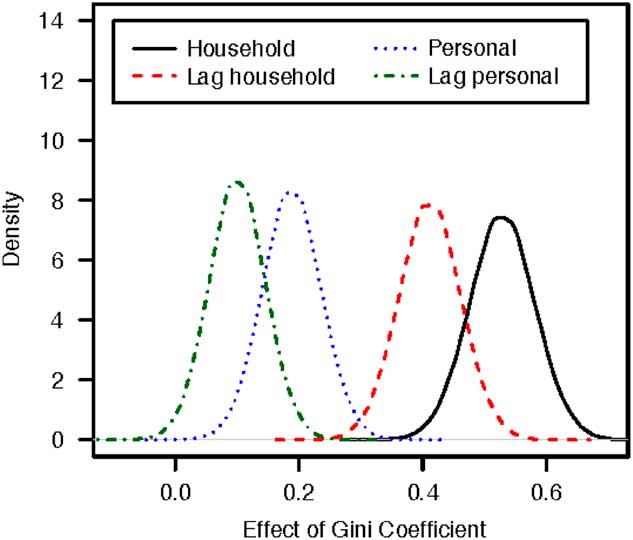
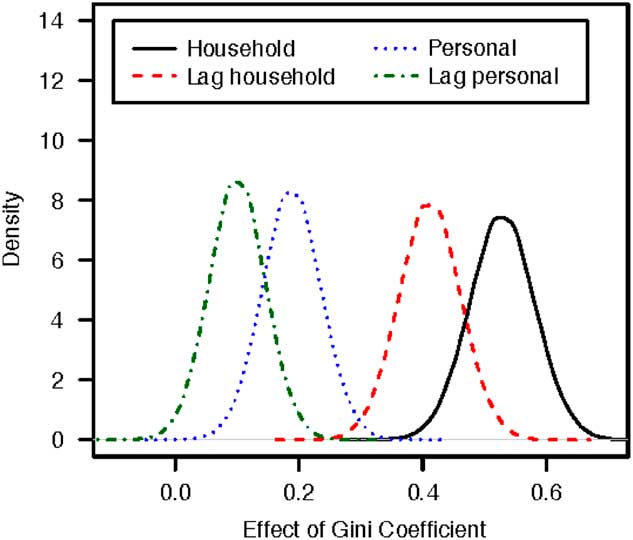
The main results that we discuss in this section focus on analysis using a dependent variable net federal funds. Figure 3 serves to illustrate the effect of inequality on redistributive spending. The horizontal axis represents the possible values of the partial effect for the Gini coefficient on the ratio of redistributive spending to all state spending, net federal transfers. The vertical axis represents the density of a possible coefficient. We estimated four models of this dependent variable, different only in how the Gini coefficient was measured. Hence, there are four lines on the graph, each representing the effect from a different version of the Gini coefficient. Every line represents the overall posterior probability density function of the coefficient from the respective specification. The solid line represents the effect when current values of the household income-based Gini coefficient are included. The dashed line represents the estimated effect of lagged household income inequality. The dotted line represents the effect when we use current values of the personal income-based Gini coefficient. Finally, the dot-dash line represents the effect of lagged personal income inequality. In fact, the probability of a positive effect exceeds 95% in all four cases.
Posterior density plots for the effect of the Gini coefficient on ratio of per capita total public welfare to per capita total expenditures, net federal transfers. Note: Each line within the panel represents one of four different measures of the Gini coefficient.
These strong results are of course in the context of a broader model that includes 10 other control variables described previously, plus state fixed effects. In addition, we include a measure of government ideology, as previous research indicates that inequality probably shapes redistribution by acting through ideology (Franko Reference Franko2016; Franko et al. Reference Franko, Kelly and Witko2016). In models excluding government ideology (not presented in the interest of space), the coefficient for the income inequality variable is larger. Inequality acting via government liberalism is consistent with the M-R model predictions as public opinion does not directly influence redistribution, but rather acts through decisions made by government officials. We observe that inequality is still significant, even after including government liberalism in the model, which indicates that there are additional pathways that translate inequality into more redistribution. It is possible that, in the US states, citizens can directly use the initiative process to shape state fiscal policy, and there is some evidence that growing concerns about inequality among citizens do lead to more redistributive initiatives (Franko et al. Reference Franko, Tolbert and Witko2013).
To interpret the meaning of our results, we focus specifically on the effect when we use current household income to measure the Gini coefficient (reported as the solid black line in Figure 3); the median of the posterior distribution is 0.5019. On its face, if the effect of inequality is at the median of this distribution, then that coefficient implies that if the Gini coefficient in a given state went from its theoretical minimum of 0 to its theoretical maximum of 1, then the percentage of that particular state’s spending dedicated to redistribution would rise by 50.2 percentage points, on average and ceteris paribus. As the Gini coefficient never touches its theoretical boundaries, though, such an enormous swing would never happen. A more natural interpretation would be to ask how much redistributive spending would change if the level of inequality rose by a standard deviation on this measure. To that end, if a given state’s Gini coefficient rose by a standard deviation, we would expect for a state’s spending on redistribution to rise by 1.9 percentage points of the budget, on average and with all else equal, which is a more realistic adjustment of the state’s finances.Footnote 12 As yet another comparison, moving from the 10th to 90th percentile in observed values of the Gini coefficient, we would see a 4.9 percentage point rise in the budget allocation to welfare spending on average and with all else equal.Footnote 13
As an alternative interpretation of the effect of inequality on redistributive spending, we can consider how many dollars will move in response to a rise in the Gini coefficient.Footnote 14 Supposing that a state went from the 10th to the 90th percentile in observed values of the Gini coefficient, that state would see a 75.6% rise in per capita spending on redistribution. If this were a state that spent an average amount of money on redistribution ($1210.76 per capita, in 2007), then it would see a $915.50 increase in per capita redistribution. That amounts to 2.4% of the wages of an average American or 115% of the pay of an American at the 10th percentile of income. This shows that there is a real monetary impact when states respond to inequality.
Conclusion
The M-R model predicts that inequality will lead to growing redistributive spending. Though the M-R model cannot explain variation in redistributive spending across all political contexts, we did find support for the idea that greater inequality is associated with greater redistributive spending in the US states from the mid-1970s to the late 2000s. This finding is robust to different measures of income inequality and different measures of redistributive spending. Though the short-term effects of increases in inequality on the percentage of spending devoted to redistribution may not appear extremely large, in real terms, these can translate to large sums of money overtime. This suggests that the state budgets are helping to “correct” inequalities in the US. At the same time, on the basis of our current findings we cannot say definitively whether these “corrections” achieve adequate levels of redistribution. Besharov and Call (Reference Besharov and Call2009) certainly think that, without investing in human capital, redistribution alone cannot fully solve the problem of income inequality, a theme that has empirical support in the study by Li (Reference Li2000). Although redistributive spending also appears to be sensitive to pretax versus posttax household and individual income-based inequalities, future studies need to further assess whether any preferred or optimal levels of income inequality are actually achieved after redistribution.
Why does the M-R model seem to apply to the relationship between inequality and spending in the US states whereas it has failed to find support in many crossnational studies, and even at the national-level in the US (Kenworthy and Pontusson Reference Kenworthy and Pontusson2005)? Further, do our results provide support for the mechanisms implied by the M-R model? The findings we report in this study appear to fit the M-R hypothesis in that growing inequality does lead to preferences for more redistribution, and that these demands for redistribution are then met by political leaders as envisioned by the M-R model. In other affluent democracies, where the institutional structure and political context makes it easier to change policies, preferences may at times lead to reduced redistributive spending in the face of rising inequality (Headey et al. Reference Headey, Goodin, Muffels and Dirven1997; Moene and Wallerstein Reference Moene and Wallerstein2003). Similar to such conclusions from other advanced democracies and the empirical findings in the literature that US states are not necessarily very passive in adopting redistributive policies (Rodgers Reference Rodgers2005; Rodgers et al. Reference Rodgers, Beamer and Payne2008), our findings linking pretransfer income inequality in the states to greater levels of redistributive spending should not be simply due to chance. Further, the findings from previous studies that included emerging and fragile democracies in their study sample, doubled with still emerging economic contexts, could explain conclusions that went against the M-R hypothesis.
It is possible, of course, to observe a correlation between inequality and redistribution even if other alternative mechanisms are at play. However, first, we control for the lack of growth in the incomes of those at the low end of the income distribution, which will automatically lead to more redistributive spending given the structure of US state welfare programmes. Thus, it is not simply slow growth of wages at the low end of the income distribution or growing poverty that is driving this result. Second, we do find that including government ideology in the model reduces the size of the coefficient for the Gini. This is consistent with research showing that as inequality grows the public demands liberal policy solutions by electing liberal governments or otherwise pushing governments to the left (Franko Reference Franko2016; Franko et al. Reference Franko, Kelly and Witko2016). However, research also shows that the public does not consistently prefer more redistribution as inequality grows in the US states (Franko Reference Franko2016). This means that liberal governments may pursue this solution regardless of public opinion, though more research should consider this in the future.Footnote 15 But we also see that even after controlling for government ideology there is still a significant direct effect of inequality on redistribution, suggesting that inequality also affects redistribution through other political and administrative channels. Moreover, recall that the main results discussed in the article involve outcomes, net federal spending; therefore, this is not simply a function of federal policy decisions. Thus, our results provide robust evidence that the M-R model is likely at work in the US states. Though state welfare spending is not the entirety of the US welfare state, because the large programmes for the elderly are not funded by the states, inequality is nevertheless associated with a considerable expansion of welfare spending at the state level.
Admittedly, our findings are somewhat surprising given research at the national-level, which does not find support for the M-R model (Kenworthy and Pontusson Reference Kenworthy and Pontusson2005; Kelly and Enns Reference Kelly and Enns2010); however, the US government has largely been controlled by conservative policies over the last few decades and according to some research is largely unresponsive to public opinion (Gilens Reference Gilens2012). In contrast, there is much greater variation in the ideology and responsiveness of governments in the US states, in addition to the presence of institutions of the citizen ballot initiative, which make it possible to translate opinion into policy. This variation in the power and access of different social interests is one of the main benefits of federalism. For instance, in recent years decisions by state governments about whether to implement TANF in a more or less punitive manner have resulted in very different outcomes. In addition, states like California have enacted social insurance programmes (e.g. parental leave and now pension programmes) that have redistributive aspects. Thus, states have a variety of tools to expand redistribution both in partnership with the federal government and on their own, and our research shows that states are using their fiscal policy authority to increase redistribution in the face of growing inequality.
Future research should certainly more directly consider how the tax burden in the states shifts in response to growing income inequality, which is the other side of the “redistributive” coin. Indeed, though most tests of the M-R model focus on the expenditure side, the M-R model was primarily about taxation. Certainly, tax policy and tax expenditures are also used for income redistribution. Redistribution likely exists because most purely redistributive forms of spending in the states increased as inequality grew. That is, to qualify for TANF and similar programmes one must be so poor that they cannot possibly contribute more to the funding of this programme than they receive in benefits. However, for other programmes, the total redistributive effects are not entirely clear as some states have relatively more or less regressive tax systems. Thus, it needs to be directly examined whether states shift the tax burden more towards or from the wealthy as inequality grows (Meltzer and Richard Reference Meltzer and Richard1981, Reference Meltzer and Richard1983). Evidence from Rodgers and Tedin (Reference Rodgers and Tedin2006) shows that state tax efforts react to welfare spending demands, though such reactions seem to vary state by state. Further, Beamer (Reference Beamer2005) evaluates ways in which state policymakers may use their tax mechanisms to maximise funding from the federal government. Similarly, the role that the tax code plays as an income smoother in its social insurance function must be further evaluated. Indeed, several articles on life-cycle tax policy are directly relevant to this point (Erosa and Gervais Reference Erosa and Gervais2002; Diamond and Saez Reference Diamond and Saez2011; Kindermann and Krueger Reference Kindermann and Krueger2017). Therefore, until the share of intended tax burden shifts versus built-in automatic tax burden increases is exhaustively established, our finding in favour of the M-R hypothesis must be interpreted with caution. Regardless of the specific answers to these questions, it is clear that inequality has a very important role in US fiscal policy (at federal, state or local levels of government), one which public policy scholars must seek to better understand.
Acknowledgements
The authors would like to thank panel participants at the Public Management Research Conference in June 2015 (Minneapolis, MN), Journal of Public Policy editors and four anonymous reviewers for their constructive feedback.
Supplementary material
To view supplementary material for this article, please visit https://doi.org/10.1017/S0143814X17000125