With approximately 157,500 patients diagnosed with surgical site infections (SSIs) every year in the United States alone, these infections constitute a large proportion of healthcare-associated infections and present a serious clinical threat to patients.Reference Magill, Edwards and Bamberg 1 Furthermore, SSIs have been shown to prolong length of stay and incur additional costs,Reference Fukuda, Morikane and Kuroki 2 , Reference Fukuda, Lee and Imanaka 3 thereby also presenting a financial threat to healthcare institutions and insurers.
Because rigorous measurements are needed to generate improvements in any situation, infection control measures must first include the accurate determination of SSI incidence at the hospital level. It has been reported that the feedback of SSI surveillance results to hospitals can reduce infection incidence.Reference Brandt, Hansen, Sohr, Daschner, Rüden and Gastmeier 4 – Reference Rioux, Grandbastien and Astagneau 6 In the United States, the Centers for Disease Control and Prevention previously utilized the National Nosocomial Infections Surveillance System (NNIS) risk index to determine SSI incidence.Reference Culver, Horan and Gaynes 7 The NNIS risk index was calculated on the basis of surgical wound class, operative time, American Society of Anesthesiologists (ASA) score, and endoscope use, and it has been applied in various countries such as Germany,Reference Brandt, Hansen, Sohr, Daschner, Rüden and Gastmeier 4 , Reference Brandt, Sohr, Behnke, Daschner, Rüden and Gastmeier 8 Australia,Reference Friedman, Bull, Russo, Gurrin and Richards 9 , Reference Worth, Bull, Spelman, Brett and Richards 10 Holland,Reference Geubbels, Nagelkerke, Mintjes-De Groot, Vandenbroucke-Grauls, Grobbee and De Boer 5 , Reference Geubbels, Mintjes-de Groot, van den Berg and de Boer 11 , Reference Geubbels, Grobbee, Vandenbroucke-Grauls, Wille and de Boer 12 France,Reference Rioux, Grandbastien and Astagneau 6 Spain,Reference Díaz-Agero Pérez, Robustillo Rodela, Pita López, López Fresneña and Monge Jodrá 13 and Japan.Reference Morikane, Honda, Yamagishi, Suzuki and Aminaka 14 , Reference Fukuda, Morikane and Kuroki 15 Despite its use in these countries, the NNIS risk index is associated with the following issues: (1) the use of only 4 risk factors may be inadequate for the calculation of the risk index,Reference Geubbels, Mintjes-de Groot, van den Berg and de Boer 11 , Reference Geubbels, Grobbee, Vandenbroucke-Grauls, Wille and de Boer 12 , Reference Morikane, Honda, Yamagishi, Suzuki and Aminaka 14 , Reference Chen, Anderson, Kaye and Sexton 16 (2) the calculation of each risk factor as a dichotomous variable may not be optimal, (3) the different surgery types may warrant different weights,Reference Friedman, Bull, Russo, Gurrin and Richards 9 , Reference Geubbels, Mintjes-de Groot, van den Berg and de Boer 11 , Reference Roy, Herwaldt, Embrey, Kuhns, Wenzel and Perl 17 and (4) the assignment of the same weight (1 point) to each risk factor may be unjustified.Reference Friedman, Bull, Russo, Gurrin and Richards 9 , Reference Geubbels, Mintjes-de Groot, van den Berg and de Boer 11
In 2009, the US National Healthcare Safety Network (NHSN) introduced statistical modeling to replace the NNIS risk index to estimate expected infection incidence, which was then used as the denominator in a new measure for investigating infections.Reference Mu, Edwards, Horan, Berrios-Torres and Fridkin 18 This measure may be designated the statistical modeling–based standardized infection ratio (SIR). The use of the statistical modeling–based SIR resolved the problems associated with the conventional risk index–based SIR in the United States and substantially improved intra-institutional time series comparisons and interinstitutional comparisons.Reference Gustafson 19
The objective of this research was to develop an internally validated SSI prediction model for Japan based in part on the NHSN methods using data from the Japan Nosocomial Infections Surveillance (JANIS) system. We also investigated whether this Japan-specific prediction model has higher accuracy than a model that uses the conventional NNIS risk index.
METHODS
JANIS Data
SSI surveillance data were obtained from the JANIS database, which is compiled from a national surveillance program administered by the Ministry of Health, Labour and Welfare of Japan. The surveillance methods used by JANIS have been described in detail elsewhere.Reference Morikane, Honda, Yamagishi, Suzuki and Aminaka 14 , Reference Fukuda, Morikane and Kuroki 15 In principle, JANIS annually recruits hospitals with 200 or more beds to voluntarily participate in the program. Infection control teams in the participant hospitals prospectively gather infection surveillance data on patients who have undergone target surgical procedures preselected by the hospitals. SSIs are identified according to the definitions and methods used by the NNIS.Reference Horan and Gaynes 20 Surveillance data are submitted by participant hospitals to JANIS twice every year.
Study Design
We collected all JANIS data from 394,080 cases from 428 participant hospitals from January 1, 2010, through December 31, 2012. Because the surgical procedure codes used by JANIS were revised in 2012, we used the procedure codes for the 45 procedures established in 2012. Patients reported as being aged 119 years or older (n=6) were considered likely to be input errors and, as such, were excluded from analysis. For the same reason, we also excluded patients whose operative times were (1) 5 minutes or less, or (2) longer than 5 times that of the interquartile range (n=1,399).
The overall study procedure was as follows: first, we developed an SSI predictive model using only the NNIS risk index for each of the 45 JANIS procedures; this model was designated the Risk Index Model, or RIM. Next, we developed a predictive model for SSI incidence in each of the procedure categories using a statistical approach that initially incorporated all the collected surveillance data; this model was designated the Statistical Model, or SM. Finally, we compared the SSI predictive abilities of both the RIM and SM for each procedure category.
Stata, version 13.1 (StataCorp), was used for all statistical analyses. Statistical significance was set at P<.05.
Risk Index Model
The RIM was a logistic regression model with SSI occurrence as the dependent variable. The 4 factors (surgical wound class, operative time, ASA score, and endoscope use) of the NNIS risk index were included as covariates, and the model was applied to each procedure category. The covariates were categorized in accordance with the methods used by the NNIS risk index, in which a score of 1 was given to each of the following: “contaminated” or “dirty” surgical wound classes, operative times that exceeded the 75th percentile, ASA scores of 3 to 6, and laparotomy surgeries; the remaining values for each variable were given a score of 0. Mutual interactions between the covariates were not analyzed.
Statistical Model
The SM used in our study is distinct from the NNIS-based RIM in the following aspects: (1) it includes all 5 additional factors (patient age, sex, emergency surgery, implant use, and colostomy) that could be acquired from JANIS, (2) the categorization of each risk factor was determined for each procedure category on the basis of the results of univariate analysis (the statistical methods are described in detail in the Online Appendix), and (3) the covariates that were included in the model for each procedure category were different.
Forward selection logistic regression was used to develop the parsimonious final model. We used the C-index to assess the discrimination ability of the statistical model to predict SSI. Model calibration was assessed using the Hosmer-Lemeshow test, which indicates how accurately the model’s predictions match overall observed event rates. The final model was internally validated using 200 bootstrap cycles in Efron’s enhanced bootstrap method.Reference Harrell, Lee and Mark 21 – Reference Harrell 23 An advantage of this type of bootstrap validation over alternative validation approaches (eg, splitting of data into training and test data sets) is that it can increase statistical efficiency and allow direct validation of the final model.Reference Harrell, Lee and Mark 21 In the data-splitting method, the values of model evaluation indices (such as for evaluating discrimination ability) change according to how the data sets are split. In contrast, the use of Efron’s enhanced bootstrap method allows analysts to avoid this issue. An SSI prediction model was constructed for each of the procedure categories.
Comparisons of the RIM and the SM
We calculated and compared the C-indices for the RIM and SM for each procedure category using the Delong method.Reference DeLong, DeLong and Clarke-Pearson 24 The C-index refers to the area under the receiver operating characteristic curve, and it demonstrates the ability of the model to distinguish between truly infected patients and truly noninfected patients. The value of this measure ranges from 0.5 to 1.0, with higher values indicating better discriminative ability; a value of 0.5 indicates a complete inability for an analytical model to distinguish between infected and noninfected patients, whereas a value of 1.0 indicates a perfect ability to distinguish between these patients.
RESULTS
Patient Characteristics
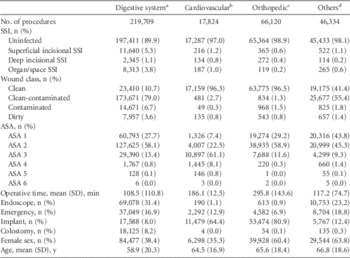
The study sample comprised 349,987 patients whose data were obtained from January 1, 2010, through December 31, 2012; among these patients, 24,492 were reported as having infections. The overall infection incidence was 7.0%, and it ranged from 0.0% (carotid endarterectomy, kidney transplant, refusion of spine, and varix surgery) to 19.0% (esophagus surgery) among the procedures. Table 1 presents the patient characteristics according to the main procedure categories. Over the 3-year study period, there were 219,709 digestive system surgeries conducted in the participant hospitals, and the corresponding infection incidences of superficial SSI, deep SSI, and organ/space SSI were 5.3%, 1.1%, and 3.8%, respectively. The overall SSI incidences for cardiovascular and orthopedic surgeries were 3.1% and 1.1%, respectively.
Patient Characteristics by Type of Procedure (JANIS Data From 2010 to 2012)

NOTE. Acronym definitions for procedures are provided in Table 2. ASA, American Society of Anesthesiologists; JANIS, Japan Nosocomial Infections Surveillance; SSI, surgical site infection.
a Digestive system surgeries include the following procedures: APPY, BILI, CHOL, COLO, ESOP, GAST, HER, LTP, REC, SB, and SPLE.
b Cardiovascular surgeries include the following procedures: AAA, AAE, AVSD, CARD, CBGB, CBGC, CEA, HTP, PACE, PVBY, TAA, TAE, and VARX.
c Orthopedic surgeries include the following procedures: AMP, FUSN, FX, HPRO, KPRO, LAM, and RFUSN.
d Other surgeries include the following procedures: BRST, CRAN, CSEC, HYST, KTP, NECK, NEPH, OVRY, PRST, THOR, THYR, VHYS, VSHN, and XLAP.
With regard to surgical wound class, 79.0% of the digestive system surgery patients were classified as having undergone clean-contaminated surgeries, whereas 97% to 99% of the cardiovascular and orthopedic surgeries were classified as clean surgeries. ASA 2 was the most common score in digestive system surgeries (58.1%) and orthopedic surgeries (58.9%), whereas ASA 3 was the most common score in cardiovascular surgeries (61.1%). Although it became required to report colostomy (colon surgery, small-bowel surgery, and rectal surgery) only from 2012 onward, all types of procedures could be reported prior to this revision. Therefore, there may be a very small number of colostomy cases reported in the cardiovascular, orthopedic, and other types of procedures (Table 1) from 2010 to 2011.
Statistical Models for Predicting SSI
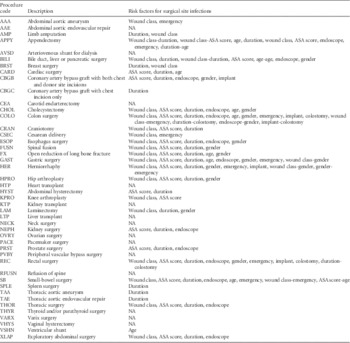
The risk factors for each of the 45 procedure categories in the SMs are summarized in Table 2. The final SM was calculated for 31 procedure categories; 14 procedures were excluded owing to having too few cases to provide sufficient statistical strength. The level of contribution of each factor on SSI prediction varied widely among the factors and procedures. The factor that was most commonly included in the SM was operative time (87.1%), followed by surgical wound class (67.7%), ASA score (67.7%), and endoscope use (41.9%). In addition to the NNIS risk index factors, the results also showed that sex (38.7%), age (29.0%), and emergency surgery (25.8%) were required in approximately 20% to 30% of the procedure categories. Interaction variables were also included in the SMs for 7 procedure categories (22.6%).
List of Factors in Statistical Models for Predicting Surgical Site Infections in Each Procedure Category (JANIS Data From 2010 to 2012)

NOTE. The final statistical model was not calculated for procedures with “not applicable” (NA) in the risk factors column owing to insufficient sample sizes. ASA, American Society of Anesthesiologists; JANIS, Japan Nosocomial Infections Surveillance.
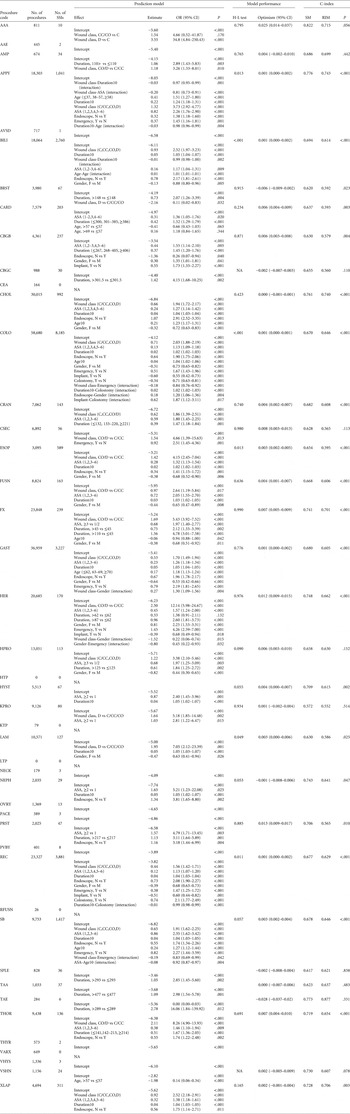
Table 3 shows the results of SSI prediction model development for the 45 procedure categories. After 200 cycles of bootstrapping, the average optimism in each SM was lower than 0.025, suggesting a minimal level of overfitting. The Hosmer-Lemeshow test indicated satisfactory model calibration in most procedure categories (76.9%).
Statistical Models for Predicting SSIs (JANIS Data From 2010 to 2012)

NOTE. Age10, 10-year increase in age at procedure; ASA, American Society of Anesthesiologists score; C, clean; CC, clean-contaminated; CO, contaminated; D, dirty; Duration10, 10-minute increase in procedure duration; H-L test, Hosmer-Lemeshow test; OR, odds ratio; RIM, National Nosocomial Infections Surveillance System risk index model; SM, statistical model; SSI, surgical site infection.
Factors other than those of the NNIS risk index (surgical wound class, operative time, ASA score, and endoscope use) were included as covariates in 17 (54.8%) of the 31 final procedure categories.
The categorization methods of surgical wound class, ASA scores, and operative time varied among the procedure categories but were generally different from the categorization methods used in the NNIS risk index. Operative time was most commonly used as a continuous variable, instead of a categorical variable with a cutoff at the 75th percentile (as used in the NNIS risk index).
Comparisons of the Risk Index Model and the Statistical Model
The results of the comparison between the C-indices of the RIM and the SM are shown in Table 3. The C-index of the SM was significantly higher than that of the RIM in 21 (67.7%) of the 31 procedure categories (P<.05). The SMs in 6 of the remaining 10 categories had nonsignificantly higher C-indices than the RIMs. In the remaining 4 categories (limb amputation, spleen surgery, thoracic aortic aneurysm, and thoracic aortic endovascular repair), the C-index of the RIM was marginally higher than that of the SM, but this was not statistically significant.
DISCUSSION
In this study, we utilized infection surveillance data from the national-level JANIS database to develop and validate an SSI prediction model for Japan. The statistical modeling–based SIR can be calculated and used as a retrospective benchmark for quality improvement, with applications in comparing SSI-related performance among different time series cases and institutions.
Operative time was included as a covariate in most procedure categories, which was similar to the findings of the NHSN.Reference Mu, Edwards, Horan, Berrios-Torres and Fridkin 18 Although operative time was used in 77.2% of procedure categories in the United States, our study showed that this factor was required in 87.1% of procedure categories in Japan, indicating that it may be the most influential factor in SSI occurrence. Operative time was followed by surgical wound class (used in 67.7% of procedure categories), ASA score (67.7%), and endoscope use (41.9%), which are all NNIS risk index factors. These findings indicate that the NNIS risk index is able to cover the major risk factors for SSIs in Japan. However, 17 (54.8%) of the 31 procedure categories used in the final SM included other risk factors distinct from those of the NNIS risk index. This supports the conclusions of previous studies that have reported that the NNIS risk index factors alone are inadequate for SSI prediction models.Reference Geubbels, Mintjes-de Groot, van den Berg and de Boer 11 , Reference Geubbels, Grobbee, Vandenbroucke-Grauls, Wille and de Boer 12 , Reference Morikane, Honda, Yamagishi, Suzuki and Aminaka 14 , Reference Chen, Anderson, Kaye and Sexton 16
To verify the utility of the SM, we compared it with the RIM for each procedure. The results showed that in the majority (67.7%) of the procedure categories, the SM had a significantly higher C-index than the corresponding RIM. This suggests the superiority of the SM over the RIM for calculating SIRs in Japan. However, not all of the procedure categories had sufficiently high C-indices for their SMs: only 1 procedure category (abdominal aortic aneurysm) had a C-index that exceeded 0.8; in addition, 11 procedure categories (35.5%) had C-indices that ranged from 0.7 to 0.79, 18 procedure categories (58.1%) had C-indices that ranged from 0.6 to 0.69, and 1 procedure category (knee arthroplasty) had a C-index that was lower than 0.6. The lower predictive ability of the SMs in some procedure categories may be attributed to insufficient patient factors collected by the JANIS system. In a study of coronary artery bypass graft surgeries, Chen et alReference Chen, Anderson, Kaye and Sexton 16 reported that the addition of diabetes and body mass index as patient factors to the RIM increased the C-index from 0.57 to 0.62. Geubbels et alReference Geubbels, Grobbee, Vandenbroucke-Grauls, Wille and de Boer 12 noted that the inclusion of patient factors such as preoperative hospital stay duration, indication for surgery, and diabetes to their model produced statistically significant improvements to its C-index in several procedure categories. Those findings underline the necessity for increasing the number of patient factors for surveillance to improve the utility of the SIR as an SSI benchmark measure.
Although the NHSN had developed an SSI prediction model with high internal validity,Reference Mu, Edwards, Horan, Berrios-Torres and Fridkin 18 there was a need for the development of a Japan-specific model due to several inherent differences in healthcare systems and infection surveillance systems between the 2 countries. First, there is a substantial gap in length of stay for acute care hospitalizations between Japan and the United States. The average length of stay for general hospitalizations in Japan is 17.5 days, which is much longer than that of the United States. Due to these longer hospitalizations, JANIS may have a relatively higher chance of detecting SSIs that occur during hospitalization compared with the NHSN. In addition, postdischarge outpatient visits are usually conducted at the hospital where surgery was performed, which also facilitates the detection of SSIs in surgical outpatients. Although our estimated SSI incidences appeared to be higher than the incidences detected by the NHSN,Reference Mu, Edwards, Horan, Berrios-Torres and Fridkin 18 this may be explained in part by the differences in healthcare provision systems. Second, although JANIS was initially developed on the basis of the NNIS risk index (the precursor to the NHSN), there are differences in the surveillance variables collected by the current JANIS and NHSN systems. The NHSN system includes information on surgical techniques for a portion of procedures, and it also began to collect data on diabetes and body mass index for all patients undergoing surgical procedures from 2013 onward. In addition, the NHSN SSI prediction model includes hospital bed numbers and medical school affiliation as hospital factors.Reference Mu, Edwards, Horan, Berrios-Torres and Fridkin 18 The JANIS system, however, is unable to readily emulate the NHSN model and collect information on these factors. This is because the JANIS system is administered as part of the Japanese government’s official statistics collection program and, as such, involves official surveys that are conducted in accordance with the Statistics Act. Any revisions to the survey items are subject to legislation and are therefore difficult to implement.
This study has several limitations. First, the study sample comprised 428 hospitals with 200 or more beds that voluntarily participated in the JANIS system. As there were 2,657 hospitals throughout Japan with 200 or more beds in 2012, the hospitals used in this study accounted for only 16.1% of these hospitals. In addition, there were approximately 6,000 more hospitals in Japan with fewer than 200 beds, and these hospitals were not represented in our sample. This may therefore limit the external generalizability of our SSI prediction model. Second, while the definitive identification of SSI is, in principle, conducted by infection control teams in each JANIS participant hospital, it is possible that these infections were actually independently identified by the operating surgeon or an infection control doctor. Future studies should verify the SSI identification process used in these hospitals, and it may be necessary for JANIS to conduct external audits to ensure the standardization of this process. Third, the inclusion of superficial SSIs in our prediction model may give rise to ascertainment bias due to interhospital differences in infection detection methods. Although the implementation of postdischarge surveillance may help to mitigate this problem, surveillance methodology is not currently standardized among JANIS hospitals. However, the comparatively long length of stay in Japanese hospitals may allow for more chances to detect these infections and reduce the risk of ascertainment bias. Fourth, model calibration was not optimal for the major digestive system surgeries, as indicated when the Hosmer-Lemeshow test produced significant results in these procedures. However, this test can be sensitive to sample size and in larger samples may report even minor deviations from the proposed model as significant. The large sample sizes in the digestive system surgeries may therefore have resulted in the apparent lack of fit. Fifth, the analysis may include procedures that did not have an adequate sample size for the statistical model. In principle, logistic regression analyses are conducted with at least 10 outcome events per predictor variable.Reference Pavlou, Ambler and Seaman 25 However, the models for abdominal aortic aneurysm, kidney surgery, and thoracic aortic endovascular repair had a larger number of predictors relative to the number of outcome events.
SSIs present both clinical and financial threats to clinical practice, and infection control specialists are committed to reducing infections. The governmental agencies that support these infection control activities should ensure the provision of resources with the maximum possible contributions to clinical practice. Thus far, JANIS has provided feedback on infection incidences for different risk levels to the participant hospitals. However, the statistical modeling–based SIR developed in this study may represent a new tool with higher potential utility. The results of this study may assist infection control specialists as they endeavor to reduce healthcare-associated infections.
ACKNOWLEDGMENTS
Financial support. The Japan Society for the Promotion of Science KAKENHI Grant Number 25713029 (Grant-in-Aid for Young Scientists A).
Potential conflicts of interest. Both authors report no conflicts of interest relevant to this article.
SUPPLEMENTARY MATERIAL
To view supplementary material for this article, please visit http://dx.doi.org/10.1017/ice.2015.302