

INTRODUCTION
Microglia are the resident immune cells of the brain. Myeloid in developmental origin microglia exist in a resting or ‘ramified’ state in the healthy central nervous system (CNS). During injuries or other CNS disturbances, resting microglia respond to signals from the site of the injury and become ‘activated’. The response of activated microglia to CNS injuries typically consists of proliferation, migration to the injury site, secretion of immune mediators, and scavenging and phagocytosing of toxic substances and cellular debris (Raivich, Reference Raivich2005; Streit et al., Reference Streit, Conde, Fendrick, Flanary and Mariani2005). Microglial activation is multifaceted because activated microglia are capable of producing both toxic and trophic effectors; studies have shown that whether activated microglia promote neurotoxicity or neuroprotection is dependant on the specific activating signal (Nakajima and Kohsaka, Reference Nakajima and Kohsaka2004; Hanisch and Kettenmann, Reference Hanisch and Kettenmann2007). Although the literature on microglial activation continues to grow, a potential contributing factor that has been overlooked by most are the intrinsic differences among microglial populations. The idea that the same stimulus may yield opposite activation phenotypes due to population differences has not been demonstrated in microglia per se. Nonetheless, in other brain cell types such as neurons, this is a well-known phenomenon. For example, different neuronal populations in the brain express varying levels of glutamate (GLU) receptors, rendering some populations sensitive to GLU-induced neuronal death and others insensitive in response to the same GLU concentration (Weiss and Choi, Reference Weiss and Choi1991). In comparison to neurons, there is less evidence supporting the existence of different microglial populations throughout the brain. A large portion of our current knowledge regarding microglia is derived from in vitro studies on primary microglial cultures. The cultures are conventionally prepared from whole brains because it is assumed that microglia are more or less a homogeneous population. However, taking into account the diversity of the neurochemical milieu across the CNS, coupled with the high sensitivity of microglia to changes in surrounding activities, one would expect that throughout the course of development, the microglial phenotype in a given region of the brain would be tailored into a specialized phenotype for that particular region. Indeed, several groups have reported that in the normal CNS, resident microglia in different brain regions do express different levels of immunological markers (Lawson et al., Reference Lawson, Perry, Dri and Gordon1990; Elkabes et al., Reference Elkabes, DiCicco-Bloom and Black1996; Wu et al., Reference Wu, Chien, Chang and Ling1997; Schmid et al., Reference Schmid, Sautkulis, Danielson, Cooper, Hasel and Hilbush2002; Carson et al., Reference Carson, Bilousova, Puntambekar, Melchior, Doose and Ethell2007; de Haas et al., Reference de Haas, Boddeke and Biber2008). Interestingly, the regionality of microglial markers was also observed after microglia had been isolated in the culture (Ren et al., Reference Ren, Lubrich, Biber and Gebicke-Haerter1999), suggesting that the population differences among microglia are robust enough to withstand changes in the surrounding milieu due to culturing. Although this evidence supports the existence of heterogeneous microglial populations, in the disturbed CNS, where microglia are activated, it is still unclear whether the phenotypic differences still persist, and if they do, whether they are functionally significant. The aim of this study was to determine whether microglia from different brain regions have diverse responses to activating agents, and if so, whether these diverse responses affect the survival of injured neurons differently.
OBJECTIVE
We hypothesize that the activation phenotypes of microglia depend on the specific neurochemical milieus they were nurtured in. Primary microglial cultures were isolated from five different brain regions: brainstem (Brs), cortex (Ctx), hippocampus (Hip), striatum (Str) and thalamus (Thl). These microglia were stimulated with microglial activators, namely adenosine 5′-triphosphate (ATP), GLU and lipopolysaccharide (LPS). The activation phenotypes of these microglia and the effectors they release were examined. The overall neurotrophic and neurotoxic effects exerted by the activated microglia were also measured by co-culturing them with hypoxia (Hyp)-injured neurons.
METHODS
Primary neuronal and microglial cultures
Neuronal cultures were prepared from cortices of embryonic day 18 Sprague–Dawley rats using methods derived from previous studies (Brewer et al., Reference Brewer, Torricelli, Evege and Price1993; Swayze et al., Reference Swayze, Lise, Levinson, Phillips and El-Husseini2004). All animal handling was conducted in accordance with the University of Alberta animal ethics guidelines. In brief, dissected cortices were dissociated by 0.25% trypsin–ethylenediaminetetraacetic acid (trypsin–EDTA, Gibco) digestion and mechanical titrations. Dissociated neurons were resuspended in B-27 supplemented Neurobasal Media (Gibco) and plated at a density of 2 × 10⁵ cells per well on poly-l-lysine (Sigma) pre-coated 24-well plates. Contaminating glial cells were minimized by treatment with 1 µM cytosine arabinoside (Sigma) from days in vitro (DIV) 3 to DIV 6. This yielded neuronal-enriched cultures that were verified to be >98% neurons by the neuronal marker microtubule-associated protein-2 (MAP-2). Experiments were performed on cultures that were 10–13 DIV.
Microglial cultures were first isolated as mixed cultures, which were prepared from brains of postnatal day 1 Sprague–Dawley rats. For each brain, Brs, Ctx, Hip, Str and Thl were carefully separated. The dissected regions were dissociated by enzymatic digestion with 0.25% trypsin–EDTA and mechanical titurations. Dissociated cells were resuspended in Dulbecco's modified Eagle medium (DMEM)/F12 supplemented with 10% fetal bovine serum (Hyclone), then plated on poly-l-lysine-coated 6-well or 24-well plates at a density of 4 × 10⁶ cells and 1 × 10⁶ per well, respectively. After 18–22 DIV, microglial cells were isolated from these mixed cultures using a previously reported high-yield method (Saura et al., Reference Saura, Tusell and Serratosa2003), which uses a 1:1 mixture of 0.25% trypsin–EDTA:DMEM to dissociate non-microglial cells from the surface. The remaining adherent cells were verified to be >95% microglia by the microglia/macrophage-specific marker ionized calcium-binding adaptor protein 1 (Iba1) and were kept in serum-free DMEM for an additional 1–2 DIV before experiments were performed.
Chemicals
Unless otherwise mentioned, all chemicals were purchased from Sigma. Concentrations used for aminoguanidine (AG, 300 µM), ATP (0.01–1 mM), GLU (30 µM) and LPS (1 µg ml−1) were based on previous in vitro studies (Lockhart et al., Reference Lockhart, Cressey and Lepagnol1998; Tanaka et al., Reference Tanaka, Kato and Koike2000; Nakajima et al., Reference Nakajima, Honda, Tohyama, Imai, Kohsaka and Kurihara2001; Inoue, Reference Inoue2002). The concentration used for the anti-tumor necrosis factor-α (TNF-α) antibody (R&D, 0.1 µg ml−1) was derived from comparing the measured TNF-α concentrations in the culture media with the neutralization curve provided by the manufacturer. The concentration used for taurine (TAU) (20 µM) was derived from the TAU concentrations measured from the media of the mixed cultures.
Immunocytochemistry and morphological analysis
Anti-MAP-2 (1:500) and anti-Iba1 (1:1000) were purchased from Sigma and Wako, respectively. Fluorescence-conjugated secondary antibodies (1:500) were obtained from Jackson ImmunoResearch. Immunocytochemistry was performed using methods described in Lai and Todd (Reference Lai and Todd2008). Cultures were first fixed in 2% paraformaldehyde for 10 min. After 1 h blocking and permeabilization with 10% horse serum and 0.25% Triton, they were labeled with primary antibodies for 1 h, then with the appropriate fluorescence-conjugated secondary antibodies for 30 min.
Morphological analysis using the ImageJ (NIH) program was performed on Iba-1-labeled microglia under the 20× objective. For each well, four to five fields were analyzed. The fields analyzed were selected blindly, and in each field eight cells that were closest to the center of the field were included in the analysis.
In vitro Hyp and measurement of neurotoxicity
Hypoxic injury was achieved by incubating neuronal cultures in <1% oxygen for 2 h in an oxygen-sensitive chamber (PROOX model 110, BioSpherix). Following Hyp, the neuronal cultures were plated with ATP-treated microglia that were detached from the enriched microglial cultures. The neuron–microglia co-cultures were then re-oxygenated under normoxic conditions for 24 h before assaying for survival. For the measurement of neurotoxicity in mixed cultures of neurons and microglia, the neuron-specific marker MAP-2 was used to distinguish neurons from microglia. MAP-2 labeling was probed with a fluorescence-conjugated secondary antibody. The level of fluorescence in each well was then measured by a plate reader (Gemini EM, Molecular Devices) using the well scan protocol, excitation at 492 nm and emission at 510 nm.
Nitric oxide (NO) assay
NO in the media was assessed indirectly via its stable metabolite nitrite. The collected media were transferred to a 96-well plate. Half volumes of 1% sulfanilamide (in 3 M HCl) were then added to the wells, followed by the same volumes of 0.02% N-naphthylethylenediamine. The final mixture was read on a plate reader at 540 nm.
Enzyme-linked immunosorbent assay (ELISA)
An ELISA kit for TNF-α was obtained commercially from R&D Systems. The ELISA procedures were carried out according to manufacturer protocols. For brain-derived neurotrophic factor (BDNF) ELISA, an indirect ELISA protocol was used. In brief, media and recombinant BDNF standards (R&D) diluted in phosphate-buffered saline (PBS) were incubated with 96-well plates in the cold room overnight. The plates were then blocked with the ELISA diluent (1% bovine serum albumin in PBS) for 1 h. After blocking, the plates were incubated with rabbit anti-BDNF (1:500, Santa Cruz, in ELISA diluent) for 1 h followed by horseradish peroxidase (HRP)-conjugated IgG (1:2000, Santa Cruz, in ELISA diluent) for 30 min. The chromagen tetramethylbenzidine (Sigma, 0.027% in 0.82% sodium acetate, 0.36% citric acid and 40% methanol) was added to develop color. Upon development of the chromagen, 1.8 N sulfuric acid was added to stop the reaction, and the plates were read on a plate reader at 450 nm. All procedures were carried out at room temperature unless otherwise specified.
GLU uptake assay
The amount of GLU taken up by the cultured cells was measured using the method described in Persson et al. (Reference Persson, Brantefjord, Hansson and Ronnback2005). Specifically, the cultures were incubated with 100 µM GLU containing 3H-l-GLU (1 µCi ml−1, Amersham) for 30 min, washed three times with cold PBS, then lysed with 1% Triton (in PBS). The lysates were then aliquoted, one was used for protein concentration assays and the other for measurements of radioactivity by liquid scintillation counting. Protein concentrations were measured using the bicinchoninic acid kit (Sigma) according to the manufacturer protocol. The aliquots for radioactivity measurements were transferred to vials containing 5 ml of aqueous scintillation mixture (Beckman-Coulter), and then counted using a Beckman LS 6000 liquid scintillation counter.
Immunoblotting
The cultured cells were lysed in cold TEEN buffer (50 mM Tris, 1 mM EDTA, 1 mM ethylene glycol tetraacetic acid (EGTA) and 150 mM NaCl) containing 0.8% Triton, 0.2% sodium dodecyl sulfate (SDS) and 1 mM phenylmethanesulfonylfluoride. The lysates were boiled in sample loading buffer (62.5 mM Tris, 7.5% glycerol, 2% SDS, 15 nM bromophenol blue and 1% β-mercaptoethanol), then subjected to SDS–polyacrylamide gel electrophoresis. The loading volumes were adjusted to equalize the protein concentrations in each well. After electrophoresis, the proteins were transferred to polyvinylidene fluoride membranes (Bio-Rad). For blotting, the membranes were blocked with Tris-buffered saline (TBS) containing 0.1% Tween (TBS-T) for 1 h, followed by incubation in a primary antibody solution [1:200 anti-P2XR7 (Chemicon), 1:200 anti-P2YR12 (Santa Cruz) or 1:5000 anti-actin (1:5000) in TBS-T containing 1% bovine serum albumin and 0.02% sodium azide] overnight in the cold room. After three 10 min TBS-T washes, the membranes were labeled with the secondary antibody solution (HRP-conjugated, 1:2000 in TBS-T containing 5% milk) for 1 h, then washed three times for 10 min in TBS-T. After treatment with chemiluminescence, the bands were visualized upon film exposure. Unless otherwise mentioned, all steps were carried out at room temperature. The scanned protein bands were quantified using ImageJ and normalized to total actin.
High performance liquid chromatography (HPLC)
HPLC was used to measure the levels of various amino acids in the culture media. A C-18 column (Waters Symmetry, 5 µm, 4.6 × 150 mm) with Sentry guard columns was used in a Waters 2695 separation module. The proteins in the media were precipitated out with methanol (2:1 volume methanol:sample); the remaining supernatants were then subjected to fluorescence derivatization by o-phthaldialdehyde/isobutyryl-l-cysteine (OPA/IBLC; 1:1 mixture; the derivatization reagent contains 1 mg OPA and 2 mg IBLC dissolved in 0.1 ml methanol, then mixed with 0.9 ml 0.2 M pH 10 sodium borate) prior to running through mobile phases. Mobile phase A, adjusted to pH 6.2 with NaOH, per 2 l contained 300 ml methanol, 8.4 g NaH2PO4 and 1.4 g Na2HPO4. Mobile phase B, adjusted to pH 6.2 with NaOH, per 2.5 l contained 1110 ml methanol, 60 ml tetrahydrofuran and 6.4 g NaH2PO4. The mobile phase gradient started at 85% A:15% B and shifted to 100% B over 35 min. The total runtime for each sample was 45 min with all compounds eluting by 30 min. The fluorescent derivatives were detected using a Shidmazu RF10A detector, excitation at 344 nm and emission at 433 nm.
Statistical analysis
Significance levels were calculated using two-way analysis of variance (ANOVA) followed by Bonferroni post hoc test. For the HPLC data sets where two-way ANOVA is not necessary, one-way ANOVA followed by Newman–Keuls post hoc test was used. For the MAP-2 immunoreactivity data, where there is unbalanced grouping, one-way ANOVA and Newman–Keuls test was also used instead of the two-way. The denotations *, #, + and & represent P < 0.05. Each n represents a single well of a culture plate.
RESULTS
Regional differences in microglial morphology
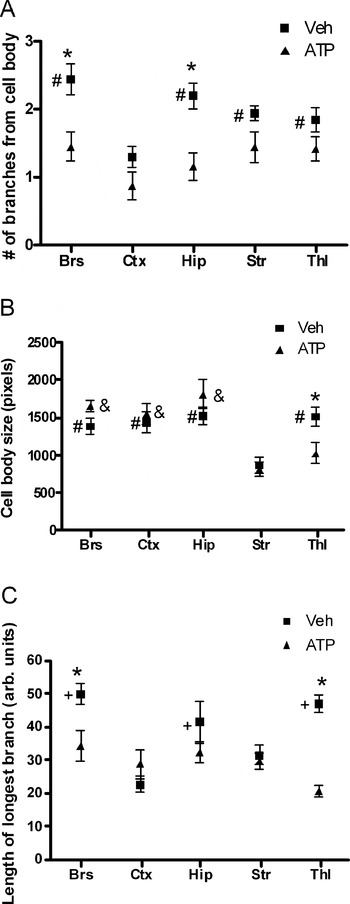
Although the morphological features of microglia do not necessarily correlate with their functions, they can nonetheless serve as a marker for a particular microglial phenotype and perhaps give indication of potential regional differences. Using the myeloid marker Iba1, the morphological features of microglia can be visualized in detail. As mixed cultures, there were no apparent regional differences in the gross appearance of the cultures. However, when isolated as enriched microglial cultures, there was noticeable regionality. As shown in Fig. 1, microglial cultures derived from Ctx contain mostly round and amoeboid cells (arrow), as opposed to most Str microglia which have extensive processes (chevron). The right column of Fig. 1 shows the 1 mM ATP-treated cultures, which have regionally distinct morphologies as well. In particular, ATP-stimulated microglia from Str appear to be smaller overall than other regions. To quantitatively describe these morphological differences, the number of branches (stemming from each cell body, Fig. 2A), the average size of the cell bodies (Fig. 2B) and the length of the longest branch (Fig. 2C) were measured. Quantitative analysis showed that without ATP stimulation, Ctx microglia had the least number of branches as well as the shortest branch length (Fig. 2). In contrast, untreated Str microglia were characterized by high branch number, short branch length, yet also smaller cell bodies than the other regions (Fig. 2). ATP stimulation induced significant morphological changes in Brs, Hip and Thl, but not Ctx and Str microglia (Fig. 2). There were no regional differences among ATP-treated microglia in branch number and branch length; however, the cell bodies of ATP-treated Str and Thl microglia were significantly smaller than other regions (Fig. 2).
Microglia derived from different brain regions exhibit heterogeneous morphology in culture. Representative micrographs of untreated and ATP-stimulated primary microglia derived from Brs, Ctx, Hip, Str and Thl. Total magnification = 200×. Scale bar = 20 µm. Arrow points to an example of amoeboid microglia. Chevron points to an example of ramified microglia with extensive processes.

Quantitative morphological analysis of Iba1-labeled microglia showing region-specific differences in various morphological features: (A) Total number of branches from the cell body, (B) size of the cell body and (C) length of the longest branch of a cell. *Denotes significance between the non-treated and ATP-treated groups in each region. #Denotes significance within the non-treated groups (relative to Ctx for A, to Str for B and to Ctx for C). + Denotes significance within the non-treated groups relative to both Ctx and Str. & Denotes significance within the ATP-treated groups relative to both Str and Thl. n = 8.

Regional differences in released effectors of microglia
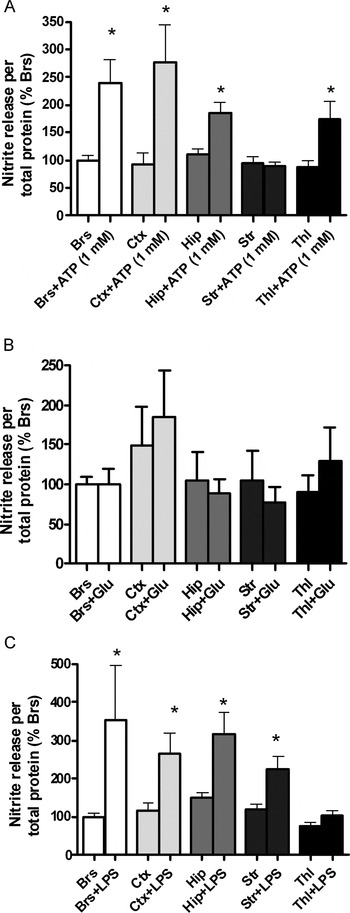
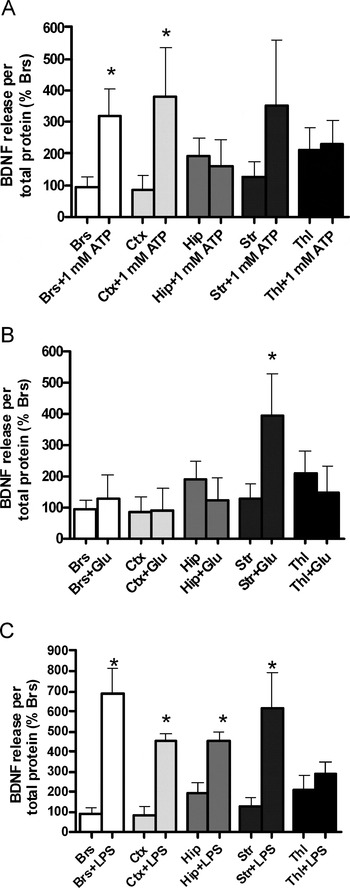
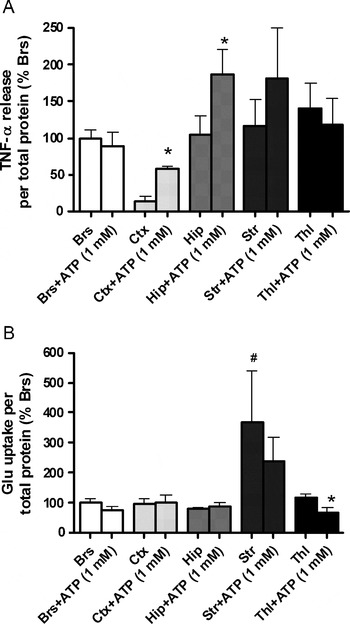
The overall observation from morphological analyses suggested the presence of regionality among microglial populations. Ctx and Str microglia were particularly distinct morphologically from microglia of other regions. To determine whether these morphological differences have functional significance, several effectors produced by activated microglia were measured. The pro-inflammatory mediator NO was examined first. NO production is a hallmark of microglial activation, and its release from microglia can result in neurotoxic effects to the surrounding cells. As shown in Fig. 3A, stimulating microglial cultures with 1 mM ATP for 24 h resulted in upregulation of NO release in microglia from all of Brs, Ctx, Hip and Thl, but not in those derived from Str. This pattern of NO upregulation, however, was dependent on the specific activating agent: stimulating microglia with either 30 µM or 1 µg ml−1 LPS for the same duration did not yield a similar pattern. In the case of GLU stimulation, NO release was not altered in any of the examined regions (Fig. 3B). Stimulation with LPS yielded a regional profile distinct from that of ATP, where microglia from Brs, Ctx, Hip and Str, but not Thl, demonstrated upregulated NO release (Fig. 3C). This activator-dependent pattern was not restricted to pro-inflammatory effectors, as microglial release of the neurotrophin BDNF also showed regionality specific to the activating agent. At 1 mM ATP, BDNF release was upregulated in microglia derived from Brs and Ctx (Fig. 4A). Interestingly, although the same ATP concentration had no effects on Hip microglia, a lower ATP dose at 10 µM did induce the release of BDNF (Fig. 4A). In the case of GLU stimulation, only Str microglia upregulated BDNF release (Fig. 4B). The LPS response was more ubiquitous and less region specific, as all of the regions examined except Thl increased BDNF release after LPS treatment (Fig. 4C). Overall, the data on NO release are in line with morphological observations such that Str microglia are the least responsive to ATP. Microglial morphology in culture nonetheless does not always correlate with function, and this is the case with regard to BDNF release. Thl microglia are interesting in that they uniquely did not upregulate NO nor BDNF release in response to LPS. We did not explore this further, and the next set of experiments focused on only the ATP-induced responses due to the fact that it is an endogenous activator (as opposed to LPS), and as shown in Fig. 3, is a more potent activator than GLU. In addition to NO and BDNF, two other microglial effectors, TNF-α and GLU transporter, were also examined. TNF-α release normally coincides with NO production due to their common effects on promoting neuroinflammation. Although one would expect a similar pattern of regionality between TNF-α and NO, it was not the case here. At 1 mM ATP, TNF-α release was significantly increased only in Ctx and Hip microglia and not in microglia derived from other regions (Fig. 5A). The patterns and TNF-α and NO were nonetheless similar in that neither effector was upregulated in Str microglia. In regards to GLU transport, microglia from Str were again distinct from other regions. Without ATP stimulation, the basal GLU uptake activity of Str microglia was higher than Hip microglia. In response to ATP, no significant increases in GLU uptake were observed in any of the regions examined (Fig. 5B). In fact, Thl microglia at 1 mM ATP actually downregulated GLU uptake (Fig. 5B).
Activator-induced release of NO from microglia is region dependent and activator dependent. (A) ATP-stimulated NO release (n = 12). (B) GLU-stimulated NO release (n = 8). (C) LPS-stimulated NO release (n = 17). *significance relative to the untreated condition in each region.

Region-dependent and activator-dependent induction of BDNF release from microglia. (A) ATP-stimulated release of BDNF (n = 5). (B) GLU-stimulated release of BDNF (n = 5). (C) LPS-stimulated release of BDNF (n = 4). *Denotes significance relative to the untreated condition in each region.

Region-specific regulation of microglial TNF-α and GLU uptake. (A) TNF-α release (n = 12) and (B) GLU uptake (n = 6) by ATP. *Denotes significance relative to the untreated condition in each region. #Denotes significance relative to Hip.

Region-specific effects on neuronal survival
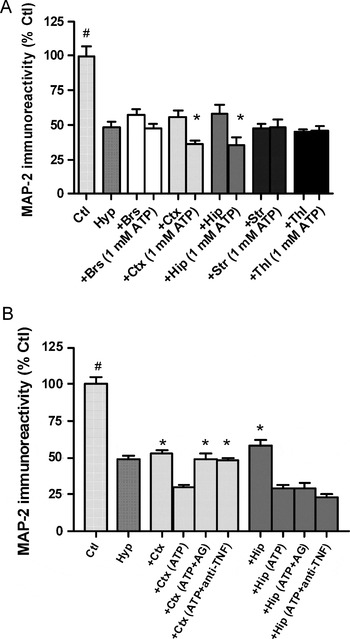
Taken together, the regional profiles of NO, TNF-α and BDNF release, as well as GLU uptake each have a unique pattern. A general trend though was observed, such that microglia from Str had the most distinct phenotype with respect to other regions, particularly in comparison to microglia from Ctx (in terms of morphology) and Hip (in terms of effector profile). The results thus far are indirect measures of the physiological activities of microglia. How the regional differences in effector profiles translate towards functional significance is yet to be determined. Therefore, the next set of experiments investigated how ATP-stimulated microglia from various brain regions affected the survival of neurons after insult/injury. To induce an insult to neuronal cultures, they were exposed to Hyp for 2 h followed by 24 h of re-oxygenation. This procedure induced 50–55% neuronal death. To assess the effects of microglia on these injured neuronal cultures, ATP-stimulated microglia were manually detached and transferred to the neuronal cultures immediately following Hyp. Under this experimental setup, ATP-stimulated microglia from Ctx and Hip induced significantly more toxicity to neurons compared to their respective non-stimulated controls (Fig. 6A). In contrast, ATP-stimulated microglia from the other regions did not induce any significant toxicity (Fig. 6A). This pattern correlates with that of the pro-inflammatory mediators, especially TNF-α, which was upregulated in Ctx and Hip microglia only. Thus, the possibility exists such that the neurotoxicity induced by Ctx and Hip microglia was due, in part, to the increased release of pro-inflammatory mediators such as NO and TNF-α. To test this hypothesis, an anti-TNF-α antibody (0.1 µg ml−1) and the iNOS inhibitor AG (300 µM) were added to the culture media immediately after the addition of microglia to the neuronal cultures. Treatment with either anti-TNF-α or AG reversed the toxicity induced by ATP-stimulated microglia from Ctx (Fig. 6B). Unexpectedly, neither treatment was able to reverse the toxicity induced by ATP-treated Hip microglia (Fig. 6B). This in turn suggests that the toxicities induced by Ctx microglia and Hip microglia were mediated by different effectors. In the case of Hip microglia, toxic effectors other than NO and TNF-α are likely involved in the observed neurotoxicity.
Neurotoxicity induced by microglia derived from different regions. (A) ATP-activated microglia induce region-dependent neurotoxicity when co-cultured with Hyp-injured neurons (n = 14). (B) Effects of AG and anti-TNF-α on the neurotoxicity induced by Ctx and Hip microglia (n = 14). *Denotes significance relative to the untreated condition in each region for A, and relative to the ATP condition for B.

Regionality of ATP receptors
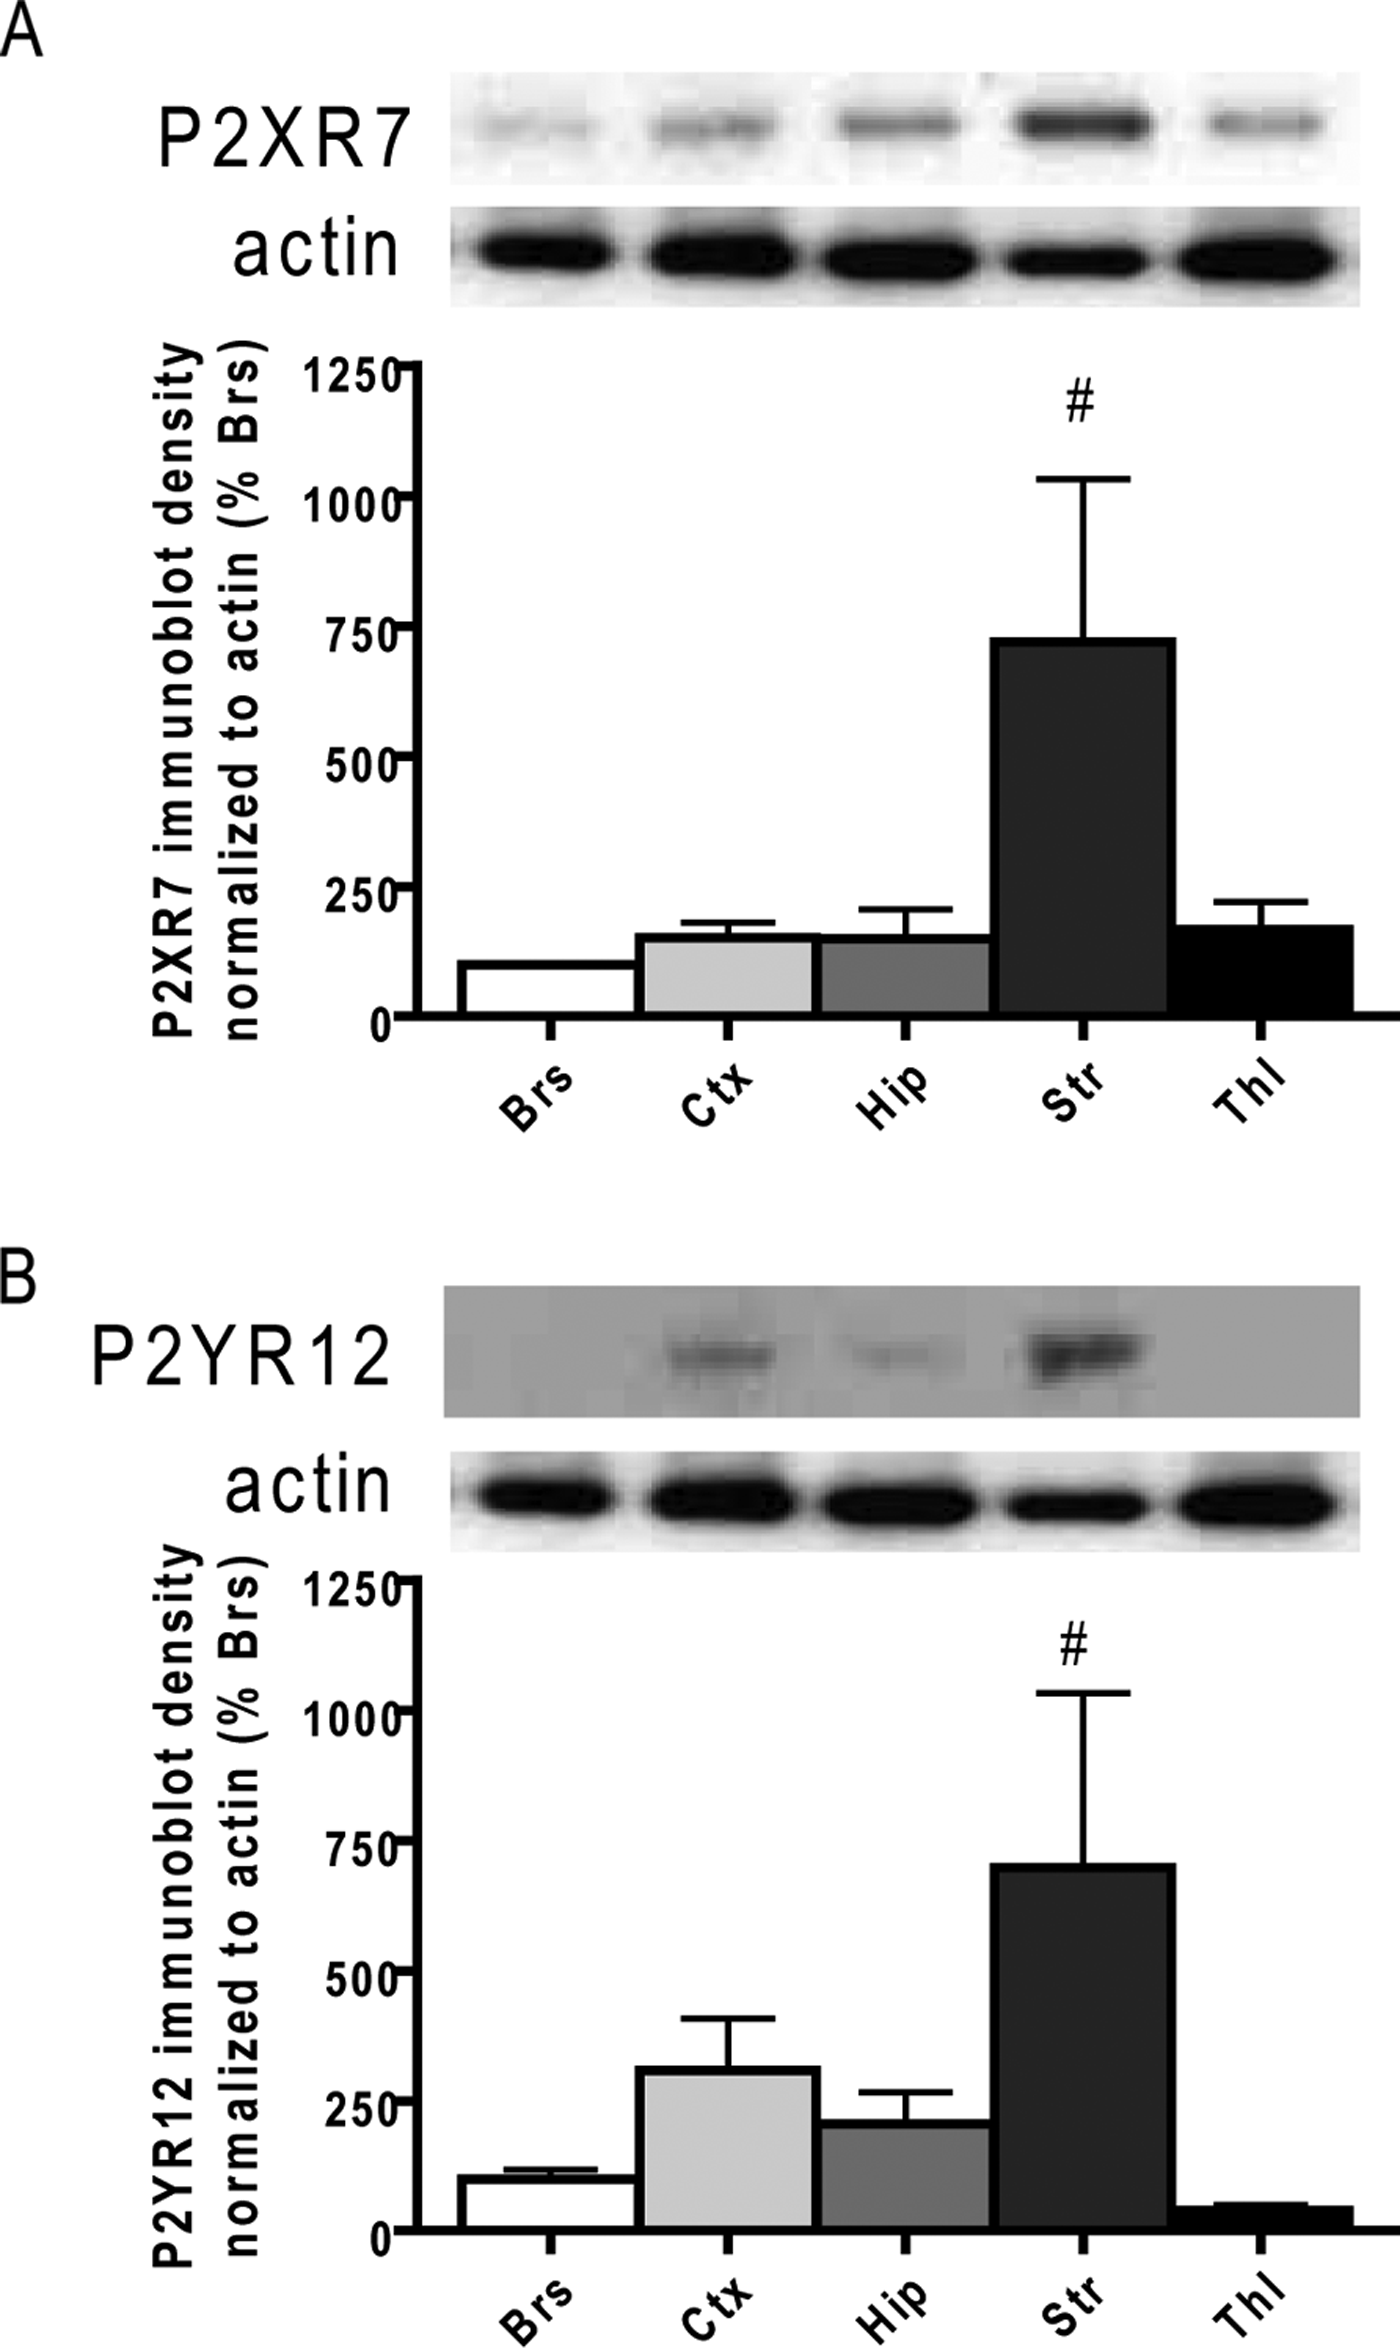
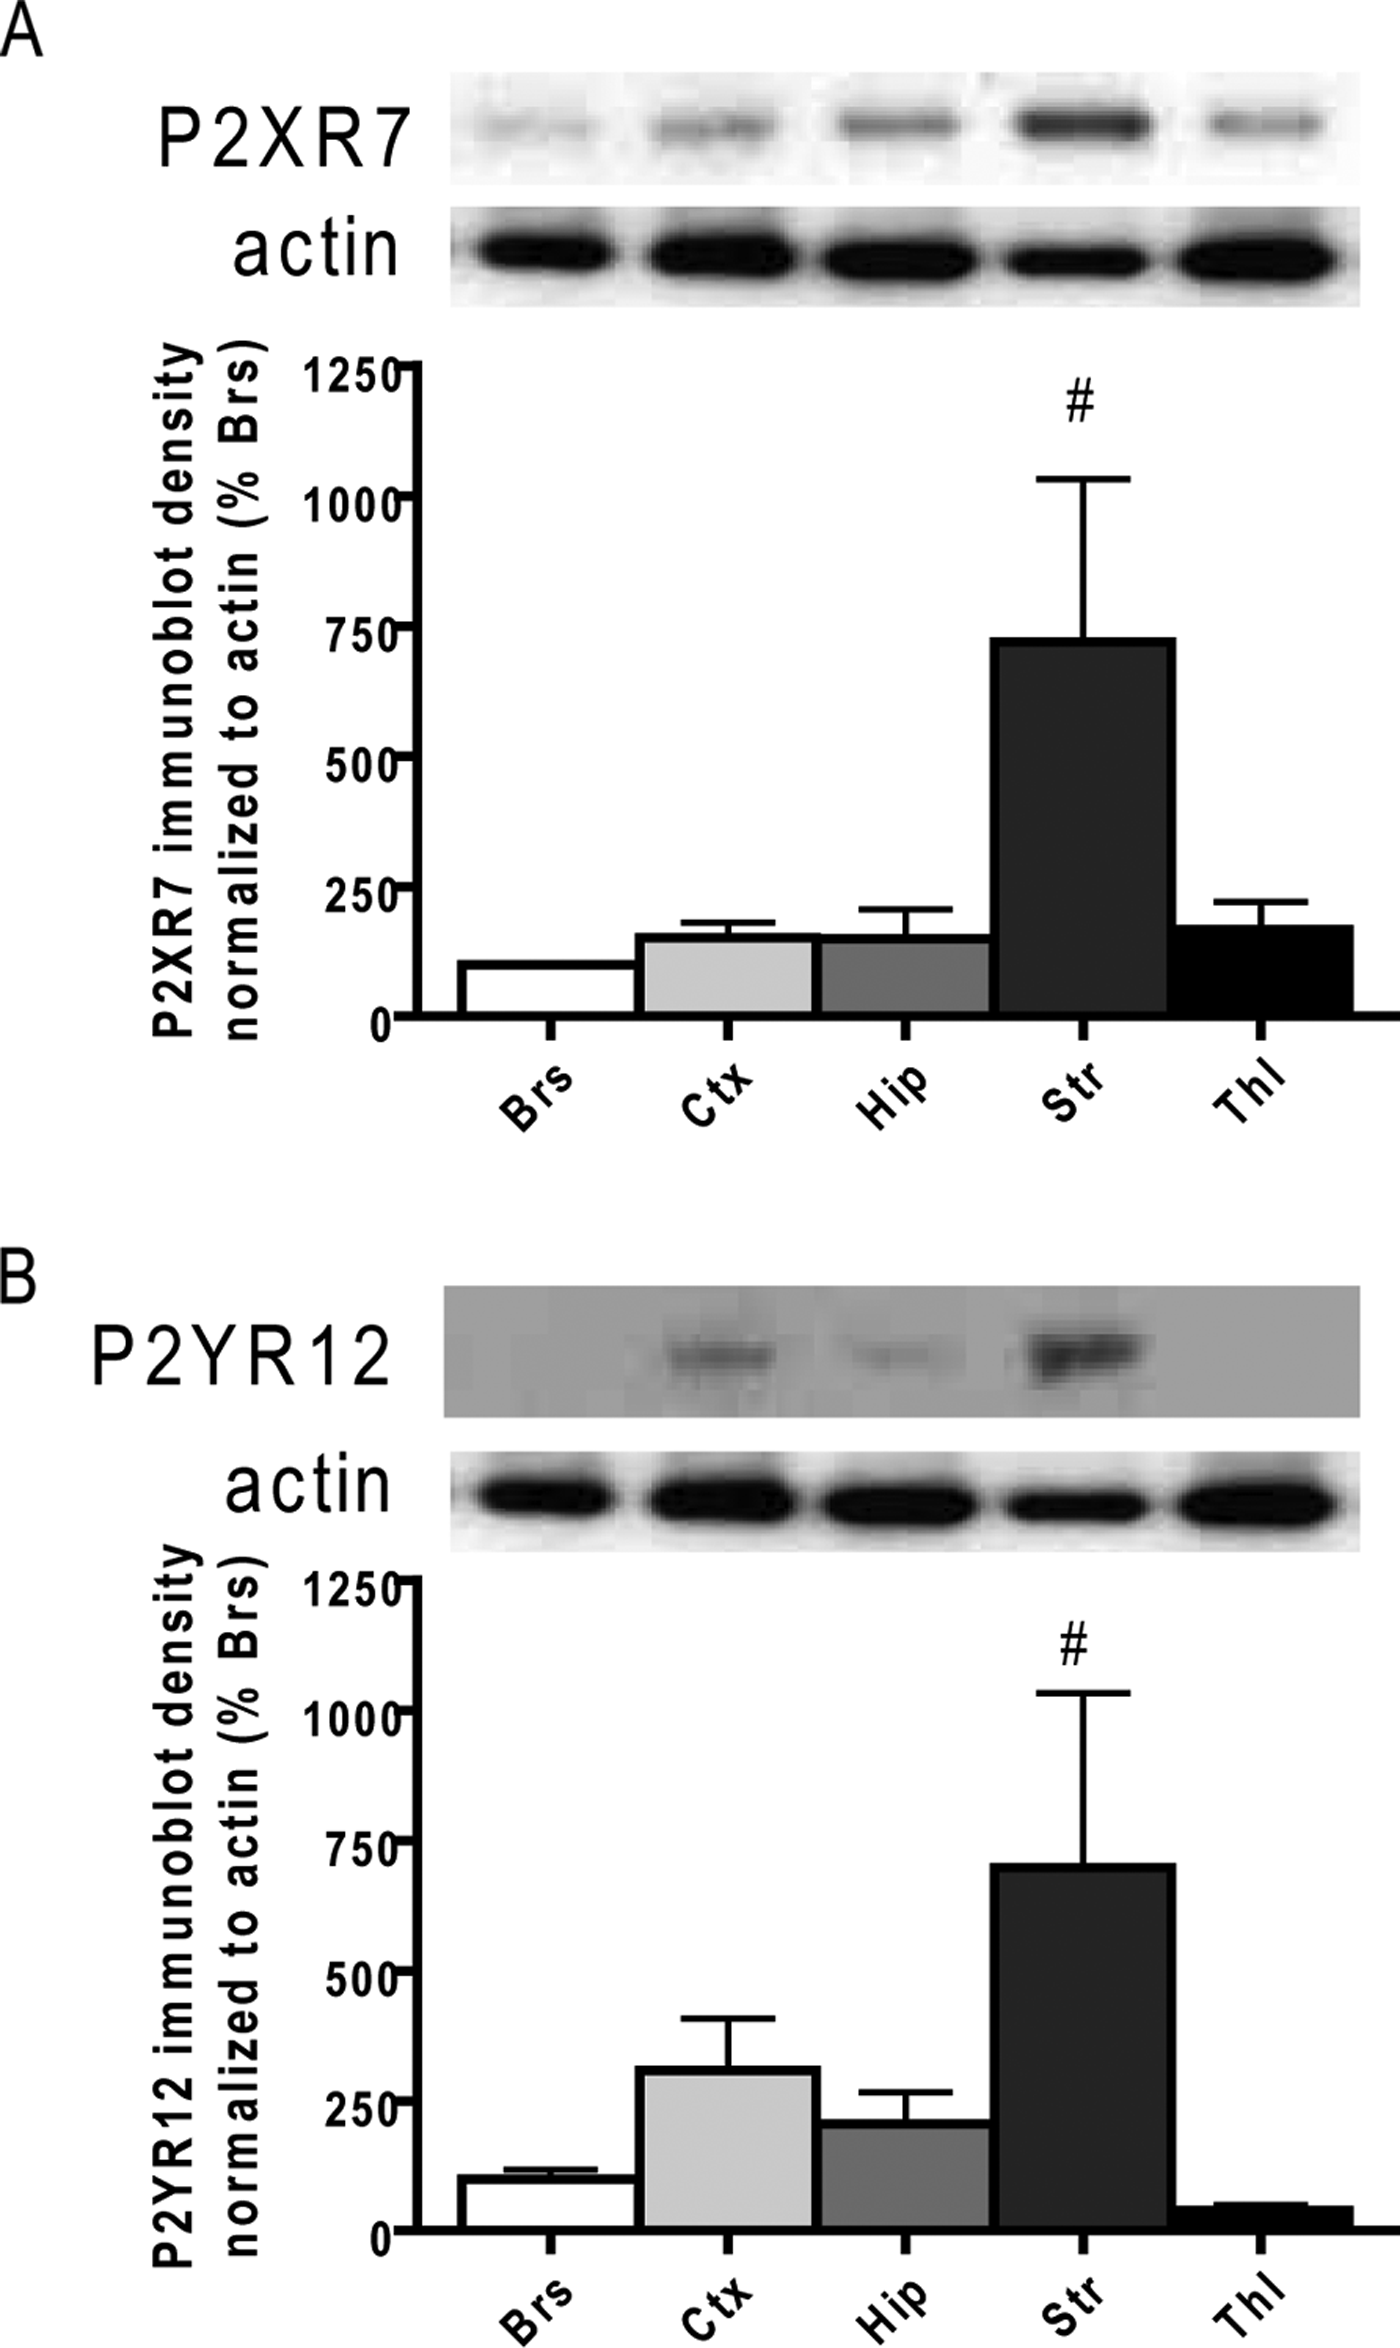
The next set of experiments investigated whether or not the expression of ATP receptors on microglia was also regionally unique. The possibility exists such that regional differences in the expression of these receptors on microglia play a role in their region-specific responses to ATP. Two major receptors for ATP expressed by microglia are the purinergic receptors P2XR7 and P2YR12 (Inoue, Reference Inoue2002). By immunoblotting, the regional expressions of these receptors were determined. We found that Str microglia expressed higher levels of both receptors compared to other regions (Fig. 7). The fact that basal P2XR7 and P2YR12 expressions were higher in Str microglia is surprising since Str microglia appear less responsive to ATP. Similarly, Thl microglia, which upregulated NO release in response to ATP (and not GLU or LPS), surprisingly expressed low levels of P2XR7 and P2YR12. However, it is worth noting that expression levels of receptors do not always correlate with ligand sensitivity. For instance, a previous study comparing young and aged microglia showed higher expression of P2X and P2Y receptors in microglia derived from aged mice (Crain et al., Reference Crain, Nikodemova and Watters2009); aged microglia, however, were shown to be less responsive to ATP in another report (Damani et al., Reference Damani, Zhao, Fontainhas, Amaral, Fariss and Wong2011).
Striatal microglia express higher levels of P2X7 and P2Y12 receptors compared to microglia from other regions. (A) P2X7 receptor immunoblot and blot quantification (n = 5). (B) P2Y12 receptor immunoblot and blot quantification (n = 4). #Denotes significance relative to Brs for A and to Thl for B.
Regionality of activated microglia is plastic and originates from neurochemical conditioning
Having established that regional heterogeneity does exist among activated microglia, the question then arises as to how this heterogeneity came about. One possibility is that microglia from different brain regions were influenced by their surroundings during development, and by the time they matured had already acquired a fixed pool of transcripts that provide each microglial population with a hardwired identity. The other possibility was that rather than having a fixed phenotype, mature microglia remain dynamic such that changes in the neurochemical environment can readily alter their inflammatory machinery, and in turn, their responses to activators. To test which of these speculations was true, a conditioning experiment was performed. Under this conditioning procedure, conditioned media (CM) from mixed cultures of Hip and Str were collected just prior to microglial isolation. These CM were then incubated with freshly isolated microglia from an ectopic region (either Hip, Str or Thl). After 24 h of incubation, they were stimulated with ATP for an additional 24 h. We chose CM from Hip and Str because microglia from these two regions had opposite responses to ATP with regard to NO release. Measuring NO release from these conditioned microglia showed that when Hip and Thl microglia were ectopically incubated with Str CM, they obtained Str microglia-like behavior such that they no longer upregulated NO release in response to ATP (Fig. 8). Conversely, when Str microglia were incubated with Hip CM, they also obtained a Hip microglia-like phenotype, upregulating NO release in response to ATP (Fig. 8). This result suggests that regional heterogeneity of microglial activation is indeed influenced by the surrounding environment, and can be ‘re-influenced’ when that environment changes. To further verify this hypothesis, the microglia that were incubated with ectopic CM for 24 h were re-conditioned with CM from their region of origin for an additional 24 h. In theory, if the regionality of microglial activation is more plastic than hardwired, re-incubation with CM from the region of origin should restore the original phenotype. This was the case for Str microglia; when Str microglia were incubated ectopically with Hip CM then followed by Str CM, they did not increase NO release in response to ATP, resembling an Str phenotype (Fig. 8). However, the same restoration of phenotype did not occur in Hip and Thl microglia. Neither had ATP-induced increase in NO after incubation with CM from their Regions of origin and still possessed an Str microglia-like phenotype (Fig. 8). This suggests that the regionality of microglial activation may only be dynamic and plastic to a certain degree.
Ectopic regional conditioning of microglia. Release of NO by hippocampal, striatal and thalamic microglia after treatment of CM from an ectopic region, and also after re-conditioning with media from their original regions. n = 5. #Denotes significance relative to the untreated condition of each conditioning paradigm.

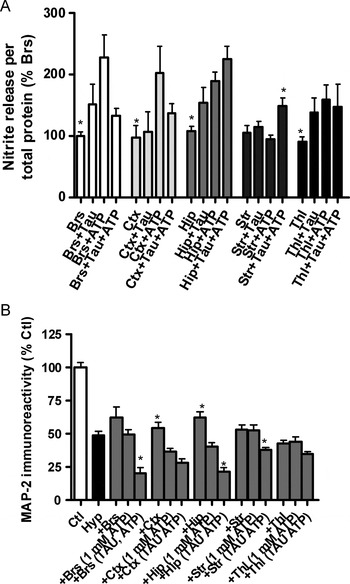
The mechanism that underlies this conditioning phenomenon then comes into question. What are the specific signaling molecules involved in conditioning microglia from one regional phenotype to another? In addition to purinergic receptors, microglia express receptors for various neurotransmitters, some of which are known to possess modulating functions on microglial activation (Pocock and Kettenmann, Reference Pocock and Kettenmann2007). These neurotransmitters may act as environmental cues that condition microglia into distinct phenotypes. If this is indeed the case, the CM from mixed cultures of distinct regions should have region-specific profiles of neurotransmitters. Using HPLC, CM media from mixed cultures of different regions were measured for levels of various brain amino acids. Surprisingly, levels of glutamate and γ-amino butyric acid (GABA), both of which are known to modulate microglial activity (Pocock and Kettenmann, Reference Pocock and Kettenmann2007), were not regionally different (data not shown). There were also no differences across regions in levels of glutamine (GLN) and aspartate (ASP) (data not shown). The levels of asparagine (ASN), l-serine (L-SER), d-serine (D-SER), glycine (GLY), TAU and alanine (ALA) showed significant differences between regions (Fig. 9), suggesting their potential involvement in conditioning microglial phenotypes. The amino acid TAU is of particular interest because it is found in lower concentrations in the Str CM compared with CM of other regions, which correlates with the previously described patterns of regionality. To determine the precise role of TAU, microglia isolated from different regions were conditioned with 20 µM TAU (the highest level of TAU measured in the CM) for 24 h prior to ATP stimulation. Based on the HPLC data, the low level of TAU in the Str CM may be responsible for the lack of increased NO release in ATP-stimulated microglia from Str. Indeed, when Str microglia were pre-conditioned with TAU, an increased NO release after ATP stimulation was observed (Fig. 10A). TAU pre-conditioning of Hip and Thl microglia had no effects on their release of NO, whereas in Brs and Ctx microglia, TAU pre-conditioning actually attenuated ATP-induced NO release to a noticeable but not statistically significant level (Fig. 10A). The effects of TAU pre-conditioning were also evident with respect to the overall toxicity induced by microglia: using a similar setup as previously described, ATP-stimulated microglia were transferred to neurons that were exposed to Hyp. As expected, when pre-conditioned with TAU, ATP-treated microglia from Str, which were not neurotoxic without TAU treatment, induced significantly more neuronal death (Figs 4–10B). Notably, TAU pre-conditioning had the same effect for Brs and Hip microglia despite the fact that TAU did not potentiate their release of NO (Figs 4–10B), suggesting that TAU may modulate other microglial effectors involved in neurotoxicity.
Levels of amino acids present in the media from the mixed cultures that microglia are derived from. Each region shows a distinct profile of amino acids measured by HPLC. n = 6.

Effects of TAU conditioning. (A) Effect of TAU pre-conditioning on the ATP-induced release of NO by microglia of various regions (n = 6). (B) Effect of TAU pre-conditioning on the ATP-induced neurotoxicity of microglia (n = 8). *Denotes significance relative to the ATP-treated group in each region.

In addition to amino acids, several biogenic amines that function as neurotransmitters and neuromodulators also have effects on microglial activity. Microglia express receptors for amines such as dopamine and noreadrenaline (Pocock and Kettenmann, Reference Pocock and Kettenmann2007). However, HPLC measurement of CM from mixed cultures did not detect regional differences for these compounds (data not shown). Other biogenic amines such as 3,4-dihydroxyphenylacetic acid, 5-hydroxyindoleacetic acid, homovanillic and serotonin were measured as well, but did not show significant regional differences (data not shown).
CONCLUSIONS
• Neonatal microglial cultures derived from different regions of the brain mount regionally distinct responses upon activation in vitro.
• When co-cultured with injured neurons, activated microglia induce different levels of neurotoxicity that correlates with their region-specific phenotypes.
• Region-specific responses of microglia are not hardwired, but are plastic and can be altered by changing the surrounding neurochemical milieu.
DISCUSSION
It is well known that similar degrees of CNS insult to different regions of the brain often yield variable levels of damage. Similarly, classic CNS diseases such as Parkinson's disease display regional vulnerability (Lee et al., Reference Lee, Tran and Tansey2009). Intrinsic differences between neurons of different regions play a large role in this selectivity. In addition to heterogeneity between neurons, regional differences between glial cells play an important role, considering that glial cells often dictate the outcome of neuronal survival and disease progression. There have been in-depth studies on the regional heterogeneity of astrocytes, in particular the astrocytic GLU transport (Schlüter et al., Reference Schlüter, Figiel, Rozyczka and Engele2002; Han et al., Reference Han, Koh, Lee and Seong2004). Similar studies on microglia have focused on regional differences under their resting/ramified state [6, 7, 8, 9, 10, 11, 12], but not their responses after activation, nor how these region-specific microglial responses affect the survival of neurons. Using an in vitro system, the results from this study were able to address these questions. An apparent disadvantage of culture systems is the removal from their native environment in the brain. Growing in a serum-supplemented media simulates a brain environment that more closely resembles one with a disrupted blood–brain barrier rather than an undisturbed state. Nonetheless, the mixed cultures by the time of microglial isolation still contained most of the CNS components, including neurons, astrocytes, oligodendrocytes and endothelial cells (data not shown). Then it is safe to assume that whatever signals microglia have received from other cell types while in their native tissue are still present even after culture. This would explain why in a similar study by Ren et al. (Reference Ren, Lubrich, Biber and Gebicke-Haerter1999), despite being in culture for more than 2 weeks, microglia still maintained their regionality. Another limitation of this culture model is the fact that the cultures are derived from neonatal brains. A major difference between neonatal and adult brains is the incompleteness of myelination and lack of white matter in the neonatal CNS. This would then exclude the microglial population that resides along white matter tracts, which some have suggested to have a specialized phenotype (Hanisch and Kettenmann, Reference Hanisch and Kettenmann2007). Even when isolated in culture, there are results demonstrating that microglia derived from adult and neonatal brains respond differently to activating agents (Floden and Combs, Reference Floden and Combs2006). One should therefore take caution in extending the results here toward different age groups. Regardless, the regionality of microglial activation is likely a universal phenomenon, and one would only expect microglial populations to grow more distinct from one another with increasing age, as they receive increasing exposure from their respective milieus. However, it is possible that regionality among adult microglia is less dynamic and more hardwired than the neonatal microglia observed in this study.
A disadvantage of studying microglia in culture is their potential to adapt alternate phenotypes in the absence of neurons and other glial cells. Apart from the limitations, the culture model is advantageous in that microglia can be activated alone. Receptors for microglia-activating ligands such as ATP and GLU are also expressed on neurons and astrocytes, imposing difficulties in interpreting data from a similar study in vivo. Our in vitro data showed that ATP-activated microglia from Ctx and Hip were more neurotoxic, and that this toxicity, at least in the case of Ctx microglia, likely involves the overproduction of NO and TNF-α. It is evident though that there are other key molecules involved in the observed neurotoxic effects, which explains why NO and TNF-α inhibition was insufficient to inhibit the neurotoxicity exerted by Hip microglia (Fig. 6B). Other neurotoxic microglial effectors that can potentially be induced by ATP include interleukin-1 and interleukin-6 (Inoue, Reference Inoue2002).
A key question raised in this study concerns the origin of microglial regionality, which was addressed by the pre-conditioning experiments. The results showed that (1) the surrounding neurochemical environment plays an important role, (2) the establishment of microglial heterogeneity is dynamic and reversible, where altering the neurochemical environment for 24 h was sufficient to make microglia from one brain region ‘behave’ like those from a different region and (3) the neurochemical milieu in the Str contain signals more potent in conditioning microglia compared to signals from other regions. This may explain why after incubation with Str CM, Hip and Thl microglia were not able to be conditioned back to their original phenotype (Fig. 8). The regional profile of the amino acids measured by HPLC (Fig. 9) implicates the involvement of several molecules in the establishment of microgilal regionality. TAU was shown to play a role, but it is likely that GLY and D-SER are involved as well, considering their known modulatory activity on GLU receptors (which are expressed by microglia) (Wolosker, Reference Wolosker2007). Although no regional differences were found in GLU, GABA or other classical neurotransmitters such as dopamine and noreadrenaline, all of which are known to modulate microglial activity (Pocock and Kettenmann, Reference Pocock and Kettenmann2007), and it remains a possibility that they have contributions to the regionality of microglia since these neurotransmitters could have been uptaken/degraded by the time they were measured. Future investigations are needed to better understand the role(s) each neurochemical has in influencing the microglial phenotype.
In conclusion, data from this study provide novel evidence that microglia respond to activators in a region-specific manner, and that this regional heterogeneity originates from differences in the surrounding chemical environment. This is also the first study to show a relationship between TAU and microglia, which, as the results suggest, is involved in the establishment of microglial regionality. The regionality of activated microglia provides an additional explanation for the regional selectivity/vulnerability of CNS disorders. Furthermore, whereas most studies on microglia have focused on activating signals from other brain cells, this study has demonstrated the importance of intrinsic differences among microglia themselves in determining their activation phenotypes. Most importantly, the findings here demonstrate the dynamic nature of microglia, which is an important factor to consider when conducting experiments on these cells that have the potential to readily alter their phenotypes upon changes in the surroundings.
ACKNOWLEDGEMENTS
Funding for this research was provided by the Canadian Institutes for Health Research (CIHR), the National Sciences and Engineering Research Council of Canada (NSERC), the Heart and Stroke Foundation of Canada, the Canadian Stroke Network and the Davey Fund for Brain Research. The authors also thank Gail Rauw for the technical assistance provided on the HPLC experiments.
Statement of interest
The authors declare that they do not have conflicts of interest with regard to the contents of this study.