

Introduction
Maps of the internal layout of ancient cities provide an important frame within which archaeologists reconstruct the logistics and experience of early urban life. The placement, spatial form, and size of streets, buildings, and other features allow for recreation of residents’ lived experience and daily activities and provide insights into social relationships and political practices of authority (Smith Reference Smith2003). Further, the spatial relationship of the built environment to hydrological and topographic features may show how human-environmental relationships shaped ancient cities.
In southern Mesopotamia, high-resolution satellite and aerial imagery captured during periods of elevated soil moisture often reveal unprecedentedly detailed street and architectural plans due to differences in absorption and drying rates. When applied to single period sites or components of sites, mapping using these images has the potential to elevate our knowledge of early Mesopotamian urban form beyond that provided by the extensive early twentieth century excavations in the region, showing the organization of neighbourhoods, the spatial relationships between different neighbourhoods, palaces, and temples, and the role of city walls, canals, bridges, and harbours in connecting or separating people and powerful institutions (Stone Reference Stone2014; Stone and Zimansky Reference Stone and Zimansky2004; Stone Reference Stone2012). The recent use of UAV (drone) cameras, in concert with surface survey and ground observations, allows for mapping at a more detailed scale (Hammer Reference Hammer2019; Marchetti et al. Reference Marchetti, Al-Hussainy, Benati, Luglio, Scazzosi, Valeri and Zaina2019).
Satellite imagery and UAV (drone) photos taken at Lagash (modern Tell al-Hiba, Dhi Qar province, Iraq) after rainstorms and during times of elevated soil moisture reveal dense near-surface architecture that dates mostly to the Early Dynastic III period (c. 2600–2350 BCE) and covers several hundred hectares. Lagash therefore provides a rare opportunity to trace the spatial organization of this early Mesopotamian city and its neighbourhoods within centuries of their original foundation. In this paper, we present the results of mapping the near-surface architectural remains, streets, and water features across Lagash. The mapping reveals a discontinuous city plan located within a watery, possibly marshy environment. Further, the mapping offers new information concerning the positioning of previously excavated buildings, especially temples, within the broader city fabric. The extents of the near-surface architectural remains and intra-city watercourses suggest revisions to previous estimates of Lagash's maximal size and indicate contrasts with the urban form of Early Dynastic Uruk. We hypothesize on the basis of its position and characteristics that the city's largest paleochannel may have been part of the “Going-to-Nigin Canal”, a regional watercourse discussed in the Early Dynastic III, Gudea, and Ur III cuneiform texts that linked the major cities of the State of Lagash (Girsu, Lagash, Nigin, and Gu'abba).
Background
In the fifth-fourth millennium BCE, large settlements began to appear across southern Mesopotamia. The largest of these was Uruk (Warka), which covered c. 250 ha by 3100 BCE (Finkbeiner Reference Finkbeiner1991), but most large sites ranged 10-50 ha in size (Ur Reference Ur and Crawford2013: 137). In the third millennium BCE Early Dynastic period (c. 2900–2350 BCE), many of the largest settlements swelled to hundreds of hectares in size. Regional surveys suggest around 80% or more of the population congregated in cities in the first phase of this period (Adams Reference Adams1981: 138; Marchetti et al. Reference Marchetti, Al-Hussainy, Benati, Luglio, Scazzosi, Valeri and Zaina2019: 223). Uruk continued as the largest of these cities, expanding to c. 400 ha in the Early Dynastic I period (c. 2900–2700 BCE) (Finkbeiner Reference Finkbeiner1991).
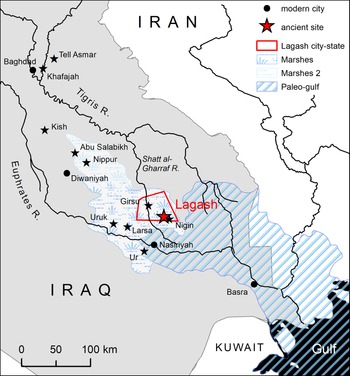
Lagash, modern Tell al-Hiba, is also frequently cited as one of the largest third millennium BCE cities, at perhaps 400-600 hectares (Carter Reference Carter1989–90; Yoffee Reference Yoffee2005: 57; Ur Reference Ur and Crawford2013: 141). The site is located north of the modern city of Nasiriyah, beyond the huge areas of southern Iraq that were subject to extensive archaeological survey in the mid-twentieth century (Adams Reference Adams1981; Adams and Nissen Reference Adams and Nissen1972; Jacobsen Reference Jacobsen1969) (Figure 1). A surface survey in 1984 found that the majority of the surface pottery dates to the Early Dynastic III period (c. 2600–2350 BCE) (Carter Reference Carter1989–90; Goodman, Renette, and Carter Reference Goodman, Renette, Carter, Nadali, Pittman and Polcaroin press). A few sherds of the Uruk period (c. 4000–3100 BCE) were found in widely dispersed survey units, and some Jemdet Nasr period (c. 3100–2900 BCE) materials were recovered from excavation, indicating that Lagash may have had origins going back to the fourth millennium BCE. The site was most extensively occupied in the mid-third millennium BCE. Subsequent occupation through the end of the Old Babylonian period in the mid-second millennium (to c. 1600 BCE) contracted and was mostly concentrated in the north-centre of the site, in the vicinity of the Area B excavations. Some Isin-Larsa and Old Babylonian material was also found at the northern tip of the site and in the vicinity of the Area C excavations. Later sherds dating to the Kassite period (c. 1595-1155 BCE) and to the ninth-tenth centuries CE were also found in a few survey units in the north of the site and east of Area C, respectively.
Location of Lagash in southern Iraq in relationship to modern cities, modern river course, other ancient cities mentioned in the text, and the possible maximum extent of the Gulf and associated marshes c. 4000 BCE (after Pournelle Reference Pournelle2003). The approximate boundaries of the Early Dynastic Lagash city-state are indicated, as reconstructed by Hritz Reference Hritz, Altaweel and Hritz2021 (after Steinkeller Reference Steinkeller and Stone2007 and Jacobsen Reference Jacobsen1969).

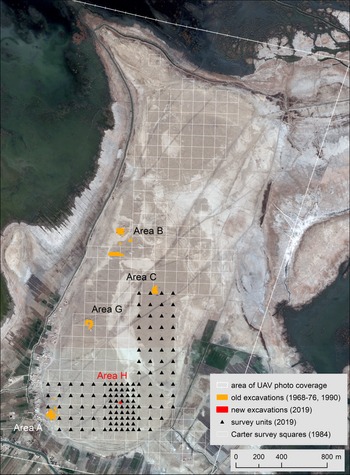
The previous excavations at Lagash in 1968-1976 and 1990 focused on monumental architecture of the Early Dynastic period, including temples and administrative buildings (Figure 2). Area A, at the southwest edge of the city, contained the Ibgal temple of Inanna, goddess of love and sex, identified and dated by inscribed figurines found in foundation deposits to the reign of the Early Dynastic III king Eannatum, c. 2400 BCE. The temple was contained within an oval-shaped precinct bounded to the north and east by a 4 m-wide wall (Ashby Reference Ashby2017; Hansen Reference Hansen1978, Reference Hansen1980-1983, Reference Hansen1992). Area B, located on the highest point of the western side of the site, contained the Bagara temple of Ningirsu, god of springtime thunder, rainstorms, ploughing, and war, who was also the patron deity of the Lagash city-state. The Bagara temple was identified and dated via several inscribed objects naming the king Eannatum to the same period as the Ibgal temple, but the Bagara was also rebuilt through the Isin-Larsa period of the early second millennium BCE (Ashby Reference Ashby2017; Hansen Reference Hansen1978, Reference Hansen1980-1983, Reference Hansen1992). Area C contained a non-religious, possibly administrative building dated to the Early Dynastic IIIB period on the basis of cuneiform texts, inscribed cones, and clay sealings naming ruling members of the Lagash dynasty. This building had an irregular plan with small rooms and had been destroyed in a conflagration (Bahrani Reference Bahrani1989; Hansen Reference Hansen1992). Area G contained a large curved wall and buildings dating to the Early Dynastic I period (c. 2900-2600 BCE). These constructions were hypothesized to have been associated with another temple (Hansen Reference Hansen1990, Reference Hansen1992). In total, five temples are known at Lagash from cuneiform texts; the unlocated ones were devoted to the goddesses Gatumdug, Nanshe, and Bau (Hansen Reference Hansen1992: 207).
Map of Lagash showing the locations of excavated trenches, squares surveyed by Carter in 1984, and the 2019 UAV camera survey area. Base image from DigitalGlobe, 8 December 2007, displayed with a 2.5 standard deviation histogram stretch.

Excavations at Tell al-Hiba recommenced in March-April 2019. Excavation in a previously un-investigated part of the site in the south, Area H, aimed to expand knowledge of non-temple spaces at Lagash by targeting an industrial area. A 10 × 10m trench was positioned at a local topographic high point in the middle of a broad area where the 1984 survey identified areas with particularly dense concentrations of ceramic slag, wasters, and ash. The excavation revealed five Early Dynastic III pottery kilns (McMahon et al. Reference McMahon, Pittman, Al-Rawi, Ashby, Burge, Goodman, Hammer and Pizzimenti2023, forthcoming). The March-April 2022 excavations examined mid-Early Dynastic houses and streets nearby.
During the Early Dynastic period, Lagash was the capital of an eponymous state comprised of three urban centres—Lagash itself (Tell al-Hiba), Girsu (Telloh), and Nigin/Nina (Tell Zurghul)—as well as smaller surrounding settlements (Huh Reference Huh2008; Carroué Reference Carroué, Bruschweiler, Christe, Martin-Achard, Urio and Vicari1983; Jacobsen Reference Jacobsen1969; Rey Reference Rey2016: 41–46). Cuneiform texts and inscriptions from Girsu (both looted and excavated) reveal aspects of the organization of the state of Lagash and its environmental situation near the head of the Gulf, a favourable location for trade (Prentice Reference Prentice2010: 124, 206). The rulers of Lagash engaged in various activities typical of Early Dynastic Mesopotamian leaders, including the construction of shrines, temples, granaries, city walls, canals, and weirs, the acquisition of rare materials such as cedar wood through long-distance trade, and leadership of military campaigns against their neighbours (Beld Reference Beld2002: 57-67). Late Early Dynastic III leaders at Lagash were frequently at war with the neighbouring city-state of Umma over the ownership of water and fields (Cooper Reference Cooper1983). The three urban centres were connected by a watercourse, named in Early Dynastic III, Gudea, and Ur III texts as the “Going-to-Nigin Canal,” which had its outlet at the sea (or lagoons preceding it). This canal more specifically linked the E-ninnu temple of Ningirsu at Girsu and the E-sirara temple of Nanshe at Nigin, and flowed below the Bagara temple at Lagash itself (Carroué Reference Carroué1986; Schrakamp Reference Schrakamp and Berking2019: 134–136). Early Dynastic III texts related to a cultic institution at Girsu headed by the wife of the ruler of Lagash (the Emunusa archive) describe a number of productive activities and deliveries related to agriculture, the herding of livestock, and the acquisition and use of various aquatic food resources and reeds (Beld Reference Beld2002: 5-35). Fresh and salt-water fishing were important economic activities (Prentice Reference Prentice2010: 110–111, 125-127).
These details from the texts indicate that Early Dynastic Lagash had access to fertile agricultural land but must also have been located within or nearby marsh and marine environments in the third millennium BCE, a conclusion that is also supported by archaeological and geological evidence. Limited faunal analysis conducted on samples collected from Early Dynastic III contexts during the 1970-1971 excavation season showed the presence of both marine and freshwater fish and marsh-based waterfowl (Mudar Reference Mudar1982), and analysis of shell assemblages recovered as part of the surface survey showed many species of marine mollusc (Kenoyer Reference Kenoyer1989-1990). Fish bones (species still to be identified) were frequently encountered in rubbish layers in street and unroofed contexts during the 2022 excavations.
Climate and sea level change, river avulsion, aggradation of the Mesopotamian plain, progradation of the Tigris-Euphrates delta, tectonics, and other factors have interacted in complex ways to cause major shifts in the location of the Gulf coastline over the last ten millennia and major changes in the environmental and hydrological situation in southern Iraq (e.g., Teller et al. Reference Teller, Glennie, Lancaster and Singhvi2000; Aqrawi Reference Aqrawi2001; Lambeck Reference Lambeck1996; Kennett and Kennett Reference Kennett and Kennett2006). As a result of these processes, the Gulf and its associated marshes extended inland from their present location c. 8000-2000 BCE, reaching their furthest northwest extent around 4000 BCE before retreating southeast (Sanlaville Reference Sanlaville1989, Reference Sanlaville, Nicholson and Clark2003; Potts Reference Potts1997: 30-39; Wilkinson Reference Wilkinson, Menotti and O'Sullivan2012; Cooke Reference Cooke1987; Pennington, Bunbury, and Hovius Reference Pennington, Bunbury and Hovius2016). The exact position of the coastline and extent of the marshes at different times remain unknown. The chronological relationship between environmental and sociopolitical changes at specific settlements also remains uncertain.
These environmental changes have significant implications for reconstructions of early Mesopotamian society and urbanism. A regional analysis of satellite imagery, geological cores, and excavation data argued that this marine incursion would have resulted in a marsh environment surrounding many of the earliest Mesopotamian cities of the fifth-third millennium BCE, including Lagash, Girsu, and Nigin (Pournelle Reference Pournelle2003, Reference Pournelle and Crawford2013; Pournelle and Algaze Reference Pournelle, Algaze, McMahon and Crawford2014). This analysis proposed specifically that Lagash was founded on a “turtleback”, an area of higher, geologically consolidated ground within a seasonally flooding marsh (Pournelle Reference Pournelle2003: 207).
While some of the early southern Mesopotamian cities like Uruk and Ur (Tell al-Muqayyar) that might have formed in a marsh environment are today isolated from water in the middle of the desert, it is not so hard for the casual visitor or the archaeologist to imagine a marsh setting for the city of Lagash because it is still today found within a seasonally expanding and contracting marsh. The archaeological teams at the site in the 1960s and 1970s had to reach Lagash by boat and parts of the site were flooded during their work, including at the time of the 1984 survey (Carter Reference Carter1989-90). One team member conducted significant ethnoarchaeological studies of nearby marsh inhabitants, illustrating the productive capacity of the wetland environment and the use of local materials in craft production (Ochsenschlager Reference Ochsenschlager2004). Marsh areas, including areas of open water, are visible in all of the imagery datasets used in our studies, especially in UAV photos, which were captured at the height of the springtime marsh expansion in 2019.
Methodology
Given Lagash's enormous size, c. 1.5 km (west-east) x 3.5 km (north-south), important aspects of the site can only be appreciated from a landscape and spatial archaeology approach. As part of larger remote sensing and fieldwork projects, we examined Lagash with satellite and aerial imagery to map traces of near-surface architecture and watercourses with the goal of reconstructing aspects of the city's layout, occupational density, and environmental situation.
Satellite Imagery Analysis and Mapping
In 2009-2012, Elizabeth Stone carried out an extensive remote sensing project designed to map the layout of urban and rural sites representing five millennia of ancient Mesopotamian settlement history. This work used commercial satellite imagery and grew out of satellite imagery-based assessments of post-2003 looting patterns at southern Iraqi sites. These assessments, as well as previous fieldwork incorporating kite photos at the Old Babylonian (c. 1894-1595 BCE) city of Mashkan-shapir (Stone Reference Stone2012; Stone and Zimansky Reference Stone and Zimansky2004), led to the realization that images captured during times with elevated soil moisture—due to rainstorms or to irrigation-related raising of the water table—showed some sites’ ancient layouts. The images showed three different types of surface traces of ancient architecture: surface baked brick alignments; short-lived dark traces appearing after rainstorms; and longer-lived light traces in areas with a high, saline water table. The dark traces result from differential drying after a rain between the dense unbaked mudbrick walls and the less compact room fills and streets. The light traces result from slightly higher concentrations of salt above mudbrick walls as compared to less dense room fills. These light traces are visible for longer periods of time than the rainwater-related dark traces because they do not rely on the soil actively retaining its moisture (Stone Reference Stone2014: 181-182). In the areas sampled by the project, 97 sites, mostly dating to the third through first millennia BCE, had areas of architecture that were traceable in the imagery, significantly advancing archaeological knowledge of Mesopotamian settlement layout.
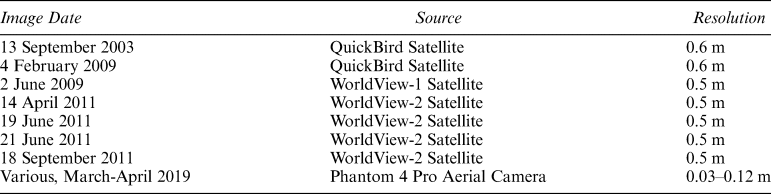
As part of this work, Stone discovered that extensive near-surface architectural traces were visible in imagery of Lagash purchased from the DigitalGlobe corporation, and she digitized visible walls and streets for a broader research project on inequality as measured through room size (Stone Reference Stone, Kohler and Smith2018) and a project on the spatial organization of early cities (Stone Reference Stone and Crawford2013). Seven submeter-resolution images were examined (Table 1). The georeferencing of these images was adjusted in order to facilitate comparison among them, and the images themselves were processed in order to improve the clarity of architectural traces using filtering methods described more fully elsewhere (Stone Reference Stone2014: 185).
Dates, sources, and resolutions of the satellite and aerial imagery sets used in this study.

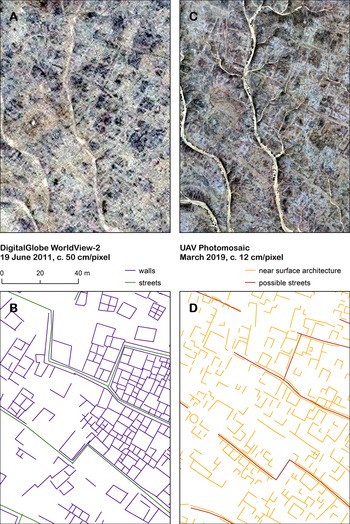
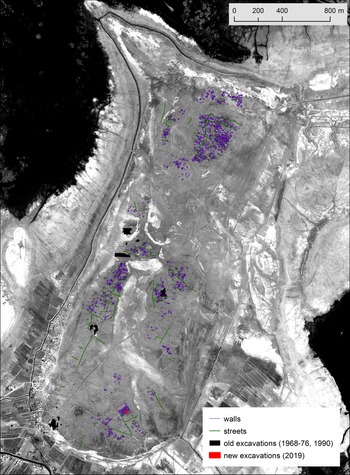
The Lagash mapping began with the image dated 13 September 2003, since this was the clearest of the available images. Other images were subsequently examined for additional details. The analysis of the imagery was accomplished using ESRI's ArcGIS. Pixel values were displayed using standard deviation histogram stretches and dynamic range adjustment in order to exaggerate contrast and better see visible features. Tracing used a method that squared off all four sides of rooms that were only partially visible; this was done in order to facilitate the project's broader aims of measuring the range of room sizes evidenced at Lagash and other sites (Stone Reference Stone, Kohler and Smith2018) (Figure 3a,b, Figure 4).
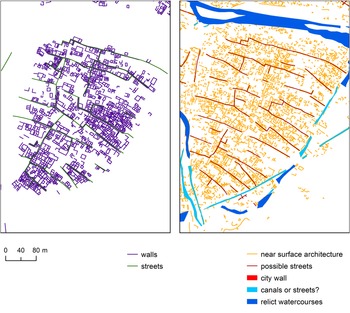
Comparison of the resolution of DigitalGlobe satellite imagery (a) and UAV photomosaics (c) and comparison of digital tracings resulting from each (b and d). The example here is located on the east side of the ‘north mound’ of the site. For image details, see Figures 4 and 5. For easier interpretation, see the online colour version.

Map of all walls and streets digitized from satellite imagery. Base image is a DigitalGlobe image captured 9 February 2004, displayed with a 1.5 standard deviation histogram stretch. For easier interpretation, see the online colour version.

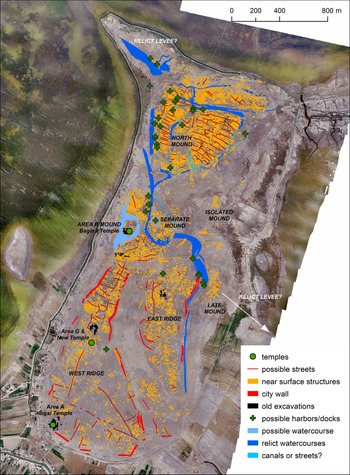
Map of all features and sediment interfaces digitized from a series of UAV imagery mosaics. Base image is a UAV photo mosaic captured 28 March and 8 April 2019, displayed with a 2.5 standard deviation histogram stretch. For easier interpretation, see the online colour version.

UAV Photogrammetry and Mapping
In March-April 2019, as part of the Lagash Archaeological Project's renewed survey and excavations led in the field by Augusta McMahon, Emily Hammer carried out a complete aerial mapping of Lagash using an UAV camera (drone). The DigitalGlobe imagery sets discussed above are among the highest resolution commercially available satellite photos, with a pixel size of 50-60 centimetres, but this resolution is not always sufficient for resolving the outlines of all buildings and rooms. Larger buildings and streets can appear clearly, but the wall widths of residential architecture in southern Mesopotamia average c. 60 centimetres and therefore lie at the limits of the available satellite imagery's resolution (Stone Reference Stone2014: 185). Higher resolution images produced by UAV mapping therefore can significantly improve archaeologists’ ability to map such smaller-scale architecture (for comparison, see Figure 3a, b versus c, d and Figures 4 versus 5). With UAV cameras, archaeologists also have greater flexibility to capture images precisely at times when soil moisture and surface salinity are ideal for revealing near-surface architectural traces and other ancient features.
The UAV aerial photos were captured using a DJI Phantom 4 Pro V2 Quadcopter over a period of six weeks in mid-March to late April 2019, when a number of rain storms occurred. From 24 March-2 April 2019, these rainstorms were unusually heavy, resulting in major flooding across the region. C. 31,000 photos cover c. 480 ha of the core part of the site with good surface visibility (areas that were sparsely vegetated, above the level of marsh water, and outside of modern inhabited and farmed zones). Several sets of photos captured at altitudes of 80, 90, 200, and 250 m show the site under variable soil moisture and lighting conditions, including times in the hours and days following rainstorms when soil moisture was highest. DroneDeploy flight planning software facilitated obtaining complete coverage of the site and ensured that photos would have sufficient overlap to be used for photogrammetry.
Each set of aerial photos was individually processed using the Agisoft Metashape program, producing orthomosaics with ground resolutions of c. 3–12 centimetres, depending on the altitude at which the photos were captured. Due to the high resolution of the photos and the large spatial extent of the site, these orthophotos exceeded the maximum file size for export from Metashape and therefore had to be exported in tiles. Following photogrammetric processing, the tiles were brought into ArcGIS for adjustment and analysis. To facilitate spatial comparisons, the georeferencing of each tile was fine-tuned with ground control points drawn from a single DigitalGlobe image. Each set of tiles was then re-combined in a mosaic dataset to enable the uniform application of histogram stretches.
The visual analysis of UAV photos began with the comparison of multiple mosaic datasets displayed using dynamic range standard deviation histogram stretches. These image stretches highlighted near-surface architecture (walls, streets) and sediment interfaces associated with other types of archaeological and hydrological features (rooms, ditches, watercourses). Structures and sediment interfaces were traced with vector lines and polygons to obtain a composite digital map of features visible based on multiple image mosaics. The tracing was accomplished systematically by a single analyst (Emily Hammer) through repeated inspection of each available image mosaic (3–5 total for most parts of the site) at each of three standard scales (1:300, 1:500, and 1:1000). The tracing method was performed in a minimally interpretive way, leaving the reconstruction of streets, buildings, and other features to a second stage.
The complete map of tracings from UAV photography (Figure 5) has been produced in a way to maximize rigor, but it is still in the end a product of qualitative analysis and is somewhat subjective. Many traced features and sediment interfaces are only faintly visible. Another analyst examining the UAV orthophoto mosaics using the same or different histogram stretches and at the same or different scales could potentially see a smaller or larger number of features considered worthy of tracing. This is always the case with the visual interpretation of remote sensing imagery. However, the resulting map is still a reliable proxy for the density and orientation of near-surface architecture across large parts of the site and a reliable indicator of many broader aspects of the ancient city structure and street pattern.
Walls, streets, rooms, ditches, and watercourses had different signatures in the UAV imagery. Walls are typically light-coloured linear features, and room interiors are marked by darker brown or reddish fills. Streets typically have a dark centre and lighter borders. It can be difficult to distinguish between streets, walls, and linear water features, but water features are often distinguished by channel scars and multiple overlapping sets of lines representing the shifting of water flow within a restricted area. Areas with architectural remains (and anthropogenic soils) are grey in colour, and formerly depressed areas are often infilled with lighter sediment.
These UAV imagery signatures are similar to, though not identical with, architectural traces seen in UAV imagery mosaics captured after rainstorms at the nearby Mesopotamian city of Ur (Hammer Reference Hammer2019), in kite photographs captured after rainstorms at the city of Mashkan-shapir (Stone and Zimansky Reference Stone and Zimansky2004), and in the DigitalGlobe satellite imagery interpreted by Stone, discussed above. Most notably, Lagash lacks the reddish surface baked brick alignments that are abundant at Ur (Hammer Reference Hammer2019) and less frequent at other southern Mesopotamian sites (Stone Reference Stone2014). This likely reflects the site's chronology: at Ur, substantial baked brick house foundations were common only in the Late Larsa and Old Babylonian periods of the mid-second millennium BCE (Stone and Zimansky Reference Stone and Zimansky2016: 255; Woolley and Mallowan Reference Woolley and Mallowan1976: 17-21), and as noted above the earlier survey of Lagash indicated that the city had largely contracted to a smaller area by this time (Carter Reference Carter1989-90; Goodman, Renette, and Carter Reference Goodman, Renette, Carter, Nadali, Pittman and Polcaroin press). In most periods, house walls in southern Mesopotamia were constructed of unbaked mudbrick, which under wet conditions may appear darker or lighter in colour than surrounding sediment, depending on moisture levels and soil salinity (Stone and Zimansky Reference Stone and Zimansky2004: 335). At Lagash under moist conditions, mudbrick walls mostly appear lighter in colour than surrounding sediments. The one place where reddish bricks are visible is in and around Area C, where the earlier excavations exposed a building destroyed by a conflagration hot enough to bake the bricks (Hansen Reference Hansen1992).
In addition, the light and dark architectural traces visible at Lagash tended to be longer-lived after a rainstorm than those seen at Ur, likely due to topographic and soil differences. At Ur, most architectural traces disappeared within four hours following short rainstorms in April 2017 (Hammer Reference Hammer2019); at Lagash, similar architectural traces following heavier rainstorms in March-April 2019 tended to be visible for several days. Particularly long-lived at Lagash were the dark traces marking the interior of rooms. These differences could be due to the amount of precipitation at the time photos were captured, the local soil chemistry and soil salt content, differences in the nature of room fill, and/or differences in site form. The central part of Ur is much more highly mounded than Lagash, represents a much longer period of inhabitation, and is located in what is today a dry area removed from the river floodplain and major irrigation systems. All these factors, as well as soil properties, could contribute to a situation in which soil moisture drains more quickly. Soil moisture is likely to drain much more slowly at Lagash given that the site is lower, less mounded, and today is located within seasonal marshlands that were actively expanding and contracting in April 2019 and within an actively irrigated agricultural area.
An important part of the imagery interpretation lies in distinguishing traces related to the ancient city from those that have resulted from modern use of the area, especially tire tracks resulting from vehicles traversing the topographically flatter parts of the site and compacted pathways resulting from animal herding. In fact, at a broad scale, one of the most highly visible features in the UAV imagery is a compacted surface marking the path of a large sheep and goat herd observed traversing the site daily during the 2019 fieldwork season. Careful visual analysis, comparison of multiple UAV imagery sets, and ground observations were necessary to avoid incorporating these modern features into the digital map of the ancient settlement. Particularly long linear features were heavily scrutinized and treated with suspicion, particularly if they cross-cut other (clearly archaeological) features and/or were aligned with modern paths and especially if they consisted of sets of parallel lines separated by a distance similar to the width of vehicle axles.
Results and Interpretation
The architectural traces and other features traceable from the satellite and UAV imagery show the extent of occupation at Lagash, its street pattern, and the watery setting and walled nature of some sectors of this occupation. Further, the form and characteristics of the largest intra-city watercourse allows for some new hypotheses about the regional hydrological situation in the State of Lagash. Finally, the results provide new spatial, architectural, and environmental context for the four previously excavated areas and the one newly excavated area, showing the placement of buildings, especially temples, within the city fabric.
Extent and Nature of Occupation
Both imagery datasets show dense architectural traces spread over an area of c. 300 hectares. In the satellite imagery, the visible traces are concentrated in a few discrete clusters cumulatively covering c. 82 hectares in the north (c. 35 ha), centre (c. 35 ha), and south (c. 12 ha) of the site (Figure 4). In the UAV imagery, dense traces cover c. 200 hectares and are concentrated in three large continuous clusters of c. 90 hectares (west ridge), 50 hectares (east ridge), and 56 hectares (north mound) as well as on five additional isolated mounds (4 hectares or less, located in the centre of the site) (Figure 5). In comparing the satellite imagery and UAV imagery results, it is apparent that the visible traces in the satellite imagery are mostly confined to the topographically highest, best-drained areas of the site. Many low-lying areas between these local topographic high points appeared empty of architectural traces in the satellite imagery, but are visibly carpeted in these traces in the higher resolution UAV imagery captured under ideal soil moisture conditions (Figure 6).
Close view of the east section of the ‘north mound’, showing how UAV photography reveals architectural traces in low-lying areas, traces that were not visible even in the clearest sections of the satellite imagery.

Remote sensing data cannot establish the date of all of these architectural traces, but the interlocking nature of much of the walls and streets suggests that the imagery largely shows a coherent plan of the city as it existed at particular moment(s) in time. Both the 1984 survey (Carter Reference Carter1989-90) and a new survey begun in 2019 (McMahon et al. Reference McMahon, Pittman, Al-Rawi, Ashby, Burge, Goodman, Hammer and Pizzimenti2023, forthcoming) established that the surface pottery overwhelmingly dates to the Early Dynastic III period. We thus argue that the majority of the architectural traces must also date to the Early Dynastic III. The 2019 and 2022 excavations in the southern part of the site thus far support this idea. Areas in the centre of the site, near the Bagara temple (Area B), and near the depression corresponding to a river course (see below) had surface pottery of the later third and early-mid second millennia BCE, as did limited areas at the northern tip of the site and near the Area C excavations. Further, limited areas at the northern tip of the site had a few sherds of the late second millennium BCE and areas on the east side of the central part of the site had scatters of much later pottery of the 9th and 10th centuries CE (Carter Reference Carter1989-90; Goodman, Renette, and Carter Reference Goodman, Renette, Carter, Nadali, Pittman and Polcaroin press), so the near-surface traces visible in some of these areas might mark architecture or modifications of later periods. As the site is far too large for excavations to ever cover a significant percentage of it, survey datasets are the best evidence archaeologists can hope to have concerning the dating of the visible architectural tracings.
Street Pattern
One area where the satellite imagery equals or even surpasses the UAV imagery is in its ability to reveal major street patterns. In this case the lower resolution of the satellite imagery filters out smaller details, helping the dark linear traces of these larger-scale features to appear clearly. The major streets typically traverse the centre of the mounded inhabitation areas, and secondary streets then connect these major thoroughfares to the mound edges. Narrower streets and alleyways, however, sometimes only appear in the UAV imagery. Excavations in Area H in 2022 suggest that the larger streets may be five meters wide or more, while smaller alleys are c. one meter wide. Two carts could easily pass each other at the same time in the wider streets, while a laden donkey would barely fit in the smaller alleys; this difference in scale and accessibility has relevance for the kinds of buildings and households we might expect to have been associated with each. In the west and east ridge (the southern portion of the site), the street pattern is irregular, with some curved streets. In the north mound, the street pattern is much more regular, with northwest-southeast oriented main streets placed at regular intervals and short, roughly orthogonally-oriented streets connecting them (Figure 6).
These variations in street patterns in different areas of the site may relate to temporal differences in sub-phases of occupation and city growth, or may reflect occupation by different types of households. The apparent rapid growth of the settlement within the Early Dynastic period implies that significant immigration took place, whether from hinterland villages or more distant regions (Algaze Reference Algaze2018), and the variable street patterns may reflect the different origins of associated inhabitants.
Bounding Features: City Wall and Watercourses
Dark and light-coloured wide linear features surrounding inhabitation areas in both the satellite imagery and the UAV imagery reflect the presence of city walls, sometimes paired with ditches or canals along their exterior faces. This interpretation has been verified (and clarified) with magnetic gradiometry data, which show segments of city walls in two different locations (McMahon et al. Reference McMahon, Pittman, Al-Rawi, Ashby, Burge, Goodman, Hammer and Pizzimenti2023, forthcoming; Hammer Reference Hammer2022). Analysis of the UAV imagery indicates that two large continuous, irregularly shaped areas of habitation in the southern half of the site—the “west ridge” and “east ridge”—were separately surrounded by two distinct city walls. The northern half of the site—the “north mound”—does not seem to be bounded by a city wall. As mentioned above, this distinction may relate to sub-phases of city occupation and growth or may reflect different types of households or varied origins of inhabitants. The broad linear features in this northern part of the site mostly crisscross the inhabited area and many appear to link to the city's river course (discussed below), indicating that they were canals rather than walls (Figure 6).
Hydrological Setting and the “Going-to-Nigin Canal”
The traces visible in both imagery sets confirm the earlier suggestion that a depression in the centre of the site corresponds to the location of a watercourse (Carter Reference Carter1989–90), and they show more specifically that Lagash straddled a sinuous river channel. This river entered the site at its northwest edge, where a “finger” of higher land extends today from the site northwest into the surrounding marsh. Elevation data from the Shuttle Radar Topography Mission show that this extension of higher land continues for at least a kilometre under the current marsh, and it may be the remains of the river's levee. The river exited the city in the middle of its eastern edge, where another “finger” of higher land extends today from the site eastward into the surrounding agricultural fields (this area was marsh until recently). The river's course narrows as it approaches the centre of the site and as it flows near to the Area B Bagara temple and other nearby settlement mounds. Architectural traces also directly abut the narrowed river course, suggesting that the watercourse may have been canalized in this area.
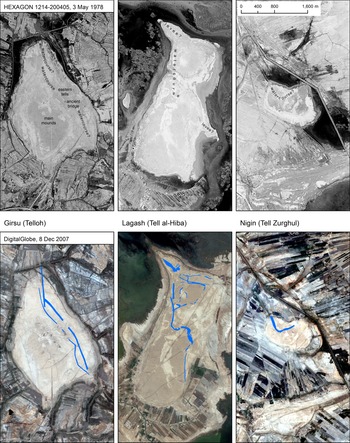
It seems likely that this river course could be the “Going-to-Nigin Canal” described in the Early Dynastic III, Gudea, and Ur III cuneiform textual sources. This canal connected Girsu, Lagash, Nigin, and a city named Gu'abba that has yet to be archaeologically located (Carroué Reference Carroué1986; Huh Reference Huh2008: 10-21; Schrakamp Reference Schrakamp and Berking2019: 134-136). The local orientation of river courses in general may not reflect their direction of flow on a regional scale. However, it is striking that the “fingers” of higher land marking the river's entrance into and exit from Lagash point directly towards Girsu (to the northwest) and Nigin (to the southeast). Examination of all three sites in declassified HEXAGON satellite imagery (for more on this imagery, see Hammer, FitzPatrick, and Ur Reference Hammer, Fitzpatrick and Ur2022) shows that a river course of roughly comparable width (c. 25–30 m) to the one at Lagash also appears to pass through occupied areas at Girsu and Nigin (Figure 7). Watercourses at Girsu have been mapped by the excavation team in CORONA and Bing Map imagery; the team identifies a narrower watercourse immediately to the west as the “Going-to-Nigin” canal (Rey and Lecompte Reference Rey, Lecompte, Lawrence, Altaweel and Philip2020: 216).
HEXAGON and DigitalGlobe satellite imagery of Girsu/Tello, Lagash/Tell al-Hiba, and Nigin/Tell Zurghul, showing the presence of an ancient river course of roughly comparable width at all three (c. 25–30 m), passing through or to the side of habitation areas. We suggest that these could be lengths of the textually-known “Going-to-Nigin Canal.” All images are displayed at the same scale. For more on the topography and layout of Girsu, see Rey and Lecompte Reference Rey, Lecompte, Lawrence, Altaweel and Philip2020; Rey Reference Rey2016. For discussion of the ancient environment of Nigin, see Nadali and Polcaro Reference Nadali and Polcaro2016; Nadali Reference Nadali and Jawad2021. For the Girsu image, only the narrower western watercourse (c. 10–15 m wide), passing through the area of the ancient bridge, has been traced by Rey and Lecompte. The linear feature traced to the east of this has a width comparable to the watercourses seen at Lagash and Nigin. It has been identified and studied from a geoarchaeological perspective in subsequent work at Girsu that thus far remains unpublished. For easier interpretation, see the online colour version.

If indeed this main city watercourse at Lagash was the “Going-to-Nigin Canal,” then the characteristics of it visible in the imagery, including its significant width, sinuosity, and probable levee, suggest that it may have been at least in part a natural watercourse (either an actively flowing channel or a reused former tributary) with canalized or otherwise modified segments. These features of the watercourse are far from conclusive on the question of a natural or artificial channel, however, as natural river channels vary in their sinuosity over time, and artificial channels may develop sinuous courses due to lack of maintenance or human abandonment (Wilkinson Reference Wilkinson2003: 84). Further, natural channels can be heavily modified or artificially supplied with water after a river abandons them, and artificial channels can develop levee-like crests from soil upcast during construction and cleaning episodes. A partly or largely natural origin for the “Going-to-Nigin Canal” does indeed make sense given that it must have stretched at least c. 50 kilometres (Rost Reference Rost, Selz and Wagensonner2011), a length that far exceeds those of artificially dug canals known from administrative records and mathematical texts (Wilkinson Reference Wilkinson and Crawford2013: 42–43). In the Early Dynastic and Ur III periods, archaeological and textual data suggest that irrigation systems were fairly small-scale and simple (Rost Reference Rost2017: 8–12, 16) and that artificial canals were largely short constructions confined to the slopes of river levees (Wilkinson, Rayne, and Jotheri Reference Wilkinson, Rayne and Jotheri2015).
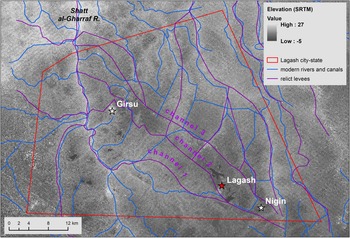
While the remains of the “Going-to-Nigin Canal” may be visible within and in the immediate vicinity of the Lagash state's three urban centres, finding direct traces of its path in the broader landscape is a considerably more challenging proposition. A broader regional study of relict levees in southern Mesopotamia on the basis of digital elevation models and satellite imagery analysis highlights the complexity of ancient hydrology in the Lagash region and the significant difficulties in reconstructing it due to sedimentation, alluviation, recent land use, and the modern course of the Shatt al-Gharraf River (Hritz Reference Hritz2010). A follow-up study suggests that two ancient water channels flowed near to Lagash, approaching the site from the northwest. While the dating of these channels awaits fieldwork, known sites along their courses date to the early third millennium BCE (Hritz Reference Hritz, Altaweel and Hritz2021; for another tracing of paleochannels in the vicinity, see also Jotheri and Allen Reference Jotheri, Allen, Lawrence, Altaweel and Philip2020: 303) (Figure 8). Perhaps the city's river was a natural or artificial branch of one of these channels, or perhaps the traces of this watercourse are no longer topographically visible away from ancient sites.
Complex hydrology of the Lagash city-state (as reconstructed by Hritz Reference Hritz, Altaweel and Hritz2021), including modern rivers and canals (data from DIVA-GIS), and relict levees showing the paths of ancient watercourses, including three former channels stretching from Girsu to Lagash that are lined with archaeological sites dating to the third millennium BCE (labeled following Hritz Reference Hritz, Altaweel and Hritz2021). Base imagery is elevation from the Shuttle Radar Topography Mission.

Spatial Contextualization of Previous and New Excavations
Based on both sets of imagery, buildings uncovered by the previous excavations (Areas A, B, C, G) and new excavations (Area H) can now be located among architectural traces and paleoenvironmental features that provide new information about their position within the broader built environment and hydrologic situation.
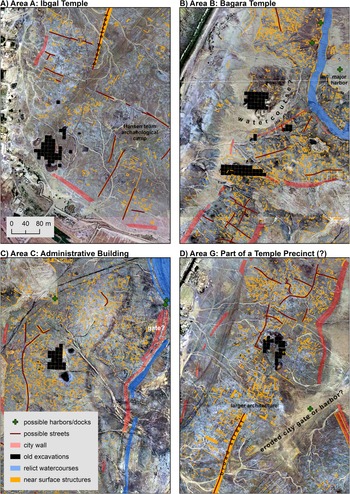
The Ibgal temple precinct in Area A appears to be located adjacent to where the city wall encircling the west ridge must have continued, though it is not visible, probably due to surface disturbance and erosion (Figure 9a). The spacing suggests that the temple's oval boundary wall might have been integrated into the city wall, or the city wall may have delineated the south and west sides of the precinct. It is notable that a c. 5–7 m wide linear feature preserved for c. 400 m, perhaps a street that is broader than the others visible in the imagery, appears to connect this southwest area of the site with a new possible temple area with larger architecture identified south of Area G, to the north (see below).
Spatial contextualization and re-interpretation of old excavation areas (A, B, C, G) on the basis of UAV imagery. Base image is a UAV photo mosaic captured 28 March and 8 April 2019, displayed with a 2.5 standard deviation histogram stretch. For easier interpretation, see the online colour version.

The Bagara temple in Area B sits on a high point that seems, from soil colour differences and surface observations, to be located on its own small mound (c. 100 m W-E, 150 m N-S), outside of the city wall bounding the west ridge (Figure 9b). This mound is encircled (and separated from adjacent settlement areas) by a c. 30 m-wide band of light-coloured sediment. This distinct feature/mark could be due to post-abandonment taphonomic processes, especially the infilling of low areas with sediment. If it is reflective of the environmental and settlement situation(s) during the use of the temple area (which continued through several periods from the third-second millennia BCE, so could have been variable) then it seems possible that the temple's mound was at some point delineated and bordered by a canal, ditch, or lagoon which was fed by the city's river. This would match a passage from cylinder A of Gudea, which states that the Bagara temple overlooked the “Going-to-Nigin Canal” (Carroué Reference Carroué1986)Footnote 1. Alternatively, as discussed above, this canal could refer to the city's river course, which flows not far from Area B.
It makes sense that later material was found in the excavations in Area B and also in the central parts of the site during the survey. After the large-scale shift in population and abandonment of large parts of the site at the end of the Early Dynastic III period, the settled area in the late third and second millennium BCE must have contracted to the areas adjacent to the city watercourse and its most important temple. The UAV imagery shows that some of the architectural traces in these areas occur on individual mounds.
Area C is positioned within the centre of the walled east ridge where nearby building traces seem to have a similar orientation to the excavated architecture (Figure 9c). The excavated burned building is located almost directly west of the area where an east-facing city gate may have been located. This administrative area, like the whole east ridge, is separated from the western ridge by an elongated, curved empty area that could contain a buried watercourse.
Area G is positioned within the centre of the walled west ridge, north of an extensive area with larger architecture, characterized by thicker walls and larger enclosed spaces than elsewhere on the site (Figure 9d). The excavated trenches are c. 200 m north of traces that appear to mark the presence of a temple or other large structure. To the north of the trenches, a curved linear feature appears to show a street whose path roughly parallels that of the excavated curved outer wall of the Area G complex. Roughly 120 m southeast of the Area G excavation spoil heap is an elongated depression filled with lighter colour sediment which stretches northeast-southwest alongside the newly mapped area with larger architecture. It remains unclear whether this depression is an archaeological feature (harbour? city gate?) or whether it is a feature resulting from taphonomic processes that may also have caused the adjacent break in the city wall.
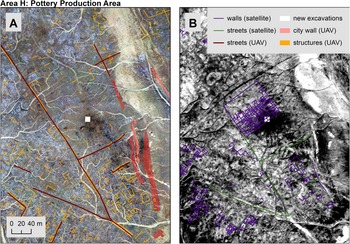
Area H is positioned in the southeast extension of the walled west ridge, in an area where major streets are clearly visible in the satellite and UAV imagery (Figure 10). The excavated kilns are located in an area removed from these major streets but near to what appears in magnetic gradiometry data to be a narrow alley with some minor bends (McMahon et al. Reference McMahon, Pittman, Al-Rawi, Ashby, Burge, Goodman, Hammer and Pizzimenti2023, forthcoming; Hammer Reference Hammer2022). The coloration of the UAV photos and anomalies in the magnetic gradiometry data indicate that a number of other kilns are present in this area; this conclusion is also supported by the 1984 and 2019 surveys and the dense surface cover of slag, wasters and ash. Excavations in 2019 and 2022 indicate that the kilns were cut into earlier architecture but also that both the kilns and architecture date to the mid-Early Dynastic Period. Elizabeth Stone reconstructed a large building in this area on the basis of her satellite imagery analysis (Figure 10b); this structure was not found in the 2019 excavations but may lie below the kilns. However, it does not appear in the UAV imagery (Figure 10a) or in magnetic gradiometry data (Hammer Reference Hammer2022). A comparison of these datasets suggests that the thicker linear features traced by Stone as walls are instead alleys or streets.
Spatial contextualization of the new 2019 excavation area (H) on the basis of UAV imagery (a) and satellite imagery (b). For easier interpretation, see the online colour version.

The contextualization of the excavation areas allows for the evaluation of earlier ideas about the overall structure of the site. The director of the 1968-1990 excavations believed that the western portion of Lagash had been a divine precinct that was separated by a canal from a non-religious district to the east (Hansen Reference Hansen1992: 211). The director of the earlier survey believed that the central portion of site extended to the west from Area B; this area could not be studied because it lay under the 1980s (and modern) marsh (Carter Reference Carter1989–90: 62). The modern imagery results are consistent with Hansen's earlier impressions: the area between the bounded west and east ridges is indeed empty of architecture and has an elongated, curved shape as if it had been the location of a former watercourse, traces of which are now buried. Conversely, the boundedness of the western edge of the west ridge and the water feature around the area B mound suggest that Carter's hypothesis was incorrect. However, the existence of a western island with archaeological material within the marsh (also noted by Carter and discussed further below) does suggest that outlying inhabited areas could lie under the modern marsh.
Discussion
The most interesting and unique aspect of Lagash as revealed through these image sets is the discontinuous nature of its urban layout. The long distances and empty spaces between the architecture visible in the satellite imagery led Stone (Reference Stone, Renette and Pittman2023, in press) to interpret Lagash as an “archipelago” of around thirty-three islands rather than a single compact city. The UAV imagery allows us to adjust this picture, indicating that Lagash had a layout that was discontinuous but not overly fragmented. Most of the settled area fell within the three main city sectors mentioned above. These city sectors appear to have been bounded by walls and/or watercourses and separated by some empty or open spaces. Nonetheless, these city sectors may have originated as marsh islands.
The large number of intra-settlement watercourses suggest that Early Dynastic Lagash existed within a landscape fragmented by water. The city, especially in the north mound, seems to have been significantly more watery than other third and second millennium BCE southern Mesopotamian cities, crossed by an impressive number of watercourses or canals. Other known city layouts often only incorporate one or two internal canals, and these canals often had a straight, artificial form, at least in their final phases, for example at Mashkan-shapir (Stone Reference Stone2012; Stone and Zimansky Reference Stone and Zimansky2004), Ur (Hammer Reference Hammer2019), Nippur (Gibson Reference Gibson1993) and Larsa (Darras and Vallet Reference Darras and Vallet2021). Lagash instead has a multitude of sinuous water features, and parts of the city sector walls are concave, as if they were constructed to follow the path of existing watercourses.Footnote 2
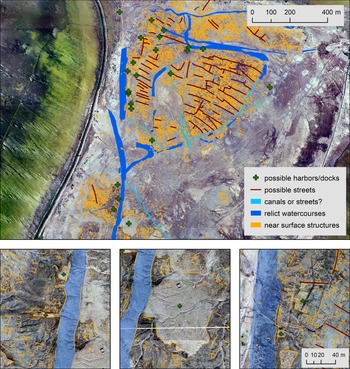
In such a watery environment, transportation by boat must have been important. Indeed, the UAV imagery provides evidence for this in the form of rectilinear constructions built into watercourses that resemble docks or boat slips (Figure 11). Larger depressions visible both in the satellite and UAV imagery perhaps represent the locations of harbours. Some of these dock/boat slip and harbour features, including the largest of the harbour features, are oriented towards the centre of inhabited areas, and this positioning is suggestive of a function related to intra-settlement (rather than inter-city) movement.
Map of some possible dock/boatslip/harbour features built into or beside watercourses in the north mound of Lagash, with close up maps of three example areas. Base image is a UAV photo mosaic captured 28 March and 8 April 2019, displayed with a 2.5 standard deviation histogram stretch. For easier interpretation, see the online colour version.

The architectural traces suggest that the often-quoted size of 500-600 hectares may significantly overestimate the extent of Early Dynastic Lagash's densely-inhabited, partially walled urban core. This is not to say that the city did not cover 500-600 hectares (or an even larger area), as possible extramural settlement areas have yet to be investigated. Any extramural settlement areas might not appear clearly in satellite and aerial imagery for a variety of reasons: they are likely to have been topographically lower than the mounded core of the site and therefore to have been comparatively more affected by taphonomic processes that can erase or bury near-surface architecture traces. In addition, extramural settlement areas might have had architecture constructed from more ephemeral materials such as reeds, which would not appear clearly, unlike the mudbrick walls that are traceable in the core of the site. There is some indirect evidence of this: during 2019, an area c. 850 m to the west of area B that today is an island within the marsh was surveyed. This island, c. 150 m east-west by c. 350 m north-south at the time of survey, had Early Dynastic III pottery on its surface, but the UAV survey revealed no clear architectural traces. Only further surface survey, geophysics, and excavation will be able to verify or reject the 500-600-hectare figure, which seems mostly to have been drawn from measurements of the elevated “turtleback” (Pournelle Reference Pournelle2003: 207) on which Lagash is located.
Nevertheless, the visible architecture in the drone imagery confirms that Lagash was a very large, dense city in the Early Dynastic period. Lagash's large size is not merely a function of “atomized” city sectors and the presence of empty spaces (contra Goodman, Renette, and Carter Reference Goodman, Renette, Carter, Nadali, Pittman and Polcaroin press: 3, fn. 29, 9-10); the 200 ha of visible, compact architecture at Lagash exceeds the estimated size of most contemporaneous southern Mesopotamian cities. In the Early Dynastic III period, Girsu's dense architectural core seems to have covered c. 130 ha, without including any potential suburbs (Rey and Lecompte Reference Rey, Lecompte, Lawrence, Altaweel and Philip2020: 215-216; Rey Reference Rey2016: 19–20). Larger size estimates of up to c. 430 hectares (Ur Reference Ur, Altaweel and Hritz2021: 233), similar to the situation at Lagash, measure the extent of the elevated “turtleback” (Pournelle Reference Pournelle2003: 179) on which Girsu sits, which is far more extensive than the complex of archaeological mounds (Rey Reference Rey2016: 17–18). Lagash's nearby rival city, Umma, covered a maximum of 175–200 ha, but soil discoloration around the site cumulatively covers 262 hectares (Ur Reference Ur2014: 328). The more distant Early Dynastic III centres of Shuruppak (Fara) and Kish covered 100 and 130 hectares, respectively (Gibson Reference Gibson1972; Martin Reference Martin1983; Ur Reference Ur and Crawford2013: 140-141; Ur Reference Ur, Altaweel and Hritz2021: 231).
Lagash and Uruk both stand out among late Early Dynastic cities for their significantly larger size, but these two cities also appear different in their form. The reconstructed length of the Lagash walls (5 kilometres surrounding the west ridge and 3.4 kilometres surrounding the east ridge, thus c. 8.4 km total) is comparable to the Early Dynastic city wall at Uruk (9.5 km circumference (Nissen Reference Nissen, Ucko, Tringham and Dimbleby1972)). However, the 3.5-kilometer distance from Lagash's northern to southern extremities is close to 50% greater than the distance between opposite ends of Uruk. Lagash is more linear and less geometrically compact in its form than other southern Mesopotamian cities, including Uruk. These differences might relate to the pre-settlement topography of the sites: the shape and size of the natural high points on which the sites may have been originally founded. Alternatively, these differences could relate to hydrology and other environmental and social factors at play during the sites’ inhabitation histories.
Conclusions
Analysis of high-resolution satellite and UAV imagery of Lagash shows over 200 hectares of architecture spread over an area of c. 300 hectares, the latter figure incorporating some apparently empty areas. Much of this architecture likely dates to the third millennium BCE Early Dynastic III period, when many southern Mesopotamian cities greatly expanded in size. The spatial distribution of this architecture shows that Early Dynastic III Lagash had a discontinuous city layout. This characteristic of the city was noted in earlier commercial satellite imagery analysis. Recent analysis with much higher resolution UAV imagery captured under ideal soil moisture conditions largely supports some of the reconstructions made on the basis of satellite imagery, but shows that the city's discontinuous layout was not nearly as fragmented as it had first appeared. Many areas of the site that had appeared empty of architectural traces, especially topographically low-lying areas, are carpeted in these traces in the UAV imagery. The architectural traces in the UAV imagery are frequently bound by city walls and ditches or watercourses, details indicating that this higher-resolution dataset allows for the reconstruction of the extent and form of the Early Dynastic III city.
The results indicate that archaeologists must be careful in their assessments of site size and layout on the basis of satellite imagery alone. Satellite imagery captured under the right surface conditions can reveal important general aspects of southern Mesopotamian city extent and form, but areas of apparent architectural absence can be usefully re-assessed with UAV imagery captured during times of good surface conditions. Both types of imagery are ideally also supplemented by geophysics, surface survey, and targeted excavation. Our analysis of the urban layout of Lagash also shows that the archaeological tendency to reconstruct a single continuous inhabitation area for many settlements risks inflating site size estimates and thus past population estimates.
The satellite and UAV imagery also show watercourses running through the settlement layout, suggesting that the city grew within a watery environment and supporting textual information indicating that Lagash was located in proximity to both wetlands and agricultural areas. We argue that the discontinuous nature of the city plan is reflective of this watery and perhaps marshy environment. Intra-settlement boat travel must have been important for integrating Lagash's spatially disparate neighbourhoods and a population that must have numbered in the tens of thousands.
Acknowledgements
EH and AM thank the State Board of Antiquities and Heritage of Iraq for enabling fieldwork, especially the Lagash 2019 representatives, Ahmed Kadem, Haider Shneiwer, and Saad Ali. The National Geographic Society (Grant # NGS-386R-18) and the Price Lab for the Digital Humanities at the University of Pennsylvania generously funded the 2019 survey work. The Metropolitan Museum of Art, the Penn Museum, the British Institute for the Study of Iraq and the Reckitt Trust funded excavation work. EH and AM thank all of the members of the Lagash Archaeological Project, especially Holly Pittman (director and permit holder), Zaid Alrawi (coordinator), and Sara Pizzimenti (ceramicist). EH thanks Ahmed Kadem and Haider Shneiwer for their repeated willingness to drive and trudge through deep mud for the collection of UAV photos after rainstorms. The late Abdulamir al-Hamdani (formerly Minister of Culture of Iraq) provided invaluable encouragement and other logistical assistance in the field. He is greatly missed. EH also thanks Stephanie Rost for informative conversations about third millennium BCE irrigation in the state of Lagash. ES acknowledges the support of the US National Science Foundation, grant BCS 0936581.