INTRODUCTION
Oilseed rape, the second largest oilseed crop produced worldwide, not only furnishes edible oil for human consumption but also is a promising biodiesel crop. Over the past 40 years, world rapeseed production has increased threefold, and the average rapeseed yield has also increased by 3·4% per year (Rondanini et al. Reference Rondanini, Gomez, Agosti and Miralles2012). The demand for rapeseed will continue to increase in the coming decades as a result of increased food and energy needs associated with the expansion of the global population. Reliance on use of mineral fertilizer has made an unquestionable contribution to support high oilseed rape production (Ozer Reference Ozer2003; Rathke et al. Reference Rathke, Christen and Diepenbrock2005; Zou et al. Reference Zou, Lu, Chen and Li2009). The fertilizer industry is developing rapidly, but fertilizer management approaches remain imperfect, resulting in low nutrient use efficiencies and consequent environmental hazards (Ju et al. Reference Ju, Kou, Zhang and Christie2006; Guo et al. Reference Guo, Liu, Zhang, Shen, Han, Zhang, Christie, Goulding, Vitousek and Zhang2010). In addition, insufficient fertilizer inputs are common in some parts of the developing world, such as Africa and low-income countries in Asia (Hossain & Singh Reference Hossain and Singh2000; Vitousek et al. Reference Vitousek, Naylor, Crews, David, Drinkwater, Holland, Johnes, Katzenberger, Martinelli, Matson, Nziguheba, Ojima, Palm, Robertson, Sanchez, Townsend and Zhang2009) and for certain crops (such as oil crops) in China (Ren et al. Reference Ren, Lu, Li, Zou, Xu, Liu and Li2013). Matching fertilizer inputs to crop requirements is a key component of integrated nutrient management, which is crucial to achieving high yields together with high resource use efficiencies and minimal environmental impacts (Chen et al. Reference Chen, Cui, Vitousek, Cassman, Matson, Bai, Meng, Hou, Yue, Romheld and Zhang2011; Zhang et al. Reference Zhang, Cui, Fan, Zhang, Chen and Jiang2011). Thus, understanding the crop nutrient requirements and yield–uptake relations of oilseed rape is important for integrated nutrient management to improve rapeseed yield and achieve sustainable development of oilseed rape production.
The nutrient requirements of oilseed rape are substantial (200–300 kg nitrogen (N)/ha, 39–57 kg phosphorus (P)/ha and 292–375 kg potassium (K)/ha) and higher than those of cereal crops (Orlovius Reference Orlovius2003; Brennan & Bolland Reference Brennan and Bolland2009). Many studies on the crop nutrient requirements of field and potted oilseed rape have been presented (Barraclough Reference Barraclough1989; Taylor et al. Reference Taylor, Smith and Wilson1991; Fismes et al. Reference Fismes, Vong, Guckert and Frossard2000; Orlovius Reference Orlovius2003; Brennan & Bolland Reference Brennan and Bolland2009). High variability in the crop nutrient requirements with respect to soil, cultivar, climate conditions, fertilizer inputs, yield level and crop management practices have also been detected (Berry et al. Reference Berry, Spink, Foulkes and White2010; Schulte auf‘m Erley et al. Reference Schulte Auf‘m Erley, Behrens, Ulas, Wiesler and Horst2011; Kessel et al. Reference Kessel, Schierholt and Becker2012). The interactions among N, P and K fertilizer were always significant for rapeseed yields (Brennan & Bolland Reference Brennan and Bolland2007a , Reference Brennan and Bolland b ), however, crop nutrient requirements have been neglected in these trials. In addition, crop nutrient requirements are not always linearly related to seed yield (Taylor et al. Reference Taylor, Smith and Wilson1991). Thus, the results of potted or field trials conducted at relatively few locations with specific soil and environment conditions and agronomic practices may not produce accurate estimation of the crop nutrient uptake of modern high-yielding varieties. Few studies have endeavoured to demonstrate the nutrient uptake–yield relationship of oilseed rape over a wide range of environmental conditions.
The Quantitative Evaluation of the Fertility of Tropical Soil (QUEFTS) model (Janssen et al. Reference Janssen, Guiking, Van Der Eijk, Smaling, Wolf and Van Reuler1990), modified by Witt et al. (Reference Witt, Dobermann, Abdulrachman, Gines, Wang, Nagarajan, Satawatananont, Son, Tan, Tiem, Simbahan and Olk1999), provides an approach to estimating crop nutrient requirements for a target yield level while accounting for the interactions among macronutrients that affect plants’ internal efficiencies. In the model, two linear borderlines are utilized to define the range between maximum nutrient accumulation and maximum nutrient dilution in the plant. These envelopes are arithmetically integrated with linear–parabolic–plateau curves to predict the relationship between grain yield and crop nutrient uptake and to estimate balanced nutrient requirements. The QUEFTS approach has been employed to estimate crop nutrient requirements in studies on rice, maize and wheat (Witt et al. Reference Witt, Dobermann, Abdulrachman, Gines, Wang, Nagarajan, Satawatananont, Son, Tan, Tiem, Simbahan and Olk1999; Liu et al. Reference Liu, Yu, Liu and Konijn2006; Tabi et al. Reference Tabi, Diels, Ogunkunle, Iwuafor, Vanlauwe and Sanginga2008; Setiyono et al. Reference Setiyono, Walters, Cassman, Witt and Dobermann2010; Zhang et al. Reference Zhang, Hou, Gao, Chen, Zhang and Cui2012). The present study relied on a large database of seed yield and nutrient uptake levels for winter oilseed rape for various fertilizer management practices in on-farm experiments around the Yangtze River Basin, where 0·91 of all of China's oilseed rape is produced. A wide seed yield range is covered in the database, so it can therefore be used to examine the relationship between nutrient uptake and seed yield for winter oilseed rape. The objectives of the present study were to: (1) investigate the relationship between seed yield and shoot nutrient accumulation of winter oilseed rape and determine the standardized coefficients of the QUEFTS model for winter oilseed rape and (2) quantify the oilseed rape nutrient requirements for a specific target yield using the QUEFTS model.
MATERIALS AND METHODS
Data source
The database used for the present study included a total of 1035 on-farm observations of seed yield, straw yield and nutrient concentrations for winter oilseed rape, collected from numerous studies conducted around the Yangtze River Basin between 2005 and 2010 (Zou Reference Zou2010; Wang Reference Wang2014). In these regions, rainfed oilseed rape is usually transplanted to diminish the crop main-field duration and permit multiple cropping systems with limited crop land availability. Transplanting can also reduce the negative impacts on seedlings of abrupt temperature changes in winter and can help to achieve high yields. Normally, farmers sow oilseed rape seeds in nursery beds in the middle of September and then transplant seedlings when they are 30–40 days old and have 4–5 leaves. The seedlings are transplanted in the field by hand at a density of c. 105 000 plants/ha. The plants usually flower in the middle of March the following year and are harvested in early May. At all sites, local commercially available ‘double-low’ rapeseed cultivars of Brassica napus L. (i.e. with low glucosinolate and erucic acid contents), including the Huashuang (HS), Huayouza (HYZ), Zhongshuang (ZS) and Zhongyouza (ZYZ) varieties, are widely cultivated and seed yields vary from 0·96 to 2·44 t/ha and average 1·75 t/ha.
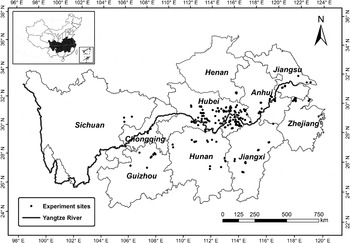
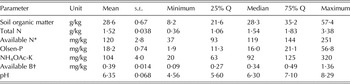
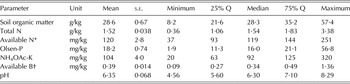
Data were collected from on-farm experiments conducted at 213 sites over the course of 6 years. The sites were located throughout Sichuan, Chongqing, Guizhou, Hubei, Hunan, Henan, Anhui, Jiangxi, Jiangsu and Zhejiang Provinces around the Yangtze River Basin (Fig. 1). These experimental sites represent a wide range of environments and soil types across the dominant winter oilseed rape production region of the Yangtze River Basin (Table 1). The experiments encompassed various fertilizer treatments to evaluate a wide range of nutrient accumulation and dilution conditions for winter oilseed rape. The treatments were: (1) OPT: the optimal fertilizer application rates for winter oilseed rape are 180 kg N/ha, 90 kg P2O5/ha and 120 kg K2O/ha, according to ‘Fertilizer Recommendations for Major Crops in China’ (Zhang et al. Reference Zhang, Chen and Chen2009). Compared with the farmers’ fertilization practices (FFP), the recommended fertilization rates improved the seed yield significantly, by 29·1% on average, and could be used as the regional mean optimal fertilization rates for winter oilseed rape in the Yangtze River Basin (Zou Reference Zou2010). (2) 0-N: only P (90 kg P2O5/ha) and K (120 kg K2O/ha) were applied in this treatment, to ensure that nutrients other than N did not limit plant growth and seed yield. (3) 0-P: only N (180 kg N/ha) and K (120 kg K2O/ha) were applied. (4) 0-K: only N (180 kg N/ha) and P (90 kg P2O5/ha) were applied. (5) FFP: the farmers’ fertilizer application rates were based on responses from a survey of 30 farmers at each site. The FFP rates between 2005 and 2010 ranged from 80 to 365, 9 to 126 and 0 to 94 kg/ha of N, P2O5 and K2O, with averages of 162 kg N/ha, 50 kg P2O5/ha and 49 kg K2O /ha, respectively. The results were similar to a survey conducted by H. L. Xu (personal communication). (6) CK: no fertilization.
Distribution of experimental sites around Yangtze River Basin.

Soil properties of the experimental sites around the Yangtze River Basin in China
* Available N is alkaline-hydrolysable N
† Available B is hot water B
At each experimental site, at least two treatments mentioned above were configured according to a completely randomized block design with three replicates. For all of the treatments described above, all P fertilizers and 0·60 of the N and K fertilizers were applied to the fields as a base fertilizer 2 days before transplanting. The remaining N and K fertilizers were top-dressed during the over-wintering period (growth stage (GS) 29; BBCH 1997) (0·20) and at the initiation of stem elongation (GS 30) (0·20), respectively. The N, P, K and boron (B) fertilizers applied in the experiments were urea (46% N), superphosphate (12% P2O5), potassium chloride (60% K2O) and borax (11% B), respectively. Farmers followed common methods of herbicide application, and pest and disease control for all plots.
The same plant sampling protocol was followed at all experimental sites. All of the plants in each 20-m2 experimental plot were harvested by hand to estimate the seed yields. The seeds were cleaned by hand, oven-dried at 60 °C until a constant weight was reached, and weighed. Eight oilseed rape plants were collected at harvest for the measurement of above-ground dry matter (DM), harvest index (HI) and the nutrient concentrations in the plant tissues, including stem, pod wall and seed. Straw yields were estimated based on the oven-dried seed yields of the plots and the HI of an eight-plant sample. Plant samples were digested with sulphuric acid (H2SO4) and hydrogen peroxide (H2O2) following the method of Thomas et al. (Reference Thomas, Sheard and Moyer1967), after which they were analysed for N and P concentrations using a flow injection analyser (FIAstar 5000, FOSS, Hillerod, Denmark). Potassium concentrations were analysed using a flame photometer. Nutrient uptake was calculated as the product of the above-ground DM contents and the total nutrient concentrations in the different plant parts.
Model development
The QUEFTS model, modified by Witt et al. (Reference Witt, Dobermann, Abdulrachman, Gines, Wang, Nagarajan, Satawatananont, Son, Tan, Tiem, Simbahan and Olk1999), was used to estimate relationships between crop yield and shoot nutrient uptake following five steps: (1) estimate the plant available soil nutrient supplies of N, P and K according to soil tests or from nutrient accumulation in nutrient omission plots. Here nutrient uptake measured in the nutrient omission plots (plots without fertilizer application of one of the key macronutrients) was used to assess the plant-available soil nutrient supplies (Wang et al. Reference Wang, Dobermann, Witt, Sun and Fu2001); (2) calculate the actual nutrient uptake depending on the potential nutrient supplies, i.e., the plant-available soil nutrient supply in Step 1 plus the effective nutrient supply from fertilizer. Here the basic assumption is that the relationship between the actual nutrient uptake and the potential nutrient supplies is parabolic. The actual nutrient uptake will not increase at high potential nutrient supply level, where it may be limited by other nutrients. Thus the actual nutrient uptake here is calculated as a function of the potential supplies of the other two nutrients. The minimum value of each pair of results is considered as the final actual nutrient uptake; (3) attain the yield ranges of each nutrient from the actual nutrient uptakes estimated in Step 2 at the maximum accumulation (where the nutrient is not limiting) and maximum dilution condition(where the nutrient is yield limiting); (4) estimate the yield for each possible pair of nutrients using the yield ranges defined in Step 3, then obtain the actual yield from the mean of these six yield estimates; (5) simulate curves of optimum nutrient requirement of N, P and K using a linear–parabolic–plateau curve at the different maximum yield levels. Based on the previous studies (Witt et al. Reference Witt, Dobermann, Abdulrachman, Gines, Wang, Nagarajan, Satawatananont, Son, Tan, Tiem, Simbahan and Olk1999; Setiyono et al. Reference Setiyono, Walters, Cassman, Witt and Dobermann2010), a spreadsheet version of the QUEFTS model (using Microsoft Excel 2003 for solver module) was used to calculate the optimal nutrient uptake at the different yield potentials. More detailed information about the QUEFTS model can be found in Janssen et al. (Reference Janssen, Guiking, Van Der Eijk, Smaling, Wolf and Van Reuler1990) and Witt et al. (Reference Witt, Dobermann, Abdulrachman, Gines, Wang, Nagarajan, Satawatananont, Son, Tan, Tiem, Simbahan and Olk1999).
Critical definitions and calculations
Internal efficiency (IE) of N, P and K represent kg seed yield produced per kg N, P and K taken up by crop; reciprocal internal efficiency (RIE) of N, P and K are the crop N, P and K uptake per 1000 kg seed. They are estimated as follows:
 $${\rm IE}_{{\rm N/P/K}} = \displaystyle{{Y_{{\rm trt}}} \over {N_{{\rm trt}}}} $$
 $${\rm RIE}_{{\rm N/P/K}} = \displaystyle{{N_{{\rm trt}}} \over {Y_{{\rm trt}}}} \times 1000$$
where N trt is nutrient uptake of the treatment and Y trt is seed yield of the treatment. The IE, RIE, N trt, and Y trt are expressed in kg/kg, kg/kg, kg/ha and kg/ha, respectively.
Fertilizer recovery efficiency (RE) is estimated as follows:
 $${\rm RE}_{{\rm N/P/K}} = \displaystyle{{N_{{\rm OPT}} - N_0} \over {F_{{\rm OPT}}}} \times 100$$
where N OPT is nutrient uptake of shoots in the OPT treatment; N0 is nutrient uptake by shoots in the 0-N, 0-P and 0-K treatments, respectively and FOPT is mineral fertilizer application rate of the OPT treatment; RE, N and F are expressed in %, kg/ha and kg/ha, respectively.
The value of maximum accumulation (a) of nutrient in the plants represents the maximum accumulation situation of this nutrient when the nutrient supply is sufficient; it is equivalent to the minimum internal efficiency. The value of maximum dilution (d) is the maximum dilution situation of this nutrient where the nutrient is yield limiting and it is equivalent to the maximum internal efficiency. Based on previous studies (Witt et al. Reference Witt, Dobermann, Abdulrachman, Gines, Wang, Nagarajan, Satawatananont, Son, Tan, Tiem, Simbahan and Olk1999; Zhang et al. Reference Zhang, Hou, Gao, Chen, Zhang and Cui2012), the values of a and d of nutrients in the plants are usually defined as the 2·5th and 97·5th percentiles of the calculated internal efficiencies of a nutrient.
The average seed yield of winter oilseed rape in China in 2011 was 1827 kg/ha, varying from 150 to 2645 kg/ha (National Bureau of Statistics of China 2012); in the current observations the highest yield was 4732 kg/ha. Thus the maximum seed yield was set as 5000 kg/ha. Other potential yield levels, including 2000, 3000 and 4000 kg/ha were also set to predict balanced nutrient requirement for N, P and K.
Model validation
The data source comprised 170 sites where four treatments (NPK, 0-N, 0-P and 0-K) were included. Depending on the five steps mentioned above, crop nutrient uptake at these 170 sites was predicted with the QUEFTS model. The plant-available soil nutrient supplies of each field were measured according to the nutrient omission plots and the potential yield was set depending on the record of high yields at each site. For the rest of the critical parameters, such as fertilizer recovery efficiencies, internal efficiencies and the boundary lines of a and d, average values for winter oilseed rape were adopted. Then the performance of the QUEFTS model was evaluated through comparisons between predicted and observed values for each specific condition. The root mean square error (RMSE), normalized RMSE (n-RMSE) and index of agreement (IOA), calculated from the following equations, were used to evaluate the performance of the model:
 $${\rm RMSE} = \sqrt {\displaystyle{{\sum\nolimits_{i = 1}^n {(P_i - O_i ){}^2}} \over n}} $$
 $${\rm Normalized}{\rm RMSE} = \displaystyle{{{\rm RMSE}} \over {\bar O}}$$
 $${\rm IOA} = 1 - \displaystyle{{\sum\nolimits_{i = 1}^n {(P_i - O_i )^2}} \over {\sum\nolimits_{i = 1}^n {[\left\vert {(P_i - \bar O)} \right\vert + \left\vert {O_i - \bar O} \right\vert]^2}}} $$
where P i is a predicted value, O i is an observed value, n is the number of data points and Ō is the mean of the observed values. The RMSE is usually used to assess the mean deviation between simulated and observed values for the same unit. The n-RMSE eliminates the unit and can be used for comparison among values with different units. The IOA is a non-dimensional index in the range (0, 1) used for comparisons between simulated value and observed values (Tabi et al. Reference Tabi, Diels, Ogunkunle, Iwuafor, Vanlauwe and Sanginga2008). If the IOA is <0·50, then the model's performance is considered to be poor.
RESULTS
Seed yield and nutrient uptake
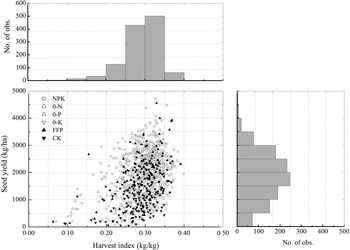
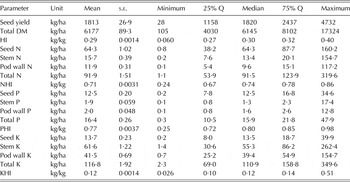
Across all 1035 on-farm observations, the average seed yield was 1841 kg/ha (Table 2). The high variability in seed yield (which ranged from 28 to 4732 kg/ha) reflected the wide range of environment, soil type and farmers’ crop management practices, including imbalanced fertilization, in the Yangtze River Basin. The average seed yield was 2425 kg/ha (range 444–4732 kg/ha), 1298 kg/ha (range 28–3062 kg/ha), 1813 kg/ha (range 130–3827 kg/ha), 2102 kg/ha (range 310–4087 kg/ha), 1955 kg/ha (range 142–4557 kg/ha) and 1005 kg/ha (range 50–2562 kg/ha) for the OPT, 0-N, 0-P, 0-K, FFP and CK treatment, respectively. Lower rapeseed yields were consistently observed in the CK and nutrient omission plots. The total above-ground DM ranged from 105 to 17 324 kg/ha, with an average of 6177 kg/ha. The average HI was 0·29 kg/kg, varying from 0·06 to 0·40 kg/kg. Most of the HI values varied from 0·20 to 0·40; however, 0·048 of the observations had HI values below 0·20 and corresponding yields of <1000 kg/ha (Fig. 2).
The relationship between harvest index and seed yield for winter oilseed rape. The data were obtained from farmers’ field experiments conducted in the Yangtze River Basin between 2005 and 2010 (n = 1035).

Seed yield, total above-ground plant DM; HI; plant N, P and K accumulation in seeds, stems, pod walls and above-ground plant DM; and nutrient HI (kg nutrient in seeds per kg nutrient in above-ground plant DM) at maturity of winter oilseed rape in the Yangtze River Basin in China (n = 1035) between 2005 and 2010

In addition to the high variability in seed yield, the total above-ground nutrient accumulation varied tremendously in the seeds, pod walls and stems. On average, the total accumulated N, P and K amounts were 91·9 kg N/ha, 16·4 kg P/ha and 116·8 kg K/ha, resulting in a yield of 1813 kg/ha or an N: P: K ratio of 5·6:1·0:7·1 in the plant DM. Approximately 0·70 of the N and 0·77 of the P in the above-ground DM was distributed in the seeds, whereas only 0·12 of the K was stored in the seeds. The N, P and K nutrient harvest indices (the nutrient accumulation in the seeds as a proportion of the nutrient accumulation in the above-ground plant DM) were 0·71, 0·77 and 0·12 kg/kg, respectively.
Internal efficiency, plant available soil nutrient supply and nutrient recovery efficiency
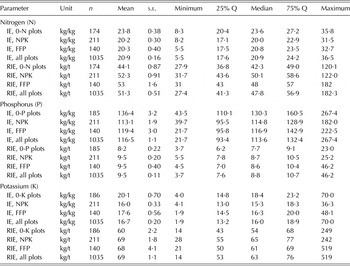
As expected, IE varied widely, from 5·5 to 36·5 kg seed/kg of N taken up by crop, from 21·7 to 267·4 seed/kg of P taken up by crop, and from 1·9 to 70·0 seed/kg of K taken up by crop. The average IEs across all sites and seasons were 20·9 kg seed/kg N, 116·5 kg seed/kg P and 16·7 kg seed/kg K, equivalent to reciprocal internal nutrient efficiencies (RIEs) of 51·3 kg N, 9·5 kg P and 68·5 kg K/1000 kg seed (Table 3). Values of 23·8 kg seed/kg N, 136·4 kg seed/kg P and 20·1 kg seed/kg K were obtained in the present study for the 0-N, 0-P and 0-K plots, respectively. These values were higher than those obtained for the FFP and OPT plots. The internal N efficiency values were similar for OPT and FFP plots because of the comparable seed yields and N fertilizer input levels. Nevertheless, the internal P and K efficiency values were slightly lower for the OPT treatment than for the FFP treatment, which might be related to the lower P and K fertilizer input levels for the FFP plots.
Internal efficiency (IE, kg seed per kg nutrient in above-ground DM), and reciprocal IE (RIE, kg nutrient in above-ground plant DM per 1000 kg seed) for N, P and K at maturity of winter oilseed rape in fields with different fertilizer practices in the Yangtze River Basin, 2005–2010

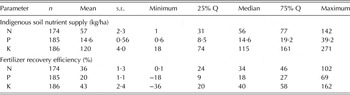
The plant-available soil N supply ranged from 1·1 to 142·0 kg N/ha, with an average of 57·3 kg N/ha, the plant available soil P supply ranged from 0·6 to 39·2 kg P/ha, with an average of 14·6 kg P/ha and the plant available soil K supply ranged from 17·8 to 270·5 kg K/ha, with an average of 119·8 kg K/ha. The average fertilizer recovery efficiencies for optimal fertilization were 0·36, 0·20 and 0·43 for N, P and K, respectively (Table 4).
Descriptive statistics of the data sets used for the QUEFTS model to describe the relationship between seed yield and nutrient uptake for winter oilseed rape around the Yangtze River Basin, 2005–2010

Selection of data for adjusting the Quantitative Evaluation of the Fertility of Tropical Soils to oilseed rape
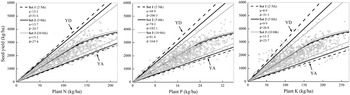
The aim of using the QUEFTS model was to determine the boundary lines of maximum accumulation (a) and maximum dilution (d) of nutrients in winter oilseed rape. On the basis of previous studies (Witt et al. Reference Witt, Dobermann, Abdulrachman, Gines, Wang, Nagarajan, Satawatananont, Son, Tan, Tiem, Simbahan and Olk1999; Zhang et al. Reference Zhang, Hou, Gao, Chen, Zhang and Cui2012), the 2·5th and 97·5th percentiles of the calculated IEs of a nutrient were defined as the values of a and d. In addition, to test the feasibility of this dataset on rapeseed, another two datasets for the model were estimated by excluding the upper and lower 0·05 (Set II) and 0·10 (Set III) of all IEs as outliers when HI > 0·20. The simulated nutrient requirements of winter oilseed rape with different envelope coefficients are shown in Fig. 3. The envelopes were largely influenced by the different data sets and the envelopes were narrowest excluding 10th percentiles of IEs. However, the optimal nutrient requirements simulated by the QUEFTS model were similar for all three sets. It should be noticed that when the target yield approached the yield potential, calculated nutrient uptake under different datasets was different. For example, nutrient uptakes were 167·4 kg N/ha, 29·4 kg P/ha and 208·1 kg K/ha for a target yield of 3·5 t/ha on constants of Set III, which were 10·1–11·4% lower compared with the values for Set I (exclusion of 2·5th and 97·5th percentiles). Considering the maximum range of variability in Set 1, it was used to define the values of maximum accumulation and maximum dilution of each nutrient in winter oilseed rape. After excluding observations with HI values <0·20, the nutrient uptake coefficients for winter oilseed rape were found to be aN = 13·1, dN = 31·6, aP = 68·9, dP = 200·3, aK = 8·9 and dK = 31·1. The ratios of maximum dilution to maximum accumulation (d/a) were 2·4, 2·9 and 3·5 for N, P and K, respectively, indicating that N was more important for rapeseed yield than P and K.
The relationship between seed yield and total above-ground N, P and K uptake of winter oilseed rape at different data sets of a and d values, by excluding the upper and lower 2·5th (set 1), 5·0th (set 2) and 10·0th (set 3) percentiles of the internal efficiencies for all nutrient when HI ≥ 0·20. The balanced N, P and K uptake requirements (YN, YP and YK) for a yield potential of 4000 kg/ha were calculated using the QUEFTS model based on the different boundary lines. The regression lines on the left side of each figure represent the boundary of maximum dilution (YD), and the lines on the right indicate the boundary of maximum accumulation (YA).

Estimating the optimal nutrient uptake by the potential yield
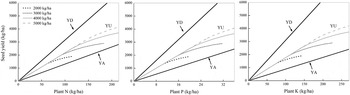
The potential yield influenced the optimal nutrient requirement to achieve a specific target yield. Depending on season and site, the seed yield in Yangtze River Basin ranged from 28–4732 kg/ha. The optimal nutrient requirement at the different potential yields is shown in Fig. 4. Regardless of the yield potential, the crop nutrient uptake increased linearly with seed yield at lower yield levels (<0·60–0·70 of potential yield). The IEs calculated from the model were 21·8 kg seed/kg N, 125·0 kg seed/kg P and 17·5 kg seed/kg K, indicating that 45·9 kg N, 8·0 kg P and 57·0 kg K would be needed to produce a 1000-kg seed yield. When the target yields approached the yield potential, the IEs decrease gradually.
Balanced nutrient requirement for N, P and K at different yield potentials simulated by the QUEFTS model. YD, YA and YU represent the maximum dilution, maximum accumulation and optimal nutrient uptake of N, P and K, which are calculated by the QUEFTS model from excluding the upper and lower 2·5th percentiles of the internal efficiencies for all nutrients when HI ≥ 0·20.

Preliminary validation of the model
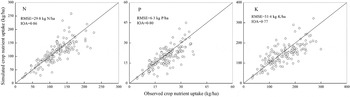
The crop nutrient uptakes simulated with the QUEFTS model using the standard coefficient obtained from analysis of the data presented in the present paper and the specific parameters of each field (plant available soil nutrient supply) compared well with the observed values (Fig. 5). The RMSE values were 29·8, 6·3 and 51·4 kg/ha for N, P and K, respectively, the n-RMSE values were 24·6, 28·9 and 32·8 for N, P and K, respectively, and the IOA values were 0·86, 0·80 and 0·77 for N, P and K, respectively. All the values indicate good performance of the model and that there were no discrepancies between simulated and observed data. These results confirm that the QUEFTS model can be used to predict the nutrient uptake of winter oilseed rape on the basis of specific field conditions.
The relationship between observed and simulated N, P and K uptake in above-ground plant DM for winter oilseed rape.

DISCUSSION
Determination of the boundary lines of maximum accumulation (a) and maximum dilution (d) of nutrients was one of the most critical parameters in the generation of the winter oilseed rape model. The maximum accumulation and maximum dilution of nutrients were not only influenced by variety, weather conditions, soil type, etc., but also affected by nutrient management (Witt et al. Reference Witt, Dobermann, Abdulrachman, Gines, Wang, Nagarajan, Satawatananont, Son, Tan, Tiem, Simbahan and Olk1999; Zhang et al. Reference Zhang, Hou, Gao, Chen, Zhang and Cui2012). The high variability in seed yield revealed in the present study reflected exactly the wide ranges of environments, soil conditions and fertilizer management practices, which provided a robust database for assessing the internal nutrient efficiencies of winter oilseed rape. The average reciprocal internal nutrient efficiencies across all sites and seasons were 51·3 kg N, 9·5 kg P and 68·5 kg K/1000 kg seed. These values were comparable to those reported in previous studies conducted in the Yangtze River Basin in China (Xu et al. Reference Xu, Gu and Xu2012; Yang et al. Reference Yang, Liu, Song, Guan, Rong and Peng2012). However, the values were lower than those reported in Europe. Barraclough (Reference Barraclough1989) reported oilseed rape nutrient uptake amounts of 67·4 kg N, 8·0 kg P and 57·0 kg K/1000 kg seed at a yield of 5·4 t/ha. Orlovius (Reference Orlovius2003) showed that the nutrient requirements for a seed yield of 3·5 t/ha were 57·4–85·7 kg N, 11·4–16·2 kg P and 83·3–107·1 kg K/1000 kg seed.
A prerequisite for using the database was a dataset where crop growth was not subjected to limitations other than in N, P or K supply (Janssen et al. Reference Janssen, Guiking, Van Der Eijk, Smaling, Wolf and Van Reuler1990). However, in field conditions other stresses such as pests, diseases and environmental stress cannot be avoided, which would influence seed yield (Zhou et al. Reference Zhou, Fitt, Welham, Gladders, Sansford and West1999). Not all data in the database met the requirements of the model. The HI served as an efficient tool for selecting data to use for calibration of the model, because it was likely that a lower HI would be associated with pest, disease and environmental stress (Hay Reference Hay1995). The HI of oilseed rape usually ranged from 0·25 to 0·50 kg/kg (Hühn et al. Reference Hühn, Grosse and Leon1991; Diepenbrock Reference Diepenbrock2000; Rathke et al. Reference Rathke, Christen and Diepenbrock2005; Kessel et al. Reference Kessel, Schierholt and Becker2012). In the database used in the present study, the HI varied from 0·06 to 0·40 kg/kg, with an average of 0·29 kg/kg. The data with lower HI and seed yield were associated with limitations other than in N, P or K supply. The corresponding yield with lower HI (<0·20) in the current experiments was <1000 kg/ha and the data should be excluded. When the data with a HI < 0·20 were excluded from model testing, the average of most parameters such as seed yield, nutrient uptake and internal nutrient efficiencies was not influenced, owing to the large number of observations (n = 990). Thus, the HI of 0·20 was selected as a threshold value for excluding data from the calibration of QUEFTS model.
According to previous studies in rice, wheat and maize (Witt et al. Reference Witt, Dobermann, Abdulrachman, Gines, Wang, Nagarajan, Satawatananont, Son, Tan, Tiem, Simbahan and Olk1999; Liu et al. Reference Liu, Yu, Liu and Konijn2006; Zhang et al. Reference Zhang, Hou, Gao, Chen, Zhang and Cui2012), the boundary lines of maximum accumulation (a) and the maximum dilution (d) of nutrients were the 2·5th and 97·5th percentiles of the calculated internal efficiency of a nutrient. From the sensitivity test of different datasets excluding the upper and lower 2·5, 5·0 and 10·0 percentiles of all IE data, similar results were noticed in winter oilseed rape. Considering the maximum range of variability, the 2·5th and 97·5th percentiles of the calculated IE were considered as the a and d coefficients. The nutrient uptake coefficients for winter oilseed rape were aN = 13·1, dN = 31·3, aP = 69·0, dP = 196·5, aK = 8·9 and dK = 30·2 after excluding observations with HI < 0·20. Apparently, the IEs of oilseed rape were lower than rice, wheat and maize (Witt et al. Reference Witt, Dobermann, Abdulrachman, Gines, Wang, Nagarajan, Satawatananont, Son, Tan, Tiem, Simbahan and Olk1999; Zhang et al. Reference Zhang, Hou, Gao, Chen, Zhang and Cui2012; Chuan et al. Reference Chuan, He, Jin, Li, Grant, Xu, Qiu, Zhao and Zhou2013), which suggests that the nutrient requirements of winter oilseed rape were greater than those of these other crops (Brennan & Bolland Reference Brennan and Bolland2009).
On the basis of the data settings, the calculated above-ground nutrient uptakes were 91·7 kg N/ha, 15·9 kg P/ha and 112·7 kg/K ha for a target yield of 2000 kg/ha. These calculated values were close to the measured values (Table 2), which confirmed that the QUEFTS model could be used to predict the nutrient uptake of winter oilseed rape. In 0-N plots, most of the dataset was above the balanced N uptake line and close to the upper boundary, indicating that N supplied by the soil was insufficient for oilseed rape production in the Yangtze River Basin. This was consistent with the finding of many previous studies that N supply was the predominant limiting factor in rapeseed yield (Wang et al. Reference Wang, Lu, Li, Zou, Su, Li and Li2010, Reference Wang, Li, Li, Li, Xiao, Zheng, Yuan, Lu, Liao and Lu2012). For optimal fertilization, most of the N uptake data were close to the optimal lines predicted by the model, meaning that the N application levels were reasonable. In contrast to N, P and K had scattered uptake distributions, even for the 0-P, 0-K and OPT plots. The data below the optimal lines and close to the lower boundary for the OPT plots showed that the P and K application levels were excessive. In the present studies, fertilization at the optimal rates (180 kg N/ha, 90 kg P2O5/ha and 120 kg K2O/ha) could have increased seed yield considerably, by 29·1% on average, over that achieved by the farmers’ fertilization practices (Zou Reference Zou2010). However, in 0·28 of the experiments, only slightly improved seed yield responses to the recommended fertilization rates were observed, in comparison to the yields achieved with the current FFP. These findings suggest that, depending on the regional mean optimal fertilization rates, refining the recommended fertilization rates on the basis of information on specific local conditions will be important to improve seed yield and fertilizer use efficiency considerably.
The predicted values simulated by QUEFTS model compared well with observed values under specific conditions, indicating that the QUEFTS model could be used to predict the nutrient requirement of winter oilseed rape on the basis of specific field conditions. Nevertheless, it cannot be ignored that the QUEFTS model had been developed to work in conditions when crop growth was not affected by other factors such as water limitation, waterlogging, restricted root penetration and poor crop management (Janssen et al. Reference Janssen, Guiking, Van Der Eijk, Smaling, Wolf and Van Reuler1990; Smaling & Janssen Reference Smaling and Janssen1993). Under rainfed conditions, oilseed rape nutrient uptake depends heavily on rainfall during the growing season; therefore this approach might not be optimal because yield response to fertilizer would be highly variable from year to year. In addition to the temporal variability of yield response, there was a spatial variability of yield response which made it hard to implement the model for a whole farm, or a region relying on this approach alone. Thus, combining the QUEFTS model with other crop simulation models, such as the WOrld FOod Studies (WOFOST) model (van Diepen et al. Reference Van Diepen, Wolf and Rappoldt1989) and the Crop Environment REsource Synthesis (CERES) model (Gabrielle et al. Reference Gabrielle, Denoroy, Gosse, Justes and Andersen1998), would be helpful for accurate assessments of crop nutrient requirements and optimizing the fertilizer recommendation system for specific conditions/environments. Based on the determination of the crop's optimal nutrient requirements predicted by the QUEFTS model, a Nutrient Expert system has been developed by the International Plant Nutrition Institute (IPNI), which provides site-specific fertilizer recommendations for farmers to achieve higher yield and profits, and has been used in Indonesia, the Philippines and China (Pampolino et al. Reference Pampolino, Witt, Pasuquin, Johnston and Fisher2012). Also, in some oilseed rape growing areas of the world, precision agricultural management is becoming economically sound and available to farmers. Precision farming systems could use the QUEFTS model to predict spatial variation in crop nutrient requirement based on soil chemical characteristics and make fertilizer recommendations; then, considering the temporal and spatial variability of crop nutrient uptake and soil nutrient supply, real-time monitoring via plant analysis (Thoren & Schmidhalter Reference Thoren and Schmidhalter2009) or soil available nutrient content testing (Sims et al. Reference Sims, Maguire, Leytem, Gartley and Pautler2002; Cui et al. Reference Cui, Chen, Miao, Zhang, Sun, Schroder, Zhang, Li, Shi, Xu, Ye, Liu, Yang, Zhang, Huang and Bao2008) might provide a more timely reflection of the crop nutrient demand and guide the fertilizer recommendation under each specific condition. In summary, the combined use of the QUEFTS model and other crop simulation models or soil/plant rapid-test technologies for assessing specific field conditions will be effective for achieving high yields and high nutrient use efficiencies of winter oilseed rape.
This work was supported by Special Fund for Agro-Scientific Research in the Public Interest (201203013), the earmarked fund for China Agriculture Research System (CARS-13), International Plant Nutrition Institute Co-operation Program (Hubei-35), the Fundamental Research Funds for the Central Universities (2013QC045) and the Program for Changjiang Scholars and Innovative Research Team in University of China (IRT1247). We are grateful to the editor and anonymous reviewers for the constructive comments on the manuscript.