I. INTRODUCTION
Lithium-ion batteries (LIBs) have higher energy-densities, a portative design, and longer lifetimes than other battery technologies. Although LIBs meet the majority of the demands for existing smaller-scale applications (e.g., laptop computers and mobile phones), emerging larger-scale applications, such as electric vehicles and grid-scale energy storage, require improvements in safety, cost, energy density, and current performance.Reference Tarascon and Armand1,Reference Berthelot, Carlier and Delmas2 The first commercialized LIB by SONY Corp. in 1991 consisted of a layered LiCoO2 cathode with a graphite anode.Reference Nishi3 Recently new cathode-chemistries have been developed and commercialized both for specialist applications such as electric vehicles and to replace the more widespread use of LiCoO2 cathodes. Such examples include LiFePO4,Reference Padhi, Nanjundaswamy and Goodenough4 LiMn2O4,Reference Thackeray, de Kock, Rossouw, Liles, Bittihn and Hoge5 and the mixed transition-metal Li(Ni1/3Mn1/3Co1/3)O2 with varying Li:Ni:Co:Mn ratio, and Al-doped Li(NiCo)O2,Reference Dolotko, Senyshyn, Mühlbauer, Nikolowski and Ehrenberg6 with the latter two isostructural to LiCoO2.Reference Yabuuchi and Ohzuku7 The cathode plays an essential role in the performance of a LIB and is often the limiting factor in the battery's performance. The theoretical capacity of a cathode is limited by the composition, with LiMO2 (M = transition metal) ∼270–280 mAh g−1, LiFePO4 ∼170 mAh g−1, and LiMn2O4 ∼148 mAh g−1. As the capacity of most cathodes is lower than that provided by the widely- used graphite anode (∼372 mAh g−1), overcharging (over-delithiating) can seriously harm its structural stability and cycling performance, particularly for LiMO2.Reference Amatucci, Tarascon and Klein8
The mixed transition-metal oxides generally have superior structural stability to LiMO2, and for example, the mixed transition-metal LiNi1/3Co1/3Mn1/3O2 reported by Yabuuchi and Ohzuku is now commercially used. Mn and Co are electrochemically inert in the active voltage range of LiNi1/3Co1/3Mn1/3O2, with the Ni valence changing from 2+ to 4+, effectively doubling the reversible capacity compared to LiCoO2, from ∼140 mAh g−1 to 200 mAh g−1.Reference Yabuuchi and Ohzuku7 By increasing the Ni content, cathodes such as LiNi0.8Mn0.1Co0.1O2, LiMn0.4Ni0.4Co0.2O2, and Al-doped Li(NiCo)O2Reference Dolotko, Senyshyn, Mühlbauer, Nikolowski and Ehrenberg6,Reference Shi, Mai, Tang, Gu, Wang and Tu9–Reference Hu, Liu, Peng, Du and Cao12 deliver capacities higher than 200 mAh g−1.
Inert redox centers in the  $R\bar 3m$ mixed transition-metal structures make such materials more stable than LiCoO2.Reference Yin, Rho, Swainson and Nazar13 Reducing the Co content also reduces cost since the world Co price is currently determined by LIB demand, in addition to lowering the environmental impact, as Co is toxic. Although the as-prepared structure of such cathodes has been characterized, their structural evolution under different electrochemical conditions remains to be studied.
We have previously used operando neutron powder-diffraction (NPD) to show that the commercial NCR (of nominal composition Li(Ni,Co,Al)O2) and CGR (of nominal composition Li(Ni,Co,Mn)O2) cathodes have significantly different behaviors near the battery charged state.Reference Alam, Hanley, Pang, Peterson and Sharma14 Both cathodes expand along the stacking c axis during charge, while during the potentiostatic step recommended by the manufacturers, the CGR electrode stabilizes along the stacking c axis, whereas the NCR contracts significantly. On discharge, the NCR electrode expands for a short portion of discharge and subsequently contracts, while the CGR electrode only contracts. A related NPD study of the Li(Ni0.5Mn0.3Co0.2)O2 cathode equilibrated at particular states of charge revealed a similar contraction near the battery charged state. This is thought to be related to cation mixing in the octahedral layers.Reference Dolotko, Senyshyn, Mühlbauer, Nikolowski and Ehrenberg6 The differences in electrode evolution near the battery's charged state motivated this work, and we examine in detail the cathodes' structural evolution during discharge and charge following overcharge to 4.5 V (versus the mesoporous microbead (MCMB) anode). The NCR cathode contains 3+ Co and Al, expected to be inert within the operating voltage of the battery and leading to the Ni being 3+ at full lithium occupancy and 4+ at the delithiated state. By comparison, the CGR cathode contains inert 4+ Mn and 3+ Co, leading to the Ni being 2+ at the fully lithiated state and 4+ at the delithiated state. Therefore, these cathodes differ not only in their chemical composition but also in their redox transitions, which are Ni 3+/4+ and 2+/3+/4+ for the CGR and NCR cathodes, respectively.
As with our previous work,Reference Alam, Hanley, Pang, Peterson and Sharma14−Reference Pang, Sharma, Peterson, Shiu and Wu16 we use nondestructive operando NPD to probe the cathodes' structural evolution in commercial batteries. Earlier in situ NPD battery research involved data collected over extended periods of time for batteries equilibrated at a particular state-of-charge (SOC).Reference Shu17,Reference Palomares, Goni, Iturrondobeitia, Lezama, de Meatza, Bengoechea and Rojo18 More recent work has taken advantage of improved neutron sources and detectors to collect time-resolved operando NPD data, particularly for the LiCoO2||graphite batteries, revealing the presence of new phases during charge/discharge,Reference Yin, Rho, Swainson and Nazar13,Reference Armand and Tarascon19 evaluating the nature of structural evolution,Reference Hu, Liu, Peng, Du and Cao12 and determining the influence of overcharging on the structure and electrochemical properties of electrodes.Reference Sharma and Peterson20 NPD was used to study the changes in LiCoO2 cathodes and carbon anodes with prolonged cycling and at two temperatures (25 and 50 °C).Reference Dolotko, Senyshyn, Mühlbauer, Nikolowski, Scheiba and Ehrenberg21 Notably, only one previous study has used in situ NPD to understand the overcharging effects on commercial LIBs, revealing the structural changes in the graphite negative electrode. During overcharge, the graphite negative electrode converts to single-phase LiC6, in contrast to conventional charge which results in the two-phase LiC12 and LiC6 compositionReference Billaud, Henry, Lelaurain and Willmann22,Reference Wang, An, Cai, Feng, Nagler, Daniel, Rhodes, Stoica, Skorpenske, Liang, Zhang, Kim, Qi and Harris23 where the crystallographic structure of the LiC12 and LiC6 phases were determined using NPD. Another lithiated phase intermediate between the graphite and LiC12 phase has been reported, and although this is thought to be of LiC24 or LiC18 composition,Reference Billaud, Henry, Lelaurain and Willmann22−Reference Harris, Timmons, Baker and Monroe29 the LiCx composition and structure have not been fully established. Neutron radiography was used to elucidate lithium distribution under overcharging conditions in a coin cell with a carbon anode,Reference Same, Battaglia, Tang and Park30 showing that lithium deposition is more likely to occur at the anode. Despite the detailed insights into overcharge phenomena revealed by neutron-based analysis,Reference Pang, Peterson, Sharma, Shiu and Wu15,Reference Pang, Sharma, Peterson, Shiu and Wu16 limited work has been carried out using operando NPD and is the focus here. We study the structural evolution of the CGR and NCR cathodes, comparing their structural response during the first discharge and second charge following overcharge to 4.5 V (versus MCMB). Additionally, we provide structural information concerning the LiCx phase that is intermediate between graphite and LiC12.
II. EXPERIMENTAL
18650-type LIBs were purchased with CGR and NCR cathodes, known as Li(Ni,Co,Mn)O2 and Li(Ni,Co,Al)O2, respectively. The CGR cathode composition is given as LiNi1/3Co1/3Mn1/3O2 in the information sheet provided by the manufacturer. The NCR cathode composition is given as a mixture of Ni, Co, and Al, although Al is known to be a dopant with its concentration optimized for performance. These batteries are sold at a SOC ranging from 50–60%. Information regarding the battery composition, performance, and details are derived from the information sheet provided by the manufacturer. The batteries are rated to deliver 3.1 (NCR) and 2.25 (CGR) Ah using constant-current charging up to 4.2 V and holding using a tapering current (potentiostatic step). The exact weight of active cathode and anode material in these commercial batteries is unknown, although based on capacity ratings we expect at least 20 and 11 g of active cathode in the NCR and CGR batteries, respectively. Operando NPD data were collected on WOMBAT,Reference Studer, Hagen and Noakes31 the high-intensity neutron powder-diffractometer, at the Open Pool Australian Light-water (OPAL) reactor facility at the Australian Nuclear Science and Technology Organisation (ANSTO). The batteries were placed in a neutron beam of wave length 2.4198(1) Å, determined using the NIST SRM 660b, and data were collected in the range 16.0° ≤ 2θ ≤ 136°. A schematic of the experiment setup is presented in Figure S1. NPD data were acquired every 3 min during charge/discharge cycling. NPD data correction, reduction, and visualization were undertaken using the program LAMP,Reference Richard, Ferrand and Kearley32 with analyses carried out using both Rietveld and single-peak fitting methods. The recommended voltage range for the batteries is 3.0–4.2 V, and during the NPD experiment the batteries were cycled galvanostatically between 3 and 4.5 V at a constant current of 0.5 A using an Autolab potentiostat/galvanostat (PG302N) under ambient conditions, with the external temperature maintained at 22.5 °C.
III. RESULTS AND DISCUSSION
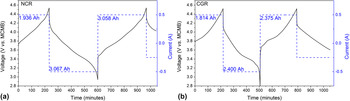
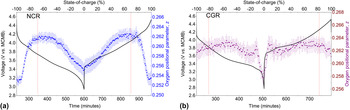
The charge–discharge profiles of the batteries are shown in Fig. 1, highlighting that the batteries were kept at 3.7–3.8 V during storage. We find that the NCR-containing battery delivers 99% of the rated discharge capacity whilst the CGR-containing battery exhibits 106.7% of the rated discharge capacity under overcharge conditions. This work compares the first discharge and second charge structural response of the NCR and CGR cathodes following the overcharge step and the electrochemical behavior of the corresponding battery. In the NCR cathode the 3+ Co and Al are inert within the operating voltage and the Ni valence is expected to be 3+ at full lithium occupancy. This may explain why the charge–discharge curve for the NCR-containing battery contains only 1 sloping plateau corresponding to the Ni3+/Ni4+ couple, in comparison to the two features in the CGR-containing battery profile, corresponding to the Ni2+/Ni3+/Ni4+ couples, where the CGR cathode contains 4+ Mn and 3+ Co and allows Ni to be 2+.
Charge–discharge profiles for (a) NCR and (b) CGR containing batteries obtained during operando NPD experiments.

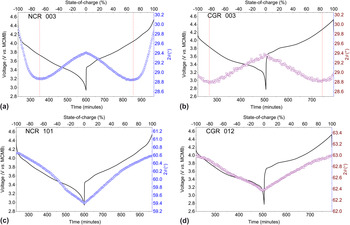
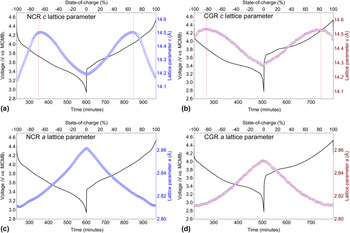
The NPD patterns for both batteries are similar (Figure S2), as expected given their similar construction and components, with the notable exception of the intensity of reflections that is influenced by differences in the neutron scattering-length for the different transition-metals. Given their dissimilar capacity, the cathodes are compared using their SOC (defined by the completeness of the anode transition). The cathode structures were refined using the data for the battery at the 100% SOC (voltage = 4.5 V versus MCMB) (Table SI) and the parameters that were not expected to vary during battery cycling were fixed during the subsequent sequential refinement (e.g., those of Al and Cu current collectors). The evolution of the NCR and CGR 003 reflection is provided in support of the Rietveld-derived c lattice parameter. Similarly, the evolution of the NCR 101 and CGR 012 reflections supports the Rietveld-derived a (= b) lattice parameter evolution, with the reflection choice guided by intensity differences and overlaps with the anode reflections during cycling. Figures 2 and 3 show the results of single Gaussian peak-fitting of the NPD data and sequentially-refined lattice parameters, respectively, for the NCR and CGR cathodes. Rietveld-refinement profiles using the collected NPD data at the battery charged and discharged states are shown in Figure S3. The battery voltage curve and SOC are also given. The c lattice parameter of both cathodes increases and then decreases during discharge, with the reverse observed during charge. In contrast, the a lattice parameter for both cathodes increases monotonically during charge with the reverse occurring during discharge. The behavior of the c lattice parameter of the CGR and NCR cathodes is relatively consistent with that of the isostructural LiCoO2 material.Reference Amatucci, Tarascon and Klein8,Reference Van der Ven, Aydinol, Ceder, Kresse and Hafner33,Reference Laubach, Laubach, Schmidt, Ensling, Schmid, Jaegermann, Thißen, Nikolowski and Ehrenberg34 The exception is the single-phase transition of the NCR and CGR cathodes compared with the small two-phase region of the LiCoO2 material, composed of lithium-rich and lithium-poor phases,Reference Sharma, Peterson, Elcombe, Avdeev, Studer, Blagojevic, Yusoff and Kamarulzaman35 exhibited throughout charge–discharge.
Results of single Gaussian peak-fitting of NCR and CGR cathode reflections. A negative SOC indicates discharge and a positive sign charge. Dotted lines denote the transition between increasing and decreasing c lattice parameter.

Refined lattice parameters for the NCR and CGR cathodes within batteries during discharge and charge. The dotted lines denote the change between the increase and decrease of the c lattice parameter.

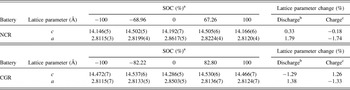
At first the c lattice parameter for both CGR and NCR cathodes increases with Li content during discharge, obeying Vegard's law, with the subsequent non-Vegard decrease of the lattice parameter c ascribed to the electrostatic attraction between the O-containing layers as a result of the deficient average-charge of the O. The increase of the a lattice parameter during discharge arises from decreased attraction between the lower oxidation-state transition metal (Ni) and O ions, expanding the transition-metal oxygen octahedra. The NCR and CGR cathode lattice at various battery SOCs are summarized in Table I. Overall, the c lattice parameter in both cathodes changes less than the a lattice parameter during discharge and charge. Importantly, compared with the ∼2.6% expansion of the c lattice parameter of LiCoO2,Reference Amatucci, Tarascon and Klein8,Reference Van der Ven, Aydinol, Ceder, Kresse and Hafner33,Reference Laubach, Laubach, Schmidt, Ensling, Schmid, Jaegermann, Thißen, Nikolowski and Ehrenberg34 the c lattice parameter of the NCR and CGR cathodes changes by only 0.33 and 1.29%, respectively, between SOC = 0 and 100%, suggesting possibly improved structural and cycling stability.
Lattice response of the NCR and CGR cathodes within a battery during cycling between 3.0 and 4.5 V at a constant current of 0.5 A.

a Negative and positive signs denote discharging and charging processes, respectively.
b Change during 100–0% SOC.
c Change during 0–100% SOC.
We note that the transition point between the Vegard and non-Vegard behavior of the c lattice parameter occurred at a lower SOC (∼68%) for the NCR-containing battery, relative to the CGR-containing battery (SOC ∼82%). Also of note is that the lattice variation during cycling is larger than the variation between the charged and discharged states, although the high reversibility of the lattice response is consistent with the excellent cycling stability of these cathodes.
Whilst the overall responses of the NCR and CGR cathode lattice are very similar, there is a notable difference in this behavior near the fully charged and discharged states. We find that although the lattice parameter c of the CGR cathode is smallest at the discharged battery state, that for the NCR cathode is not, having a larger value at the discharged state than the charged state. To understand the larger contraction of the c lattice parameter of the CGR cathode relative to the NCR in the later stages of discharge, we examine the position of the O atom between the stacking axis layers. Rietveld refinement using the NPD data for the CGR and NCR-containing batteries allowed extraction of the oxygen position during lithium insertion and extraction (Fig. 4). Clearly, the oxygen positional parameter of the CGR cathode changes significantly less than that of the NCR cathode, except at the near discharged state. During discharge, the oxygen positional-parameter of the NCR cathode remained steady at approximately 0.253(1) before increasing to 0.262(1) at ∼68% SOC and finally decreasing to 0.255(1) at 0% SOC. In contrast, the oxygen positional parameter of the CGR cathode varies subtly between 0.261(1) and 0.263(1), but drops significantly to 0.258(1) near the discharged state. The larger change in oxygen positional parameter during the initial stages of discharge and the final stages of charge is associated with the smallest c lattice parameter at ±100% SOC in the NCR cathode, compared to a gradual change observed in the CGR cathode, where the c lattice parameter is smallest at the discharged state (0% SOC).
Variation of the oxygen positional parameter of the NCR (a) and CGR (b) cathodes within batteries during discharge and charge. Dotted lines denote the transition between increasing and decreasing c lattice parameter.

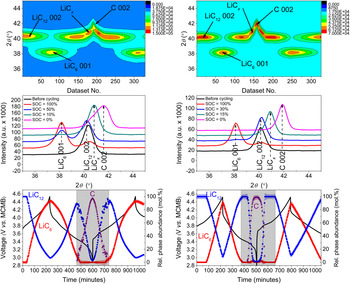
The graphitic anodes are identical in the two batteries and their evolution during cycling is expected to be similar. Figure 5 shows a contour plot of the NPD data in the 2θ range 35–45°, detailing the evolution of the lithium-intercalated anode phases during battery charge and discharge. The positions of the reflections for these phases remain nearly unchanged during battery operation while the intensities vary, indicating that two-phase reactions occur. The NPD patterns for the as-obtained batteries in a wider 2θ range are shown in Figure S2. The stack plots in Fig. 5 show clearly that multiple two-phase reactions of the anode occur, with the involved reflections associated with the formation of LiC6, LiC12, graphite, and an unknown LiCx phase thought to have a lithium concentration intermediate between LiC12 and graphite. The LiCx intermediate phase that occurs near the discharged state before the formation of graphite has been previously noted although its stoichiometry is controversial.Reference Billaud, Henry, Lelaurain and Willmann22−Reference Harris, Timmons, Baker and Monroe29 Reflections from the LiCx phase are observed at 40.71°, 75.45°, 88.57°, and 108.44°. Assuming that the LiCx has a typical hexagonal structure, these reflections correspond to d-spacings of 3.48, 1.98, 1.74, and 1.49 Å with a 4.92 Å a lattice parameter and a 10.42 Å c lattice parameter. Based on the typical ∼3.5 Å spacing between graphene layers in lithiated graphitic anodes, this c lattice parameter suggests that the material contains 3 graphene layers that are ∼3.47 Å apart. Assuming full occupation of lithium sites within the lithium-containing layers, the lattice parameter a suggests that x is 18. The four peaks that we see for the intermediate phase then correspond to the LiC18 003, 202, 006, and the overlapping 205/007 reflections.
Data and results for the NCR-(left) and CGR-(right) containing batteries. Contour plot (upper) of NPD data within the 35–45° 2θ range (intensity scale is shown independently) and corresponding stack plot (middle) at various battery SOCs. The relative phase fractions of graphite, LiC12, and LiC6 (excluding the LiCx phase in the shaded region) are also shown (bottom).

In both the NCR- and CGR-containing batteries the graphite phase appears near the fully discharged state (0% SOC, 3.0 V). The data for the NCR-containing battery reveal that there is ∼93(2) mol% LiC6 and 7(1) mol% LiC12 at 4.5 V, indicating that the LiC12–LiC6 two-phase reaction is incomplete even in the 4.5 V overcharged state. By definition, the SOC for NCR is approximately 93% of the theoretical value for graphite (the reaction of C to LiC6). For the CGR-containing battery the NPD data indicate there is 91(4) mol% LiC6 and 9(3) mol% LiC12 at the fully charged state (4.5 V). Similarly, the LiC12–LiC6 two-phase reaction is also incomplete in the CGR-containing battery, where the SOC is approximately 91% of the theoretical value for graphite.
IV. CONCLUSIONS
Here we use operando neutron powder-diffraction to measure the structural evolution of electrodes in commercial LIBs during galvanostatic cycling between 3.0 and 4.5 V and show the differences in these induced by different cathode chemistries. The NCR (Li(Ni,Co,Al)O2) and CGR (Li(Ni,Co,Mn)O2) cathodes adopt similar structures, and although they exhibit similar overall lattice evolution, there exist significant differences as a result of their composition. During lithiation on discharge, the c lattice parameter stacking axis first increases, obeying Vegard's law, and then decreases as a result of the deficient average-charge of the O ions and subsequent electrostatic attraction between the O-containing layers. The opposite occurs on delithiation during charge. Interestingly, the initial increase and later decrease are smaller (by ∼82% and 19%, respectively) for the CGR cathode than for the NCR cathode. The overall change of the NCR cathode between SOC = 0 and 100%, is 74% smaller than that of the CGR cathode, with the larger expansion of the CGR material corresponding to a larger variation of the oxygen position between the charged and discharged states. At the anode, during lithiation we find an intermediate LiCx phase formed between LiC12 and graphite in both batteries that appears to be a LiC18 hexagonal structure with lattice parameters c and a of 10.42 and 4.94 Å, respectively.
Supplementary Material
To view the supplementary material for this article, please visit http://dx.doi.org/jmr.2014.297.
ACKNOWLEDGMENTS
The authors are also grateful to the staff members at the Bragg Institute, ANSTO for their operations support. Dr. Sharma would like to thank AINSE Ltd. for providing support through the research fellowship scheme.