INTRODUCTION
Global land precipitation increased by about 2% during the 20th century (Jones & Hulme Reference Jones and Hulme1996; Hulme et al. Reference Hulme, Osborn and Johns1998), but by 10–40% across northern Europe (Klein Tank et al. Reference Klein Tank, Wijngaard, Können, Böhm, Demarée, Gocheva, Mileta, Pashiardis, Hejkrlik, Kern-Hansen, Heino, Bessemoulin, Müller-Westermeier, Tzanakou, Szalai, Pálsdóttir, Fitzgerald, Rubin, Capaldo, Maugeri, Leitass, Bukantis, Aberfeld, Van Engelen, Forland, Mietus, Coelho, Mares, Razuvaev, Nieplova, Cegnar, López, Dahlström, Moberg, Kirchhofer, Ceylan, Pachaliuk, Alexander and Petrovic2002). Projections for this century indicate warmer climates with more intense and more frequent extreme precipitation events (IPCC Reference Pachauri and Meyer2014).
In wheat (Triticum aestivum L.), reduction in water availability shortens grain-filling duration and so reduces grain size and yield (Nicolas et al. Reference Nicolas, Gleadow and Dalling1984; Gooding et al. Reference Gooding, Ellis, Shewry and Schofield2003), whereas several grain quality traits such as nitrogen (N) concentration, sulphur (S) concentration, sodium dodecyl sulphate (SDS) sedimentation volume and Hagberg Falling Number (HFN) are increased (Gooding et al. Reference Gooding, Ellis, Shewry and Schofield2003). The effects of either absence or excess of rainfall during grain development on different aspects of quality can be dependent upon timing. This has been detected within the UK's considerable inter-annual fluctuation in wheat grain quality: analysis of long-term UK climate and production data showed that crude protein (CP) content was reduced by rain (almost 0·1 g/kg/mm) in May and HFN reduced (about 1 s/mm) by rain in August (Gooding et al. Reference Gooding, Smith, Davies and Kettlewell1997).
End-use quality of grain, for example to mill for bread making, is of considerable importance to the successful marketing of the wheat crop (Gooding & Davies Reference Gooding and Davies1997). Crude protein concentration (N × 5·7) affects wheat flour's dough properties (Gooding & Davies Reference Gooding and Davies1997). Sticky doughs, difficult to process, result from low HFN, common in UK-produced wheat (Lunn et al. Reference Lunn, Kettlewell, Major and Scott2001) indicating high α-amylase activity (Kondhare et al. Reference Kondhare, Farrell, Kettlewell, Hedden and Monaghan2015). The SDS sedimentation volume test estimates the presence of high molecular weight proteins, such as glutenins, and thus dough viscosity and elasticity (Fullington et al. Reference Fullington, Miskelly, Wrigley and Kasarda1987; Peña et al. Reference Peña, Trethowan, Pfeiffer and Van Ginkel2002). Grains with low S concentration show low SDS sedimentation volumes (McGrath et al. Reference McGrath, Jancso and Pichersky1993); bread-making quality is related more to S than protein concentration, with high N : S ratios indicating poor protein quality (Zhao et al. Reference Zhao, Hawkesford and McGrath1999). Blackpoint is a different aspect of grain quality affecting flour: the dark discolouration of the embryo end of wheat grains (Williamson Reference Williamson1997) by the fungus Dematiaceous hyphomycetes, the spores of which are produced free in the atmosphere (Hanson & Christensen Reference Hanson and Christensen1953; Anonymous 1985; Cromey & Mulholland Reference Cromey and Mulholland1988). It occurs in all the major wheat growing regions of the world (Lorenz Reference Lorenz1986).
Rainfall can slow grain drying, but may also promote the germination (sensu strictu or even to visible sprouting) of both wheat grains – so reducing HFN (Kondhare et al. Reference Kondhare, Farrell, Kettlewell, Hedden and Monaghan2015) – and/or fungal spores, increasing grain discoloration by blackpoint. Research relevant to the above has tended to rely heavily upon experiments in which water availability has been reduced by imposing drought on growing plants, or from the post-hoc analysis of crop production and weather records. The current research, therefore, investigated the consequences for wheat grain quality at maturity from simulated rainfall applied to ears or rain shelter of ears of field-grown crops for different, defined, successive periods of grain development and ripening: can the expected response be detected in the field by altering the environment around the ears? The null hypotheses were, for each grain quality trait, that (a) variation in rainfall incident upon ears had no effect on wheat grain quality; and (b) successive periods of grain development and ripening were equally-insensitive to rainfall in this regard.
MATERIALS AND METHODS
Crops of wheat cvar Tybalt (NABIM Group 2 milling quality) were grown on a deep sandy loam soil at the University of Reading's Crop Research Unit, Sonning (51°27′N, 0°56′W). Seeds were sown on 16 March 2011 or 15 March 2012, 4–5 cm deep, with a small-plot drill and then consolidated with a Cambridge roller, with 16 rows 12 cm apart at 400 seeds/m2 in plots 7·5 × 1·9 m2 (with 0·6 m between plots). Standard agronomic practices for the location were applied. In each year the crops followed a 3-year cocksfoot, chicory, red clover ley, designed to provide a uniform site after previous experimentation, add organic matter and improve soil structure. Soil analyses were carried out in late summer–autumn (300 mm deep for phosphorus (P), potassium (K) and magnesium (Mg)) and spring (900 mm deep for N, S) for each field experiment. Phosphorus, K and Mg indices were 2, 1 and 1 in 2010 and 3, 1 and 1 in 2011, with 59·3 kg/ha and 45·3 mg/l available N and available sulphate, respectively, in spring 2011 and 60·8 kg/ha and 32·0 mg/l available N and available sulphate, respectively, in spring 2012. In the 2011 investigation, fertilizers (90 kg potassium oxide (K2O)/ha before ploughing in September 2010 and 100 kg N/ha on 13 May 2011), the herbicide Harmony M SX at 125 g/ha (400 g/kg thifensulfuron methyl and 40 g/kg metsulfuron methyl; Du Pont, Stevenage, UK) on 7 April 2011, and the fungicide Opus at 1 litre/ha in 220 litres water (epoxiconazole; BASF, Cheadle Hulme, UK) on 11 May 2011 were applied. In 2012, fertilizers (102 kg K2O/ha before ploughing in September 2011 and 100 kg N/ha on 4 May 2012), the herbicide Harmony M SX (as above) on 16 May 2012, and the fungicide Opus (as above) on 21 May 2012 were applied.
Each experiment was a split-plot design, with different harvest dates as sub-plots, with two blocks. In 2011, the 11 main plots comprised open, sheltered (no rainfall), or additional (simulated) rainfall. One plot received no experimental treatment (C1O; open control) while another was covered by a full rain shelter from 50% anthesis until 56 days after 50% anthesis (DAA) (C2S; sheltered control). Four plots were provided with temporary rain shelter for successive 14 days periods: 0–14 (S1), 14–28 (S2), 28–42 (S3), or 42–56 DAA (S4). Five (open) plots were subject to simulated rain at different periods of grain development: a single ear wetting at 7 (W1), 21 (W2), 35 (W3), or 49 DAA (W4), or four successive wettings at 7, 21, 35 and 49 DAA (W5). In 2012, the ten main plots were: control (C1O; open control) and full rain shelter from 50% anthesis until 70 DAA (C2S; sheltered control), three temporary rain shelter treatments for the periods 42–70 (S1), 42–56 (S2), or 56–70 DAA (S3), and five single ear wettings at 42 (W1), 49 (W2), 56 (W3), 63 (W4), or 70 DAA (W5). In addition, results from samples harvested immediately after treatments W1–5 were designated W.
Rain shelters were 2 × 5 × 1·5 m3 tall (twice the crop height and open at the sides to aid air circulation and minimize temperature rise above the crop canopy) covered with polythene (VisqueenLumitherm – 11A,Visqueen Building Products, Heanor, UK). Four iButtons (DS1923, HygrochroniButton, Maxim Integrated, San Jose, CA, USA) were installed (two in each block) above the crop canopy to record temperature in control and sheltered plots. Photosynthetically active radiation (PAR) was recorded under each shelter using a PAR sensor (AccuPAR model LP-80, Decagon Devices, Inc., Pullman, USA). Each simulated rainfall, ear wetting treatment provided the equivalent of 25 mm rainfall. Water was applied directly to the ears with a watering can and rose in two part (half) applications, with a 30-min interval.
Samples of ears from each treatment were harvested serially, between 07.00 and 09.00 h, on up to nine occasions during grain development and maturation (14, 25, 32, 39, 46, 53, 60, 67 and 74 DAA in 2011; 14, 21, 28, 35, 42, 49, 56, 63, 70 and 77 DAA in 2012). Initial samples from ear wetting treatments were taken about 30 min after the end of the treatment. In 2012, samples were also taken just before ear wetting. The sub-plot area was selected at random within each main plot and 100 ears cut about 1–2 cm below spikes, placed in loosely-folded polythene bags and taken to the laboratory.
Grains were gently threshed from ears by hand. Grain moisture content and dry weight were estimated for all harvests in order to assess treatment effects on grain filling and desiccation. Grain quality was assessed for the last harvest (21 August 2011, 74 DAA; 27 August 2012, 70 DAA, except in the case of W5 where it was at 77 DAA, i.e. 7 days after ear wetting, with the sample at 70 DAA designated W (as above).
Grain moisture content was estimated on a fresh weight basis by the high-constant-temperature-oven method: two replicates of 4–5 g ground grain dried at 130 ± 2 °C for 2 h, with the two-stage procedure for values >170 g/kg (International Seed Testing Association 2011). Grain dry weight was estimated by counting and weighing two replicates of 300 grains and adjusted to 0 g/kg moisture content.
Samples were dried to <150 g/kg moisture content at 15–17 °C with 12–15% relative humidity, where necessary, and stored in hermetically sealed containers at 0–4 °C until the subsequent determinations of grain quality. Dried grain samples (10 g) were first milled using a Laboratory Mill 3100 (Perten Instruments AB, Huddinge, Sweden). Nitrogen and S concentrations were determined for two replicates of each sample from a 0·20 g sample of dried wholemeal flour by the oxidative combustion method (Association of Official Analytical Chemists International 2005) using automated Dumas type combustion analysers (LECO FP-528 and LECO SC-144DR, Leco Instruments (UK) Ltd, Stockport, UK). Crude protein (CP) concentration (g/kg DM) was calculated by multiplying N (g/kg) by 5·7 (Gooding & Davies Reference Gooding and Davies1997).
Hagberg Falling Number was estimated with equipment incorporating automatic agitation (Falling Number 1500; ISO 3093: 1982, British Standards Institution; Perten Instruments, Sweden) with a sample of 7 g flour at 150 g/kg moisture content, in two replicates, suspended in 25 ml distilled water. To estimate SDS sedimentation volume, 6 g wholemeal wheat flour at 150 g/kg moisture content (two replicates for each treatment) was suspended in 50 ml of distilled water in a 100 ml cylinder; 50 ml SDS reagent (stock solution: 20 g SDS + 20 ml diluted lactic acid in a litre of distilled water) was added and shaken to make a suspension, allowed to settle for 20 min and sediment volume recorded.
Two replicates of 50 grains from each sub-plot were sampled and each grain scored individually for blackpoint. The score (0–3) varied with the extent of blackening, assessed against reference slides made earlier for this purpose, and so indicated the severity of discoloration: 0, no discoloration; 1, blackening restricted to the embryo region; 2, blackening extending over the shoulders of the grain; 3, blackening covered the majority of the grain surface. The maximum possible score was 150 (i.e. 50 grains scoring 3). Each replicate's total score was expressed as a percentage of the maximum possible score of 150 (i.e. 50 grains scoring 3) using the formula of Lorenz (Reference Lorenz1986):
 $$\eqalign{&{\rm Blackpoint} \ (\%) \cr & \quad= [\{(\hbox{Grains scoring} \ 1) + (\hbox{Grains scoring} 2 \times 2) \cr & \qquad + (\hbox{Grains scoring} 3 \times 3) \} / 150]\times 100}$$
This formula has been applied before to quantify blackpoint incidence (Ellis et al. Reference Ellis, Gooding and Thompson1996).
Data was analysed using Genstat (Release 13, VSN International Ltd, Lawes Agricultural Trust, Rothamsted, UK). Analysis of variance was applied to each dataset to assess the effects of treatments on grain quality for split-plot designs. The modified Gompertz model (Gooding et al. Reference Gooding, Dimmock, France and Jones2000, Reference Gooding, Ellis, Shewry and Schofield2003) was applied to quantify the decline in moisture content during grain development and maturation (X, DAA):
 $$\eqalign{\hbox{moisture content} (g/kg) & = A + C \times exp[ - exp\{ - k \cr & \quad \times (X - m)\}]}$$
where C is initial moisture content, A is final moisture content, k is rate of decline, and m is duration (days) from anthesis to curve inflection, which equated here to 470 g/kg moisture content. This inflection point coincides with the end of grain filling. The end of grain filling was termed physiological maturity by Shaw & Loomis (Reference Shaw and Loomis1950), but as grains are not physiologically mature at this stage it is potentially misleading and so the term mass maturity was introduced (Ellis & Pieta-Filho Reference Egli1992) and is used in the current paper.
Grain dry weight at harvest is a function of the rate and duration of grain filling. Grain filling in each treatment was quantified as broken-stick regressions using the FITNONLINEAR directive in Genstat, comprising a linear increase in grain dry weight with duration of development until maximum grain weight was achieved with no change thereafter (Pieta Filho & Ellis Reference Pieta Filho and Ellis1991; Egli Reference Egli1998; Gooding et al. Reference Gooding, Ellis, Shewry and Schofield2003) and quantified by the three variables maximum grain weight (i.e. breakpoint on y-axis), linear rate of grain filling (slope), and the duration (i.e. breakpoint on x-axis) from anthesis until mass maturity. The regressions were fitted separately to each main plot and compared.
RESULTS
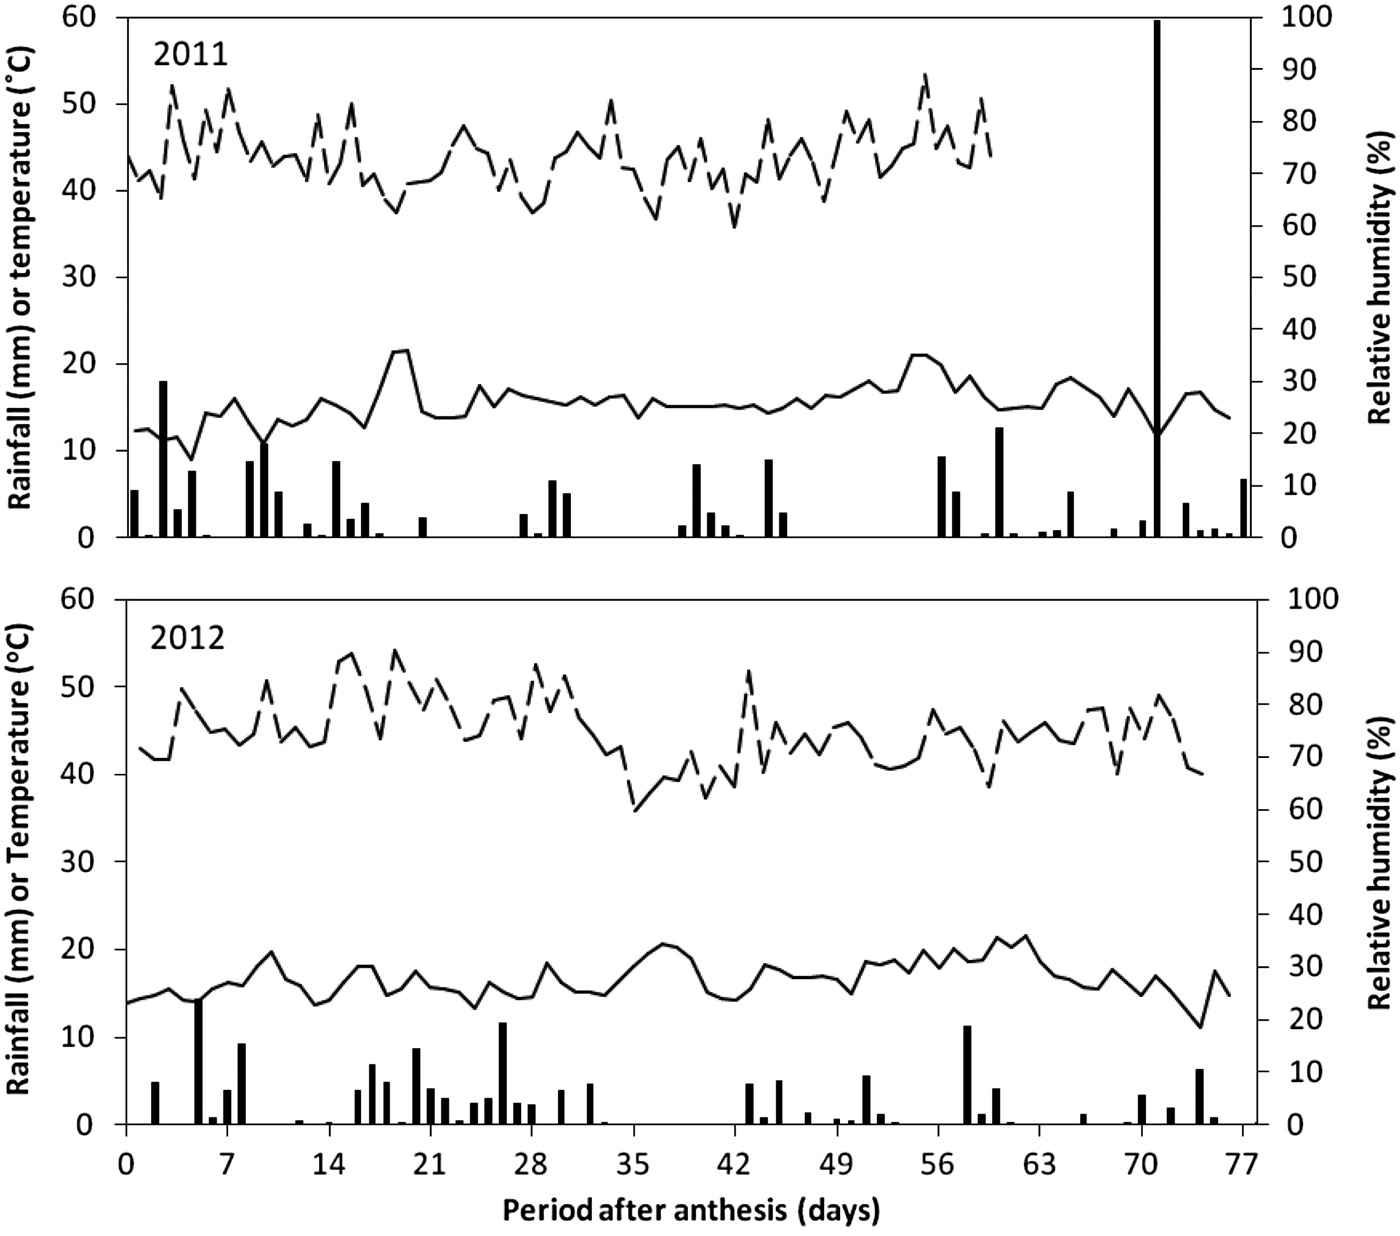
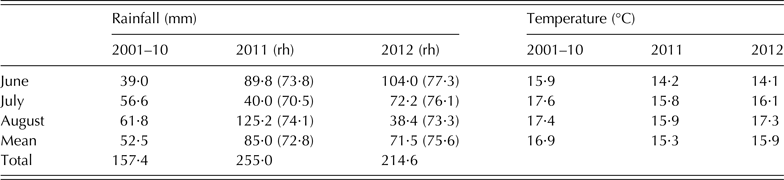
Anthesis of 50% of tillers occurred on 8 June 2011 (84 days after sowing) and 18 June 2012 (95 days after sowing). Rainfall and temperature varied between years from anthesis until final harvest (Fig. 1): maximum and minimum temperatures were 21·5 and 9·0 °C (mean 15·4 °C, Fig. 1(a)) with relative humidity extremes of 89·0 and 59·8% in 2011 and rainfall was unevenly distributed with the maximum rainfall, 59·5 mm, occurring 71 DAA (18 August 2011). In 2012, these respective values were 21·4 and 11·1 °C (mean 16·5 °C, Fig. 1(b)), 90·5 and 59·8% (Fig. 1(b)), with the maximum rainfall, 14·2 mm, recorded 3 DAA (21 June 2012). Summer 2011 was wetter, but slightly less humid, and cooler than 2012 and both years were wetter and cooler than the decadal mean (Table 1).
Mean daily temperature (°C, ––––), rainfall (mm, solid bars) and relative humidity (%, - - - - - -) of the experimental site during the period of treatment and until final harvest in 2011 (a) and 2012 (b), Crop Research Unit, Sonning.

Mean monthly rainfall and temperature for June–August 2011 and 2012 and decadal means (2001–10), Crop Research Unit, Sonning

rh, relative humidity (%).
The shelters affected the production environment beyond just rainfall protection. Transmission of PAR through the covers was 84·6% with 90·2% direct light transmission. On average, crops under cover were 0·8–0·9 °C warmer than open controls.
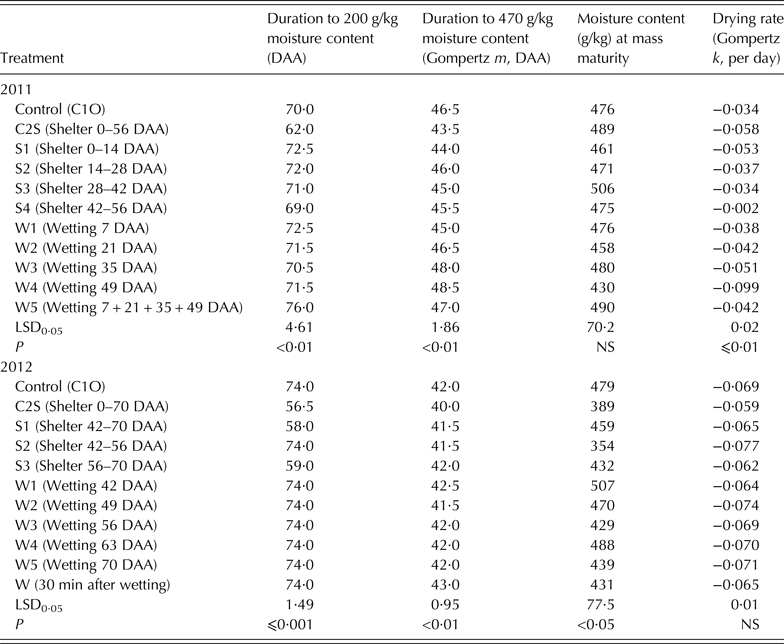
Desiccation patterns matched general expectations for grain development and maturation and were described well by the Gompertz function in 2011 (Fig. 2) and 2012 (Fig. 3), with the inflection point at 470 g/kg (Table 2). However, in two of the later-applied treatments where there were very few observations, either an estimate was unreliable (k, S4, 2011, Table 2) or the fit was poor (W5, 2012, Fig. 3(i)). The phase of most rapid desiccation (broadly 30–50 DAA) was more obvious in the warmer and drier 2012, where equilibrium with ambient was approached at about 56 DAA (Fig. 3) compared with 10–20 days later in 2011 (Fig. 2); final moisture contents were lower in 2011. Differences were detected among treatments in duration to 200 g/kg moisture content in both years but for drying rate in 2011 only (Table 2). Comparisons among fitted curves within each year showed only small differences. Not surprisingly, rain shelter throughout the study period resulted in the most rapid loss in moisture and lower final values than open controls (Figs 2(a) and 3(a)). On the other hand, although wetting had an immediate effect on moisture content (Fig. 3(j)), there was little effect on the fitted curves overall (Figs 2(f–j) and 3(e–i)).
Relationship during grain filling and maturation between grain moisture content (% fresh weight basis; × 10 for g/kg) and period from 50% anthesis of wheat cvar Tybalt in 2011, growing under different rain shelter (C2S (a), S1 (b), S2 (c), S3 (d) and S4 (e) ( )) or ear wetting treatments (W5 (multiple wettings) (f), W1 (g), W2 (h), W3 (i) and W4 (j) (
 )) compared with control (C1O,
 ). The Gompertz curves fitted are quantified in Table 2.

Relationship during grain filling and maturation between grain moisture content (% fresh weight basis; × 10 for g/kg) and period from 50% anthesis of wheat cvar Tybalt in 2012 under different rain shelter (C2S (a), S1 (b), S2 (c) and S3 (d) ( ))or ear wetting treatments (W1 (e), W2 (f), W3 (g), W4 (h) W5 (i) and W (30 min after each wetting) (
 )) compared with control (C1O,
 ). The results and fitted curves for W1–5 include those for samples taken immediately before ear wetting, but exclude samples harvested 30 min afterwards. The latter are presented collectively in W (j). The Gompertz curves fitted are quantified in Table 2.

Effect of different rain shelter or ear wetting treatments on grain drying of wheat cvar Tybalt (2011 and 2012) as quantified by the modified Gompertz model

DAA, days after anthesis; NS, not significant.
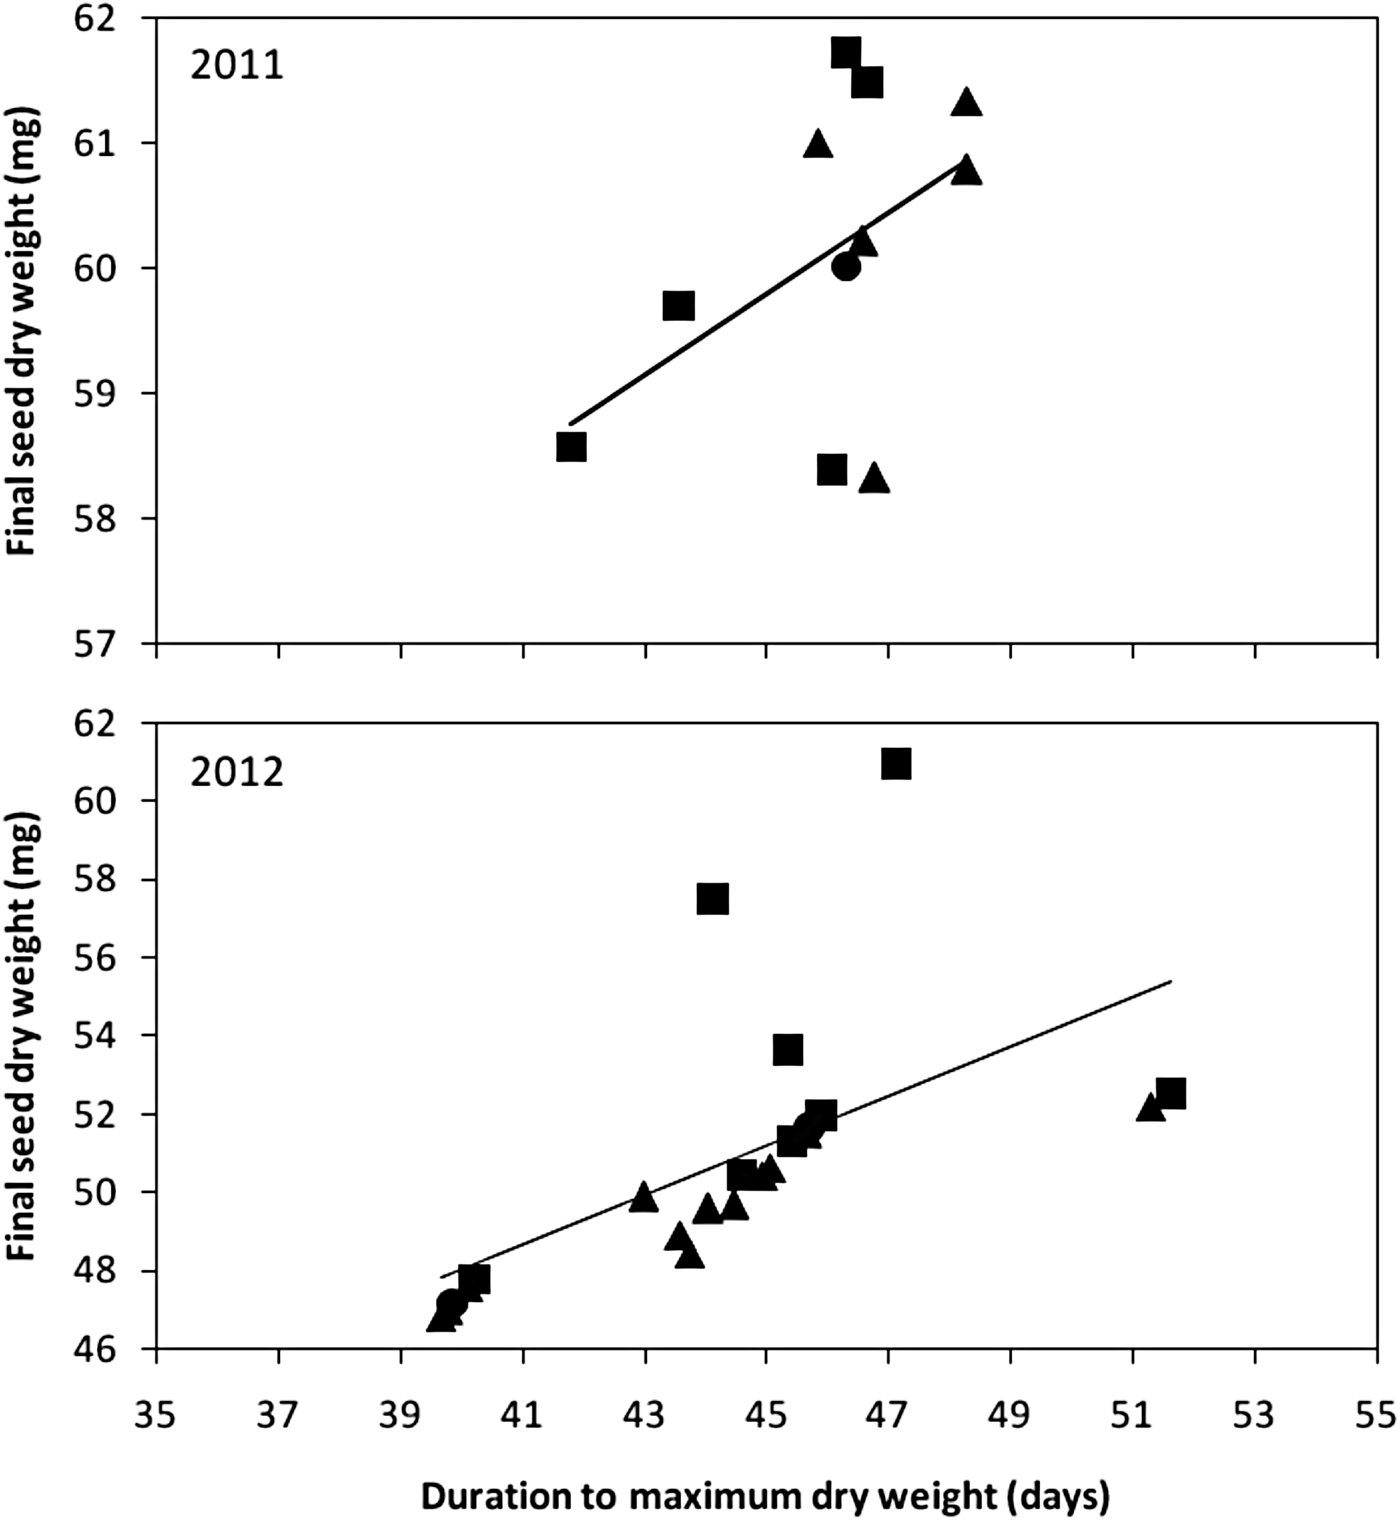
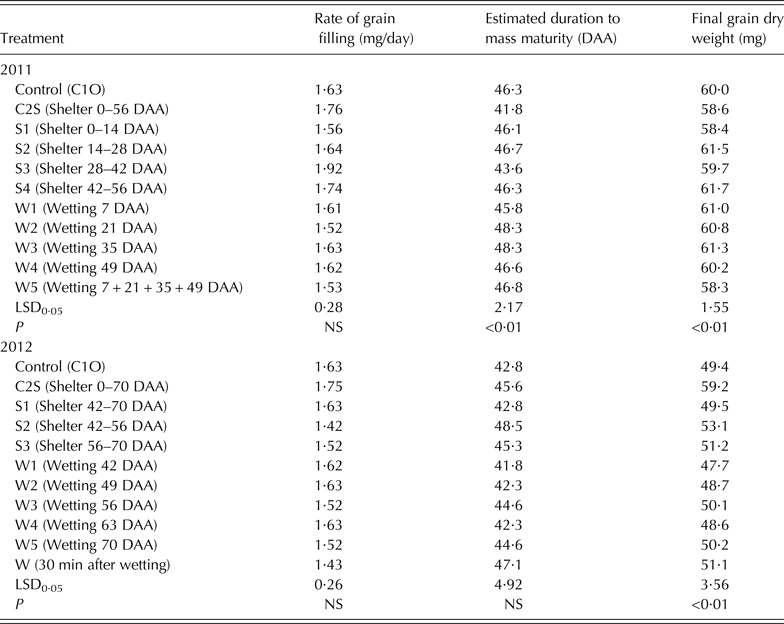
Grain filling was described well by broken-stick regressions in both years (Figs 4 and 5) with a linear phase of grain filling beginning (by extrapolation) some 10 (2011) to 12 DAA (2012) and at similar rates thereafter in both years’ controls (Table 3). The treatments affected final grain dry weight significantly (P < 0·01) within each year, heavier on average in 2011 than 2012, and durations to mass maturity in 2011 (only) (P < 0·01), longer on average in 2011 than 2012 (Table 3). The remaining estimates in these relationships did not differ significantly. Hence, neither did the fitted broken-stick relationships differ greatly among treatments within each year: shelter throughout the study period or for the first 14 days during the grain-filling phase resulted in lower final grain dry weight – and a more rapid, shorter grain-filling phase – in 2011 (Figs 4(a) and (b)) but not in 2012 (Figs 5(a)–(d)); no wetting treatment affected these relationships in either year (Table 3). Final grain dry weight was correlated positively with duration of grain filling within each year (Fig. 6).
Relationship during grain filling and maturation drying between mean grain dry weight (mg) with period from 50% anthesis of wheat cvar Tybalt in 2011 under different rain shelter (C2S (a), S1 (b), S2 (c), S3 (d) and S4 (e) ( )) or ear wetting treatments (W5 (multiple wettings) (f), W1 (g), W2 (h), W3 (i) and W4 (j) (
 )) compared with control (C1O,
 ). The broken-stick relationships fitted are quantified in Table 3.

Relationship during grain filling and maturation drying between mean grain dry weight (mg) and period from 50% anthesis of wheat cvar Tybalt in 2012 under different rain shelter (C2S (a), S1 (b) and S2 (c), S3 (d) ( )) or ear wetting treatments (W1(e), W2 (f), W3 (g), W4 (h), W5 (i) and W (30 min after each wetting) (j) (
 )) compared with control (C1O,
 ). The results and fitted relationships for W1–5 include those for samples taken immediately before ear wetting, but exclude samples harvested 30 min afterwards. The latter are presented collectively in W (j). The broken-stick relationships fitted are quantified in Table 3.

Correlation between final grain dry weight (mg) and duration from anthesis to maximum grain weight (days) in (a) 2011 (r = 0·48; P < 0·01) and (b) 2012 (r = 0·61; P < 0·01) for sheltered (■), ear wetting (▴) and control treatments (•) in wheat cvar Tybalt.

Effect of different rain shelter or ear wetting treatments on grain filling of wheat cvar Tybalt (2011 and 2012) as quantified by broken-stick regressions

DAA, days after anthesis; NS, not significant.
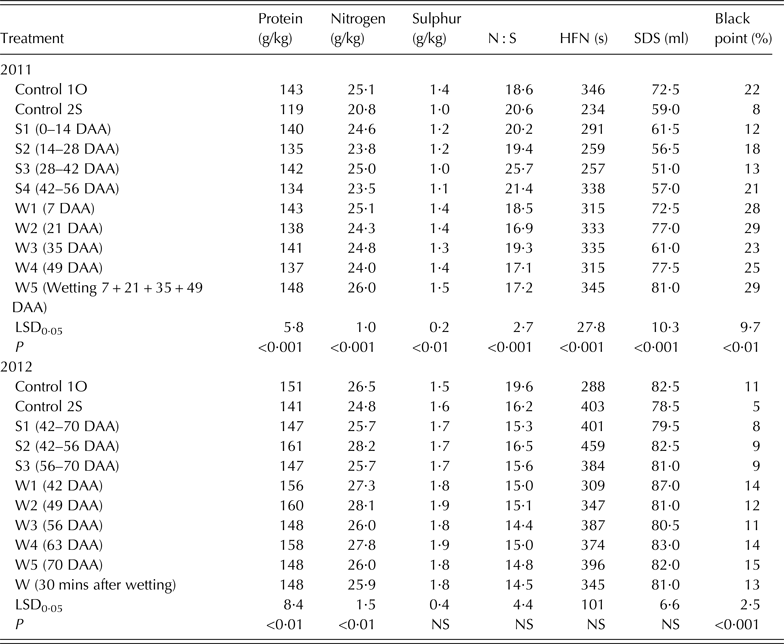
In 2011, all aspects of grain quality assessed were affected significantly (P < 0·01 or P < 0·001) by treatments, whereas in 2012 only N concentration (and so CP) (P < 0·01) and blackpoint (P < 0·001) were affected (Table 4). Rain shelter in 2011, especially throughout the entire study period, reduced CP whereas no consistent, nor significant, effect of wetting treatment was detected. In the drier 2012, the effect of rain shelter on CP was very much less, with shelter throughout reducing it significantly (P < 0·05) and, as in the previous year; wetting treatments had no clear effect. The two extreme treatments at 49 ± 7 days (i.e. S2 and W2) gave the highest CP of all treatments in 2012, but this was not the case in 2011 (i.e. S4 and W4) where treatment at these developmental times both provided estimates lower than the control.
Effect of different rain shelter or ear wetting treatments on grain quality of wheat cvar Tybalt (2011 and 2012) at harvest maturity. Samples were harvested 74 days after anthesis (DAA) (2011) or 70 DAA (2012), except W5 (2012) where it was 77 DAA (7 days after wetting) and W is the sample harvested 30 min after wetting at 70 DAA

NS, not significant.
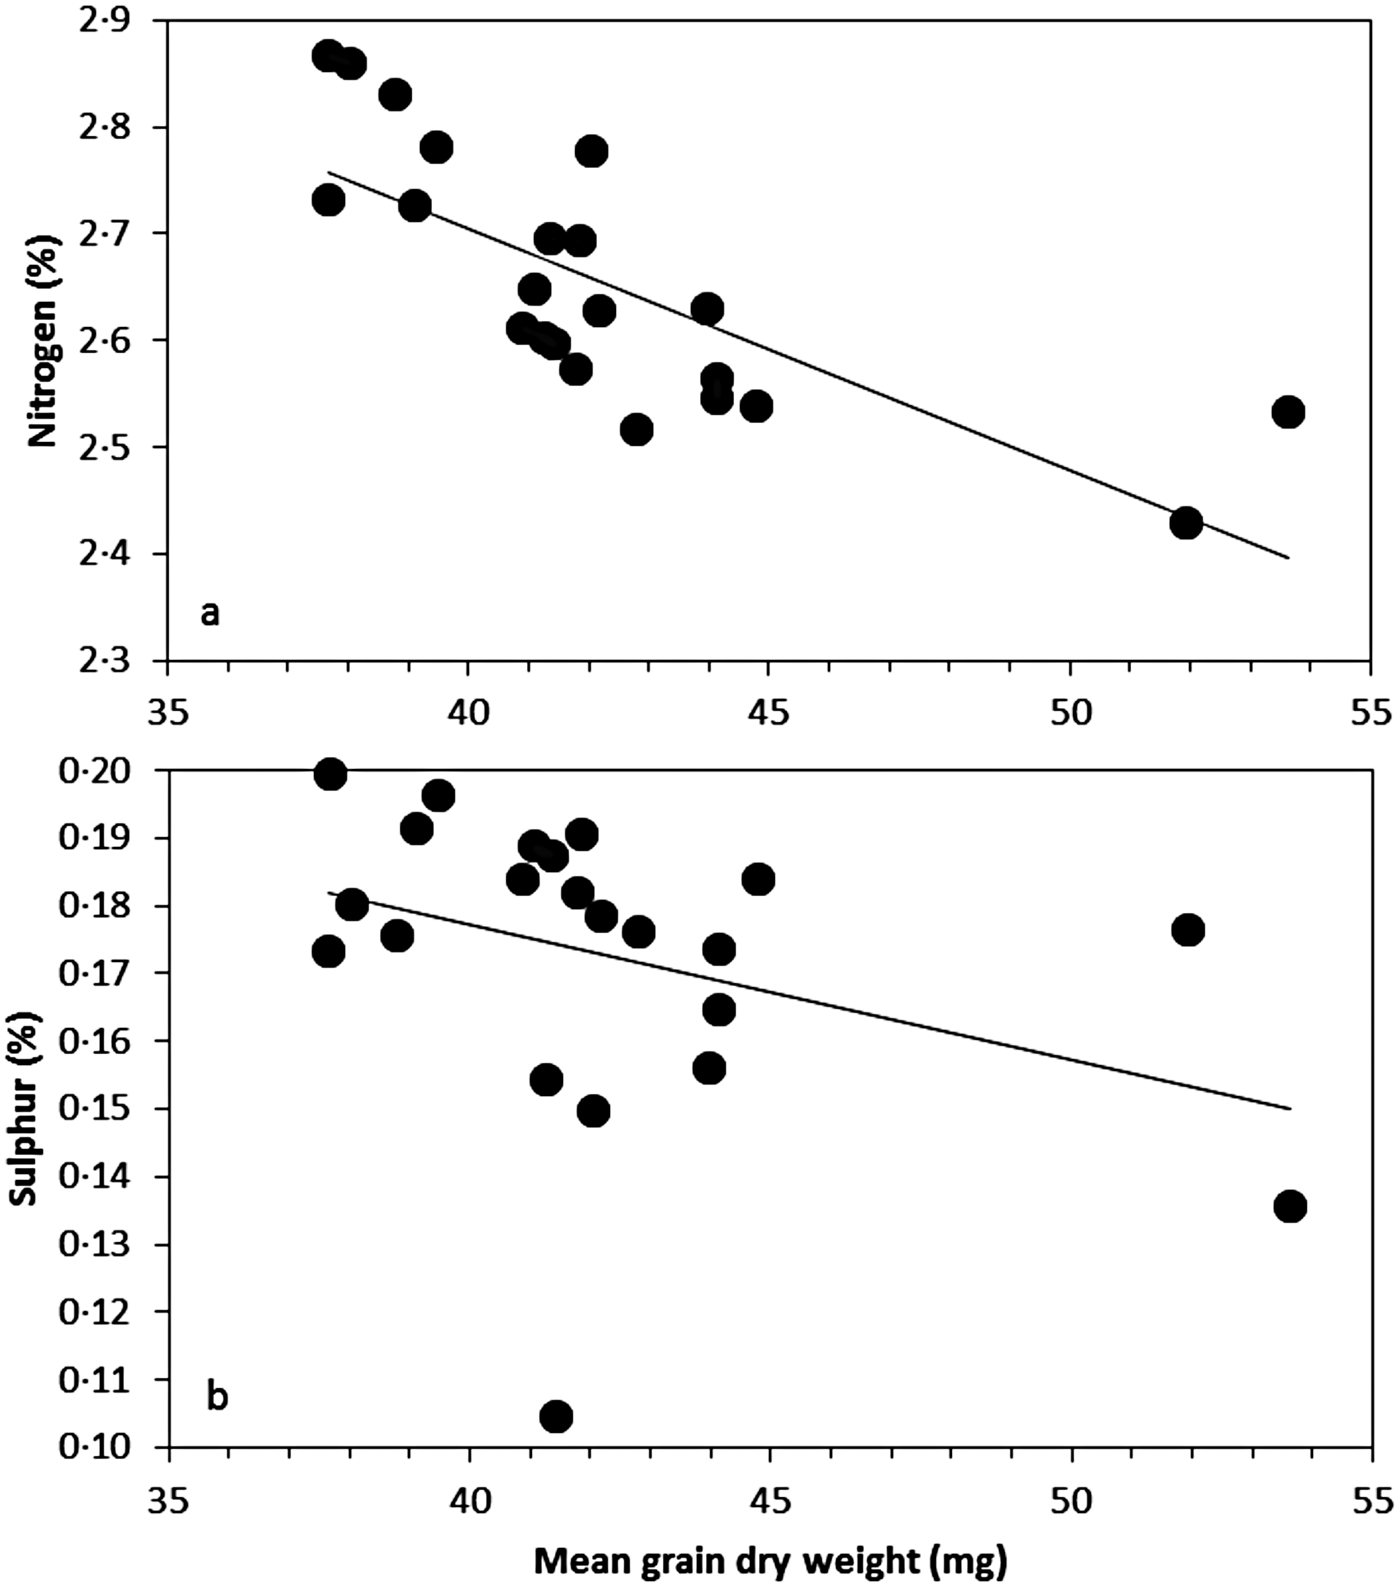
Sulphur concentration was reduced significantly (P < 0·05) by rain shelter in 2011, being least for shelter throughout and S3 (see below). Ear wetting did not affect S concentration. As a consequence of the above effects on each of N and S in 2011, N : S ratios were consistently greater than the control among the rain shelter treatments and while, on average, they were lower than the control for wetting treatments this was neither consistent nor significant. The greatest effect on N : S ratio (and highest value) was detected in S3 (rain shelter in the final 14 days of grain-filling, Fig. 4(d)) where protein content was unaffected by treatment but S concentration was substantially reduced (Table 4). The non-significant effects of the contrasting treatments on N : S ratio in 2012 provided estimates lower than the control in every case. Variation in N and S concentrations were each correlated negatively with final mean grain dry weight in 2012 (Fig. 7). No significant correlations were detected between these traits in 2011.
Correlation of mean grain dry weight (mg) with (a) nitrogen (%; × 10 for g/kg) (r = −0·76; P < 0·001) and (b) sulphur (%; × 10 for g/kg) (r = −0·36; P < 0·05) concentration of grains of wheat cvar Tybalt in 2012.

Hagberg falling number was reduced by all but the last of the rain shelter treatments (S4) and also, but to a lesser extent, by two of the wetting treatments (W1 and W4) in 2011 (Table 4). The treatments did not affect HFN significantly in 2012, but all treatments (shelter and ear wetting) provided estimates greater than the control. The control result for 2012 was also lower than that for 2011.
Estimates of SDS-sedimentation volumes were reduced significantly (P < 0·05) in all five rain shelter treatments in 2011. The effect of ear wetting was variable and only significant, a reduction, in one case (W3; P < 0·05). Comparison among controls and annual means showed greater SDS volumes in 2012 than 2011.
The incidence of blackpoint was greater in 2011 than 2012 and both years provided similar and consistent treatment responses. Blackpoint was increased by wetting treatments and reduced under rain shelter (Table 4). The greatest reduction in the incidence of blackpoint occurred with rain shelter throughout in both years and the greatest increase with multiple wettings in 2011 and wetting at 70 DAA (W5) in 2012.
DISCUSSION
There is no doubt that rainfall, or its absence, can affect wheat grain quality, but the objective of the current paper was to determine whether altering the environment of developing and maturing ears in field-grown crops, and the timing of intervention, could be shown to affect grain quality. The treatments did affect the dynamics of grain filling and desiccation, provided in the former case they were applied before mass maturity. The effects on grain quality were clear and consistent for blackpoint, but far more difficult to discern for the remaining traits with some responses contrary to expectations from known associations between the inter-annual variations of grain quality and weather.
The use of the Gompertz function to quantify the dynamics of grain desiccation (Gooding et al. Reference Gooding, Ellis, Shewry and Schofield2003; Pepler et al. Reference Pepler, Gooding, Ford and Ellis2005) and of the broken-stick model to quantify the dynamics of grain filling (Sofield et al. Reference Sofield, Evans, Cook and Wardlaw1977; Renwick & Duffus Reference Renwick and Duffus1987; Rasyad et al. Reference Rasyad, Vansanford and TeKrony1990; Pieta Filho & Ellis Reference Pieta Filho and Ellis1991; Ellis et al. Reference Ellis, Hong and Jackson1993; Gooding et al. Reference Gooding, Ellis, Shewry and Schofield2003) were each appropriate here (Figs 2–5). Grain desiccation is typically sigmoidal in form. Grain dry matter accumulation, however, sometimes shows a linear increase with a sharp transition to a plateau (as above), but in other cases the data follows a distinct sigmoidal pattern (Egli Reference Egli1998, Reference Egli2004; Wardlaw et al. Reference Wardlaw, Blumenthal, Larroque and Wrigley2002). The current authors suggest that the suitability of broken-stick models indicates a strong degree of temporal uniformity among grain within each treatment in the current small plot study: if grain filling in each individual grain follows a broken-stick model, then high temporal variability in filling among individual grains would, inevitably, provide an S-shaped curve for the whole population.
The rate of grain filling can be affected by the position of grains within ears (Sofield et al. Reference Sofield, Evans, Cook and Wardlaw1977), cultivar (Miralles & Slafer Reference Miralles and Slafer1995; Dimmock & Gooding Reference Dimmock and Gooding2002) and environment (Wheeler et al. Reference Wheeler, Hong, Ellis, Batts, Morison and Hadley1996; Wardlaw et al. Reference Wardlaw, Blumenthal, Larroque and Wrigley2002; Gooding et al. Reference Gooding, Ellis, Shewry and Schofield2003; Zahedi & Jenner Reference Zahedi and Jenner2003). Estimates of grain filling rate were conservative in the current study, being identical for controls between the 2 years (1·63 mg/day), notwithstanding the inter-annual variation in environment, and with no significant effect of treatments within either year. Given that the treatments were not imposed until the reproductive phase of development and so canopy dry matter was invariant at the beginning of grain filling, this is compatible with the suggestion of grain filling comprising a consistent daily proportional contribution to harvest index at harvest (Moot et al. Reference Moot, Jamieson, Henderson, Ford and Porter1996; Wheeler et al. Reference Wheeler, Hong, Ellis, Batts, Morison and Hadley1996).
The effects of both rain shelter and wetting on grain filling duration, and so final grain dry weight, were significant but negligible in 2011 – the only possible temporal consistency in the latter being provided by rain shelter for both 0–56 DAA (C2S) and 0–14 DAA (S1), i.e. soon after anthesis when early cell division determines maximum cell number (Bewley et al. Reference Bewley, Bradford, Hilhorst and Nonogaki2013). Although final grain dry weight in 2012 differed significantly among treatments, the rate and the duration of grain filling did not. The absence of any significant effect of rain shelter treatments S1–S3 or of wetting treatments on grain filling dynamics in 2012 was not unexpected as they were not provided until after mass maturity, but the increase in final grain dry weight for rain shelter from 0 to 70 DAA is difficult to explain.
Water shortage during grain filling accelerates leaf senescence and so shortens the grain-filling period (Gooding et al. Reference Gooding, Ellis, Shewry and Schofield2003; Egli Reference Egli2004). Nevertheless, there is no real conflict with such results from imposing drought, because in the current study it was neither imposed nor relieved deliberately: treatments were targeted at the ears, the site has a high water table, both years were comparatively cool and wet, and run-off from rain shelters infiltrated the soil. Nevertheless, duration of grain filling and final grain dry weight were correlated positively within each year. This explained much of the variation among treatments, but two sheltered treatments in 2012 (C2S and S2) were outliers showing considerably greater final grain dry weight.
Ellis & Pieta-Filho (Reference Ellis and Pieta-Filho1992) reported grain moisture contents at mass maturity of 400–480 g/kg (mean 440 g/kg) in four wheat varieties. These estimates (mean of all treatments) were similar in the current work: 474 g/kg in 2011 and 443 g/kg in 2012. The latter varied significantly in 2012 (but not in 2011) and control treatments in the 2 years provided near identical estimates (476–479 g/kg). As with dry weight, treatment effects on the progress of grain desiccation were somewhat limited. Rain shelter throughout or during maturation drying (C2S, S3–4, 2011; C2S, S1–S3, 2012) resulted in more rapid grain desiccation. In the case of ear wetting, only when the immediate effects were collated in 2012 (designated W) did the period of maturation drying appear to be prolonged. Hence, ear wetting affected grain moisture content only temporarily.
The ear wetting treatment applied in the current work was a simple, crude simulation of (additional) natural rainfall. Rainfall events vary greatly in terms of, for example, duration, intensity, droplet size and velocity, and wind speed as well as volume per unit area. The treatment used in the current study most closely matched an intense, brief summer storm and contrasts with, for instance, continuous drizzle over long periods in terms of moisture penetration within the glumes and delaying grain drying. Although simple and crude, the current authors’ previous studies confirmed this experimental approach affected wheat grain moisture and also subsequent seed longevity (Ellis & Yadav Reference Ellis and Yadav2016). Wetting had no significant, or temporally consistent effects on N and S concentrations or SDS volumes – and so no direct effect on protein amount or quality. Rain shelter throughout the study period (C2S) reduced all three variables in both years, reducing the end-use value of the crop. This was also the case, to some extent, for 14 days periods of rain shelter in 2011, but not in 2012. This result from rain shelter in 2011 is contrary to reports that water stress applied before the end of grain filling increased N and CP content in wheat (Daniel & Triboi Reference Daniel and Triboi2002; Gooding et al. Reference Gooding, Ellis, Shewry and Schofield2003), but the treatments imposed in the current work were more subtle than those in drought studies (see above). Moreover, Gooding et al. (Reference Gooding, Ellis, Shewry and Schofield2003) have noted that such conclusions from controlled-environment studies may not be applicable to all field studies. Some field results (Smith & Gooding Reference Smith and Gooding1996; Clarke et al. Reference Clarke, Gooding and Jones2004) have suggested that greater rainfall increases N concentration, due to increased N mineralization in certain soils (Gooding & Davies Reference Gooding and Davies1997), but the situation is highly specific to the particular circumstances regarding the amount and timing of rainfall since heavy rain before grain filling can dilute soil N by increased leaching and the greater vegetative growth of crops (Schlehuber & Tucker Reference Schlehuber and Tucker1959; Hopkins Reference Hopkins1968; Powlson et al. Reference Powlson, Hart, Poulton, Johnston and Jenkinson1992). The S concentrations in all five rainfall-protected treatments in 2011 were either at or below the critical value for S deficiency (<1·2 g/kg) in wheat (McGrath et al. Reference McGrath, Jancso and Pichersky1993), whereas all samples in 2012 provided estimates well above this value, despite the available sulphate in soil in the spring being lower in 2012.
Notwithstanding the limited extent of treatment effects, the negative correlations of each of grain N and S concentrations with mean grain dry weight in 2012, only, is compatible with the well-known inverse relationship of protein concentration with yield per unit area (Cox et al. Reference Cox, Qualset and Rains1985; Smith & Gooding Reference Smith and Gooding1999; Triboi et al. Reference Triboi, Martre, Girousse, Ravel and Triboi-Blondel2006; Gooding et al. Reference Gooding, Kasyanova, Ruske, Hauggaard-Nielsen, Jensen, Dahlmann, Von Fragstein, Dibet, Corre-Hellou, Crozat, Pristeri, Romeo, Monti and Launay2007). Similarly, the reduction in SDS-volume by rain shelter throughout (C2S) in both years is supported by Gooding et al. (Reference Gooding, Ellis, Shewry and Schofield2003) for the effect of reduced moisture availability from just before grain filling in wheat.
All but one (rain shelter from 0–56 DAA (C2S) in 2011) of the 22 treatments provided HFN values above the commercially desired minimum threshold of 250s. Mean estimates across the UK over many years from the AHDB Recommended Lists for 2016/17 provide good HFN values of 303–311s for cvar Tybalt from spring and late-winter sowings, respectively (cereals.ahdb.org.uk/varieties.aspx, accessed 26 January 2016); similarly good mean estimates (all treatments) of 306 and 372 s were obtained for HFN in 2011 and 2012, respectively, in the current work and confirm the resilience of this aspect of grain quality in cvar Tybalt. Cool and wet weather during late grain growth and ripening, as occurred in both years, can promote pre-maturity alpha-amylase activity and so reduce HFN (Gale et al. Reference Gale, Law, Chojecki and Kempton1983; Gooding et al. Reference Gooding, Smith, Davies and Kettlewell1997; Kondhare et al. Reference Kondhare, Farrell, Kettlewell, Hedden and Monaghan2015). Gooding et al. (Reference Gooding, Ellis, Shewry and Schofield2003) reported HFN was increased by drought before the end of grain filling, and high soil moisture was associated with low HFN and so high α-amylase activity (Gooding et al. Reference Gooding, Ellis, Shewry and Schofield2003; Gooding Reference Gooding, Wrigley and Batey2010). In contrast, every shelter treatment in 2011 reduced HFN below the control and wetting had comparatively little effect. In 2012 the non-significant variation in HFN did provide a substantial, consistent increase in HFN with rain shelter but also, to a lesser extent, in all wetting treatments. The final harvest in 2011 was some 14 days after shelter treatments ended – with a heavy, atypical rainfall event during this period. In 2012, therefore, shelter treatments were provided until the final harvest. Higher N concentration grain samples can show higher estimates of HFN (Gooding et al. Reference Gooding, Kettlewell, Davies and Hocking1987; Kettlewell Reference Kettlewell1999; Clarke et al. Reference Clarke, Gooding and Jones2004; Kindred et al. Reference Kindred, Gooding and Ellis2005). This was detected in the current study in 2011 (r = 0·623; 0·10 > P > 0·05), but not in 2012, and might explain the otherwise apparently contradictory response of HFN to rain shelter in 2011.
In contrast to the preceding grain quality variables, the incidence of blackpoint responded consistently to treatments in both years, and in accordance with results where irrigation increased the incidence and severity of blackpoint (Clarke et al. Reference Clarke, Gooding and Jones2004). It was reduced by protection from rainfall, lower in the drier 2012 than 2011, lowest under shelter for the longest durations (C2S) and increased under almost all wetting treatments. No trend was detected within either the shelter or wetting treatments, however, providing no evidence of temporal variation in the environmental regulation of blackpoint.
The systematic (i.e. sequential) design with opposite (i.e. wetting v. shelter) treatments provided little or no clear, consistent evidence of simulated rainfall event effects on wheat grain quality with the single exception of blackpoint. Both years were above average in terms of summer rainfall and so well-suited for blackpoint development. In cool, wet years therefore, it can be concluded that blackpoint is the most sensitive of all wheat grain quality traits investigated to variation in moisture availability around the ears whereby a single additional 25 mm simulated rainfall event (c. 10–12% additional ‘rain’) was sufficient to increase its incidence.
Despite the undoubted and considerable influence of water status from heavy rainfall to drought on, for example, HFN and CP evident from controlled environment studies and national records, demonstrating this experimentally by altering the environment around developing and maturing ears of field-grown crops was more difficult than anticipated from the literature. Gooding et al. (Reference Gooding, Smith, Davies and Kettlewell1997) estimated that the HFN of UK wheat crops was reduced by 0·93 s/mm August rainfall, but not detectably so by rainfall in earlier months. The 2011 treatments ended in July and so all treatments received the same (high) August rainfall, but nevertheless HFN varied significantly. In contrast, and paradoxically, the non-significant variation in 2012 was compatible in large part with Gooding et al. (Reference Gooding, Smith, Davies and Kettlewell1997) in terms of both the direction and magnitude of the effect of August rainfall. Comparing the extreme treatments (thus ignoring the open control's unusually low estimate), the actual (mean of all 25 mm ear wetting treatments) and expected reductions in HFN from C2S were 43 (c. 0·7 s/mm August rainfall) and 59 s, i.e. about three quarters of the response suggested by Gooding et al. (Reference Gooding, Smith, Davies and Kettlewell1997). This is good agreement given that their data would have included what might be considered the direct effect of rainfall on ears, as investigated in the current paper, together with that via the soil and crop, and also of harvest delays (and so a longer period for germination sensu strictu to be promoted) as a result of wetter seasons.
In the current investigation, and as occurs in wheat production, the passage of time between a rainfall event and subsequent harvest at maturity provided an interregnum during which grain quality might change. Delaying harvest until 7 days after ear wetting provided a 51 s improvement in HFN (W and W5 at 70 and 77 DAA, respectively). The possible improvement in HFN with re-drying in planta requires further investigation since the damage to post-harvest seed longevity in wheat from rainfall can be reversed with re-drying in planta (Ellis & Yadav Reference Ellis and Yadav2016). Monitoring the dynamics of grain filling and desiccation was successful. Hence, quantifying the dynamics of grain quality development (e.g. HFN) might enable both the immediate effect of environment and subsequent change, such as the possible reversal of damage to HFN noted above, until harvest to be captured in future investigations.
In conclusion, blackpoint was the most sensitive grain quality trait to rain incident on developing and maturing ears but it was not possible to identify any clear temporal pattern of sensitivity to rain for blackpoint or any of the other grain quality traits investigated in the current field study. Indeed, other than blackpoint, grain quality was comparatively resilient to rain incident upon developing and maturing ears in cvar Tybalt.
The Commonwealth Scholarship Commission provided a research studentship to GY (INCS-2010-170). We thank Caroline Hadley and Richard Casebow for their considerable help.