Introduction
Dickinsonia is an iconic member of the Ediacara biota. Previous studies, aiming to shoehorn it into established taxonomic groups, resulted in a variety of proposed affinities, ranging from interpretations as an annelid, lichen, or protist, among others (Wade Reference Wade1972; Seilacher et al. Reference Seilacher, Grazhdankin and Legouta2003; Retallack Reference Retallack2007). New discoveries and techniques have produced a general consensus that Dickinsonia was an animal, likely aligned with stem or crown Eumetazoa (Sperling and Vinther Reference Sperling and Vinther2010; Gold et al. Reference Gold, Runnegar, Gehling and Jacobs2015; Evans et al. Reference Evans, Droser and Gehling2017, Reference Evans, Gehling and Droser2019a; Hoekzema et al. Reference Hoekzema, Brasier, Dunn and Liu2017; Bobrovskiy et al. Reference Bobrovskiy, Hope, Ivantsov, Nettersheim, Hallmann and Brocks2018, Reference Bobrovskiy, Krasnova, Ivantsov, Luzhnaya and Brocks2019; Dunn et al. Reference Dunn, Liu and Donoghue2018).
Despite these advances, there are conflicting interpretations of the biology and ecology of Dickinsonia. Even basic symmetry—whether modules were offset or meet precisely at the midline—remains the subject of considerable debate (e.g., Gold et al. Reference Gold, Runnegar, Gehling and Jacobs2015; Ivantsov et al. Reference Ivantsov, Zakrevskaya and Nagovitsyn2019). Many studies have focused on growth patterns, dating back to original descriptions by Sprigg (Reference Sprigg1949) and including several recent analyses (Gold et al. Reference Gold, Runnegar, Gehling and Jacobs2015; Evans et al. Reference Evans, Droser and Gehling2017; Hoekzema et al. Reference Hoekzema, Brasier, Dunn and Liu2017; Zakrevskaya and Ivantsov Reference Zakrevskaya and Ivantsov2017; Ivantsov et al. Reference Ivantsov, Zakrevskaya and Nagovitsyn2019). These support either the traditional view that modules were added at the region where they are smallest, considered the posterior (Gold et al. Reference Gold, Runnegar, Gehling and Jacobs2015; Evans et al. Reference Evans, Droser and Gehling2017; Ivantsov et al. Reference Ivantsov, Zakrevskaya and Nagovitsyn2019), or alternatively, proposals that they were instead added at the opposite end (Hoekzema et al. Reference Hoekzema, Brasier, Dunn and Liu2017). These studies vary in their approach and the types of data and numbers of specimens investigated.
To resolve these questions, we utilize newly discovered and well-preserved material from the Ediacara Member, Rawnsley Quartzite, exposed at the Nilpena Ediacara National Park in South Australia. The recently excavated “Alice's Restaurant Bed” (TB-ARB) surface contains 55 particularly well-preserved Dickinsonia costata Sprigg, Reference Sprigg1947 (Evans et al. Reference Evans, Dzaugis, Droser and Gehling2018; Fig. 1), adding to hundreds of previously collected specimens. We use this material to test alternative hypotheses of module addition and other growth patterns in D. costata.
Dickinsonia costata from TB-ARB. Triangles indicate posterior indentations, arrows indicate areas where modules appear to be incomplete, and brackets indicate three modules that merge into one across the midline. Specimens TB-ARB (A) 555 s 232e; (B) 240 s 26e; (C) 339 s 13e; (D) 316 s 66e; (E) 480 s 126e; (F) 702 s 335e; (G) 474 s 138e; (H) 667 s 385e. Scale bars, 10 mm.

Dickinsonia
Dickinsonia is ovoid to elliptical in overall shape and divided down the long axis by a midline. Serially repeated units—referred to here as modules—emanate from and are oriented perpendicular to the midline. Length refers to any feature parallel to the long axis and width regards those that are perpendicular (Wade Reference Wade1972; Evans et al. Reference Evans, Droser and Gehling2017). Although morphological terminology is almost as variable as methodology, we use that of Evans et al. (Reference Evans, Droser and Gehling2017; Fig. 1).
Associated trace fossils demonstrate that Dickinsonia was capable of movement and likely fed on organic matter lining the Ediacaran seafloor (Ivantsov and Malakovskaya Reference Ivantsov and Malakhovskaya2002; Gehling et al. Reference Gehling, Droser, Jensen, Runnegar and Briggs2005; Sperling and Vinther Reference Sperling and Vinther2010; Evans et al. Reference Evans, Gehling and Droser2019a). Muscular activity related to mobility resulted in expansion and contraction of individuals (Wade Reference Wade1972; Runnegar Reference Runnegar1982; Gehling et al. Reference Gehling, Droser, Jensen, Runnegar and Briggs2005; Evans et al. Reference Evans, Gehling and Droser2019a,Reference Evans, Huang, Gehiling, Kisailus and Droserb; Hoekzema et al. Reference Hoekzema, Brasier, Dunn and Liu2017). Specimens found in multiple depositional environments and a variety of taphonomic states highlight the resiliency and flexibility of relatively thick tissues (Gehling and Droser Reference Gehling and Droser2013; Evans et al. Reference Evans, Huang, Gehiling, Kisailus and Droser2019b).
Dickinsonia from the Ediacara Member display bilateral symmetry (although a lack of macroscopic morphological distinction between the top and bottom surfaces may suggest biradial symmetry) with anterior–posterior differentiation. It has been proposed that this terminology may imply inappropriate homology if Dickinsonia cannot be reliably assigned as a bilaterian (Dunn et al. Reference Dunn, Liu and Donoghue2018). However, the anterior is defined based on the direction of movement (Evans et al. Reference Evans, Gehling and Droser2019a) and independent of growth models. Based on the likely metazoan affinity of Dickinsonia (Sperling and Vinther Reference Sperling and Vinther2010; Gold et al. Reference Gold, Runnegar, Gehling and Jacobs2015; Evans et al. Reference Evans, Droser and Gehling2017, Reference Evans, Gehling and Droser2019a; Hoekzema et al. Reference Hoekzema, Brasier, Dunn and Liu2017; Bobrovskiy et al. Reference Bobrovskiy, Hope, Ivantsov, Nettersheim, Hallmann and Brocks2018, Reference Bobrovskiy, Krasnova, Ivantsov, Luzhnaya and Brocks2019; Dunn et al. Reference Dunn, Liu and Donoghue2018), we contend that assignment of anterior and posterior is justified and useful for comparison with similarly organized, mobile bilaterian forms. The anterior-most unit (AMU) of Dickinsonia is expressed as an undifferentiated region distinct from the rest of the divided body.
There are currently six recognized species of Dickinsonia (Sprigg Reference Sprigg1947; Glaessner and Wade Reference Glaessner and Wade1966; Wade Reference Wade1972; Keller and Fedonkin Reference Keller and Fedonkin1977; Jenkins Reference Jenkins, Lipps and Signor1992; Ivantsov Reference Ivanstov2007). We focus here on D. costata due to abundance on TB-ARB and within the Ediacara Member. Analysis of growth has been conducted on other species (Hoekzema et al. Reference Hoekzema, Brasier, Dunn and Liu2017; Zarkrevskaya and Ivantsov 2017; Ivantsov et al. Reference Ivantsov, Zakrevskaya and Nagovitsyn2019), but D. costata has been the subject of considerable research (Sprigg Reference Sprigg1949; Runnegar Reference Runnegar1982; Gold et al. Reference Gold, Runnegar, Gehling and Jacobs2015; Evans et al. Reference Evans, Droser and Gehling2017; Hoekzema et al. Reference Hoekzema, Brasier, Dunn and Liu2017). A recent study suggests that differences between D. costata and Dickinsonia tenuis Glaessner and Wade, Reference Glaessner and Wade1966 are the result of neoteny (Zakrevskaya and Ivantsov Reference Zakrevskaya and Ivantsov2017). All specimens on TB-ARB appear to represent one stage of that potential ontogeny (i.e., D. costata).
Hypotheses and Predictions for the Location of Module Addition
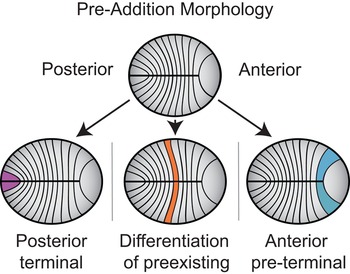
The number of modules increases with size in D. costata, indicating growth via module addition (Fig. 2) or the differentiation of new constructional units (Sprigg Reference Sprigg1949; Runnegar Reference Runnegar1982; Gold et al. Reference Gold, Runnegar, Gehling and Jacobs2015; Evans et al. Reference Evans, Droser and Gehling2017; Hoekzema et al. Reference Hoekzema, Brasier, Dunn and Liu2017; Dunn et al. Reference Dunn, Liu and Donoghue2018). Hypotheses including the generation of modules via differentiation of preexisting modules or splitting of the AMU are considered unlikely due to the relative size of these structures and a lack of morphological evidence (Evans et al. Reference Evans, Droser and Gehling2017).
Cartoon of Dickinsonia costata demonstrating hypothesized morphological positions for the location of module differentiation. Solid filled modules represent different hypotheses, including posterior terminal, differentiation of preexisting and anterior pre-terminal module addition, indicative of morphology after complete differentiation, not during the process of module addition.

Most previous studies interpreted modular addition as occurring at the posterior (Runnegar Reference Runnegar1982; Brasier and Antcliffe Reference Brasier and Antcliffe2008; Sperling and Vinther Reference Sperling and Vinther2010; Gold et al. Reference Gold, Runnegar, Gehling and Jacobs2015; Evans et al. Reference Evans, Droser and Gehling2017; Ivantsov et al. Reference Ivantsov, Zakrevskaya and Nagovitsyn2019). This was primarily based on the assumption that the smallest modules were the youngest and reached larger size via inflation. Growth models, taking into account changes in the size of multiple aspects of Dickinsonia modules, are consistent with posterior addition (Evans et al. Reference Evans, Droser and Gehling2017). Recently described specimens from the White Sea region exhibit morphological defects that occur preferentially in the posterior region, interpreted as evidence supporting posterior addition (Ivantsov et al. Reference Ivantsov, Zakrevskaya and Nagovitsyn2019, Reference Ivantsov, Zakrevskaya, Nagovitsyn, Krasnova, Bobrovskiy and Luzhnaya2020).
An alternative is that modules formed at a pre-terminal generative zone between the AMU and the first anterior module (Hoekzema et al. Reference Hoekzema, Brasier, Dunn and Liu2017). Incomplete modules are hypothesized to represent organisms in the process of anterior differentiation (Hoekzema et al. Reference Hoekzema, Brasier, Dunn and Liu2017). Quantitative analysis of 16 specimens of D. costata and 4 specimens of Dickinsonia rex Jenkins, Reference Jenkins, Lipps and Signor1992 led to the interpretation that anterior addition produces more consistent growth rates of modules through life and a steady, unidirectional progression of the relative position of the widest module compared with posterior addition (Hoekzema et al. Reference Hoekzema, Brasier, Dunn and Liu2017). Further, a constant decrease in the size of the AMU relative to total area with increasing numbers of modules was inferred to support pre-terminal anterior differentiation (Hoekzema et al. Reference Hoekzema, Brasier, Dunn and Liu2017).
Hypotheses regarding posterior or anterior addition produce competing expectations. Definitive morphologies reflecting modules in the process of being added would likely represent the strongest evidence supporting any model. Module defects resulting in abnormal growth may be expected to occur closer to the generative zone (Ivantsov et al. Reference Ivantsov, Zakrevskaya, Nagovitsyn, Krasnova, Bobrovskiy and Luzhnaya2020).
Growth should result in features of increasing size and number with age. Any model requiring the loss of modules or a reduction in size should be rejected, and those with consistent growth rates are favored over those that exhibit greater irregularity (Hoekzema et al. Reference Hoekzema, Brasier, Dunn and Liu2017). The recognition that all or most modules in D. costata are inflated with overall growth (Evans et al. Reference Evans, Droser and Gehling2017; Hoekzema et al. Reference Hoekzema, Brasier, Dunn and Liu2017) complicates this assumption, as this will likely generate trends of increasing size regardless of the inferred location of differentiation. Further, the widest module in a given specimen is not located at the anterior- or posterior-most extreme, necessitating shifts in growth rates through ontogeny (Wade Reference Wade1972; Evans et al. Reference Evans, Droser and Gehling2017; Hoekzema et al. Reference Hoekzema, Brasier, Dunn and Liu2017). Thus, rates of size increase cannot be universally consistent in all modules. The position of the widest module should either be maintained or exhibit a constant trajectory in one direction (i.e., toward the anterior or posterior) with growth.
Materials and Methods
Dickinsonia and other macroscopic fossils belonging to the Ediacara biota occur within the Ediacara Member, Rawnsley Quartzite, in the Flinders Ranges and surrounding regions of South Australia. These deposits lie below a basal Cambrian disconformity and, based on similar taxa identified from the White Sea Region of Russia, are interpreted to be between 560 and 551 Ma old (Gehling Reference Gehling1999; Grazhdankin Reference Grazhdankin2014; Boag et al. Reference Boag, Darroch and Laflamme2016). The Ediacara Member consists of siliciclastic, predominately sandstone event beds with fossils found in deposits representing a range of shallow-marine environments (Gehling Reference Gehling2000; Gehling and Droser Reference Gehling and Droser2013; Tarhan et al. Reference Tarhan, Droser, Gehling and Dzaugis2017; Reid et al. Reference Reid, Holmes, Payne, García-Bellido and Jago2020; McMahon et al. Reference McMahon, Liu, Tindal and Kleinhans2020). Fossils, including Dickinsonia, are typically preserved as negative hyporelief external molds, representing impressions of the top surface in overlying sandstone beds (Gehling Reference Gehling1999; Tarhan et al. Reference Tarhan, Hood, Droser, Gehling and Briggs2016).
Hundreds of specimens of Dickinsonia from the Ediacara Member are housed at the South Australia Museum in Adelaide (denoted by P numbers). Fossils are found abundantly on excavated bedding planes at the Nilpena Ediacara National Park (denoted by a field identification based on the bed on which they occur and their relative location, represented by south and east coordinates to the nearest centimeter, e.g., TB-ARB 000 s 000e; see Droser et al. [Reference Droser, Gehling, Tarhan, Evans, Hall, Hughes and Hughes2019] for more information). Dickinsonia occurs on 37 of 39 beds at Nilpena, including TB-ARB. It has been identified in the four fossil-bearing facies identified by Tarhan et al. (Reference Tarhan, Droser, Gehling and Dzaugis2017) of the Ediacara Member in association with a diversity of other macroscopic taxa and textured organic surfaces—representing the preservation of organic mats, ubiquitous on the Ediacaran seafloor (Gehling and Droser Reference Gehling and Droser2009, Reference Gehling and Droser2013).
The TB-ARB surface was initially excavated in 2017, with results published by Evans et al. (Reference Evans, Dzaugis, Droser and Gehling2018). Subsequent excavation in 2018 uncovered an additional approximately 3 m2. The fidelity of fossils on this bedding plane is higher than is typical for the Ediacara Member due to casting by fine-grained sands and a lack of evidence for biostratinomic disturbance (Evans et al. Reference Evans, Dzaugis, Droser and Gehling2018).
We investigated 55 specimens of Dickinsonia costata from TB-ARB as well as 432 specimens from Nilpena and 556 from the South Australia Museum (Evans et al. Reference Evans, Droser and Gehling2017: supplementary data 1), including 11 used in the analysis by Hoekzema et al. (Reference Hoekzema, Brasier, Dunn and Liu2017). We examined all available D. costata; however, fossils in the Ediacara Member can be incompletely preserved (Evans et al. Reference Evans, Droser and Gehling2015, Reference Evans, Huang, Gehiling, Kisailus and Droser2019b) or located on multiple rocks, making measurements of certain features inaccurate. Of the specimens on TB-ARB, 40 are preserved in a manner that produces accurate estimates of both total length and number of modules. Additionally, 19 are completely preserved in a manner allowing measurement of all module features in >90% of the specimen (see Supplementary Data).
The majority of measurements were obtained using digital photographs and the freely available Image J software (https://imagej.nih.gov/ij). Additional measurements were collected using digital calipers either directly on fossil specimens or from latex molds. Measurements of module length at the midline and outer margin were determined using straight-line approximations, while module width was measured along the sinusoidal path from the midline to the outer margin. Total area was calculated based on the approximation of the outer morphology of Dickinsonia as an ellipse, and the area of the AMU was approximated as a parabolic triangle, estimated to be 4/3 the area of the inscribed triangle. Module area was calculated as the area of a trapezoid, with module width equivalent to height and module length at the midline and outer margin representing the short and long base lengths, respectively.
Most comparisons between models for the location of module addition utilize previous methods (Evans et al. Reference Evans, Droser and Gehling2017; Hoekzema et al. Reference Hoekzema, Brasier, Dunn and Liu2017), including direct observation of features potentially indicative of module addition as well as comparisons between total length, width, and module number. Competing models are constructed by assigning the first module (representing the oldest in the specimen) to either the anterior (for posterior addition) or posterior (for anterior addition). Using these assignments, we compare changes in module length and width between specimens. We also examine variation in the width of the anterior- and posterior-most modules, the position of the widest module, and the size of the AMU with increasing total length and/or number of modules in all appropriate specimens. These are first evaluated for decreases in size or variable positions of a given feature with increased size or module number, inconsistent with growth. Otherwise, overall consistency of growth trends is used to determine support for one model over another.
Results
Morphology and Preservation.—Despite high preservational fidelity and a lack of biostratinomic impact on Dickinsonia costata from TB-ARB (Evans et al. Reference Evans, Dzaugis, Droser and Gehling2018), we found no evidence for internal or atypical external structures. Four specimens are surrounded by a ring of positive relief (“contraction rims” of Gehling et al. [2005]; Fig. 1E, Supplementary Fig. S1) likely representing removal of the organic mat during feeding by expanded individuals (Gehling et al. Reference Gehling, Droser, Jensen, Runnegar and Briggs2005; Sperling and Vinther Reference Sperling and Vinther2010; Evans et al. Reference Evans, Gehling and Droser2019a,Reference Evans, Huang, Gehiling, Kisailus and Droserb). The most extreme example on TB-ARB demonstrates expansion to 128% in total length and 126% in total width (Supplementary Fig. S1).
Of the 55 specimens on TB-ARB, only 10 preserve all modules completely (e.g., Fig. 1A). Several specimens contain modules with clear “breaks” in preservation, that is, they do not run continuously from midline to outer margin (Fig. 1B–G). These include modules that end prior to the midline or outer margin or that are discontinuous between the midline and outer margin. The location of incomplete modules is variable with respect to anterior and posterior. Specimens with incomplete modules can still be well preserved with all aspects of morphology resolved.
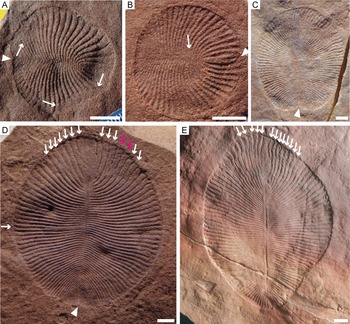
Incomplete D. costata are observed elsewhere in the Ediacara Member (Fig. 3A,B,D,E). The initial specimen cited by Hoekzema et al. (Reference Hoekzema, Brasier, Dunn and Liu2017: fig. 1) as evidence of module differentiation contains six incomplete anterior modules on either side of the midline (Fig. 3D). Two of these modules are noncontinuous between the midline and outer margin on one side of the midline (thicker magenta arrows). Additionally, a module approximately halfway between the anterior and posterior is incomplete. A second specimen cited by those authors is asymmetrically incomplete, with five incomplete modules on one side of the midline compared with eight on the other (Fig. 3E). Most Dickinsonia from the Ediacara Member, including many well-preserved examples (Fig. 3), contain discontinuous modules such that it is rare to identify specimens without any evidence for incompleteness (e.g., Fig. 3C). As with specimens from TB-ARB, these do not present a coherent trend with respect to the number or morphological position of incomplete modules.
Dickinsonia costata with incomplete modules (arrows) and indentations (triangles) at various morphological locations. Thicker arrows (magenta) in (D) indicate modules that are incomplete approximately halfway between the midline and outer margin. Specimens (A) N06-36; (B) MMB3; (C) STC-B 341 s 163e; (D) P40135; (E) P49354. Scale bars, 10 mm.

On TB-ARB, 32 D. costata contain an indentation at the posterior where the midline meets the outer margin (Fig. 1A–C,F–H, white triangles). Indentations are found near the anterior in two specimens and between the anterior and posterior in three specimens. These are distinct from lifted Dickinsonia (Evans et al. Reference Evans, Droser and Gehling2015) in a lack of preferred orientation and distortion of associated modules in non-posterior indentations. Wade (Reference Wade1972) similarly noted a “notch” at the posterior end of many D. costata. We find this feature in the posterior of at least 146 D. costata from the Ediacara Member (Fig. 3A–D), compared with 19 that have indentations at other positions, including 9 at the anterior. Posterior indentations are preferentially identified in well-preserved specimens that lack consistent indicators of expansion or contraction. A single specimen on TB-ARB contains two additional modules on one side, with three modules apparently converging into one at the midline (Fig. 1H, brackets).
Overall Size
Dickinsonia costata from TB-ARB range in total length from 5.2 to 101.5 mm with a mean value of 35.8 mm. Total width varies from 84.5 mm to 4.6 mm with a mean of 33.5 mm. Our data match previous observations for a statistically significant (r 2 = 0.95) linear relationship between total length and width (Evans et al. Reference Evans, Droser and Gehling2017). However, this ratio is much closer to 1:1 on TB-ARB (Fig. 4A). There is no preferential orientation of the long axis in these specimens, so this is unlikely due to postburial alteration (i.e., tectonic deformation).
Total length of Dickinsonia costata compared with (A) total width and (B) number of modules for specimens from TB-ARB (magenta plus signs, dashed line), including three representative specimens (stars); Hoekzema et al. (Reference Hoekzema, Brasier, Dunn and Liu2017; blue squares, dotted line) and all other D. costata from the Ediacara Member (gray circles). Gray solid trend line includes data from TB-ARB and Hoekzema et al. (Reference Hoekzema, Brasier, Dunn and Liu2017) specimens.

The total number of modules in specimens from TB-ARB ranges from 8 to 50 (although the number of modules in the largest D. costata is obscured; Supplementary Fig. S1). Module number increases with total length according to a power function, consistent with previous analysis (Evans et al. Reference Evans, Droser and Gehling2017; Fig. 4B). While this represents a significant relationship (r 2 = 0.86), considerable variation is observed within this overall trend. For example, one specimen (Supplementary Fig. S2) is found to be 185% longer and 177% wider than another (Fig. 1F) despite identical numbers of modules. The ratio of total length to number of modules from both TB-ARB and all specimens from the Ediacara Member exhibits a continuum of values; neither distinct populations (i.e., representing different species) nor distinct growth phases (Hoekzema et al. Reference Hoekzema, Brasier, Dunn and Liu2017) are apparent.
Module Size
Changes in module length at the midline and outer margin with respect to overall size for D. costata on TB-ARB match previously identified trends (Evans et al. Reference Evans, Droser and Gehling2017). Module length at the midline is consistent from anterior to posterior within a given specimen and increases with total length (Supplementary Fig. S3A). At the outer margin, module length increases from posterior to anterior, with the largest values observed at the anterior of specimens exhibiting the greatest total length (Supplementary Fig. S3B).
Module width exhibits the largest maximum values and the greatest magnitude of overall change in D. costata through ontogeny. Thus, variations in module width with respect to size have been relied upon to demonstrate growth patterns (Evans et al. Reference Evans, Droser and Gehling2017; Hoekzema et al. Reference Hoekzema, Brasier, Dunn and Liu2017). While we analyzed variations in module width in all specimens from TB-ARB, plotting all 19 is cumbersome and does not lend itself to accurate interpretations of the data (Supplementary Fig. S4). Therefore, we chose three well-preserved specimens (Fig. 1A,C,D) with increasing length, width, and number of modules, but typical total length to width and module number ratios (Fig. 4, green stars) to observe potential growth patterns.
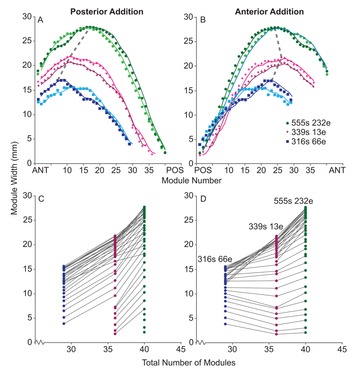
Variations in module width (Fig. 5) are consistent with previously observed trends (Evans et al. Reference Evans, Droser and Gehling2017; Hoekzema et al. Reference Hoekzema, Brasier, Dunn and Liu2017). The widest module in any given specimen is located roughly one-third of the body length from the anterior (Fig. 5A,B). This corroborates previous claims that, regardless of the location of module addition, growth rates of all modules must have been variable based on relative position within the body (Wade Reference Wade1972; Evans et al. Reference Evans, Droser and Gehling2017; Hoekzema et al. Reference Hoekzema, Brasier, Dunn and Liu2017). Due to the magnitude of module width relative to module length at the midline and outer margin, module area exhibits a similar trend (Supplementary Fig. S5).
Module width for representative Dickinsonia costata from TB-ARB for every module in the specimen with trend lines representing two point running averages (A, B) and trend lines connecting homologous modules between specimens (C, D). Compare models assuming posterior addition (A, C) with those assuming anterior addition (B, D). Gray dashed line (A, B) connects the widest module in each specimen.

When posterior differentiation is assumed, plots of module width versus module number (Fig. 5A) do not overlap, and growth lines connecting modules assumed to be homologous produce relatively consistent increases in module width (Fig. 5C). The anterior addition model produces some overlap of data near the posterior of all three specimens (Fig. 5B) and requires a reduction in the size of multiple modules at the posterior (Fig. 5D). This reflects the larger size of the posterior-most modules in the smallest specimen. For example, the posterior-most module in the smallest of these representative specimens, with 29 modules, is 3.8 mm wide and the largest specimen, with 40 modules, has posterior-most modules 2.1 mm wide. This would require an almost 50% reduction in size with growth if these modules were homologous.
Comparison of the width of the posterior-most modules with increased size for all D. costata from the Ediacara Member demonstrates that they occupy a relatively constant size range mostly independent of total length (Fig. 6A). Width of the anterior-most modules increases systematically with total length (Fig. 6B). We calculated the total number of times an increase in total length between specimens results in decreased posterior- or anterior-most module width. This represents the unlikely scenario of a reduction in module size with growth. For the 79 specimens in Figure 6, we find 970 (of a possible 3081) examples where, assuming anterior differentiation, the posterior-most modules must decrease in size with increased total length, compared with 272 for the anterior-most modules, assuming posterior differentiation.
Plots of module width for the (A) posterior-most and (B) anterior-most modules versus total length for 79 Dickinsonia costata from the Ediacara Member for which accurate estimates of each could be attained. Module widths are plotted for each side of the midline, and colors in A and B represent the same specimen. Thus, for each specimen of a given length, there are four possible data points.

In specimens on TB-ARB, we find a consistent posterior progression of the widest module with increased length when posterior differentiation is assumed (Fig. 5A, gray dotted line). This is not the case under an anterior addition model, in which the trajectory of the position of the widest module must reverse from an anterior to posterior direction (Fig. 5B, gray dotted line). The position of the widest module in all D. costata from the Ediacara Member demonstrates a generally consistent trend (Supplementary Fig. S6) with a slightly stronger correlation under a posterior addition model (r 2 = 0.57 for posterior addition vs. 0.51 for anterior addition). We determined the total number of examples where the widest module must change trajectory to grow into one of greater total length for the 79 specimens in Supplementary Figure S6. Addition at the posterior results in 593 (of a possible 3081) examples of such reversal, compared with 563 for anterior addition.
The AMU
The length of the AMU in D. costata increases consistently with total length (Supplementary Fig. S7A), while width appears to be more variable (Supplementary Fig. S7B). Dickinsonia from TB-ARB apparently exhibit no relationship between total number of modules and the relative area of the AMU (Fig. 7). However, when the entire available dataset is included, there is a clear power function relationship consistent with previous results (Hoekzema et al. Reference Hoekzema, Brasier, Dunn and Liu2017). The apparent lack of relationship results from specimens on TB-ARB occupying a relatively narrow portion of the overall size distribution.
Comparison of the number of modules with the area of the anterior-most unit (AMU) relative to total area for specimens from TB-ARB (magenta plus signs), Hoekzema et al. (Reference Hoekzema, Brasier, Dunn and Liu2017; blue squares), and all other Dickinsonia costata from the Ediacara Member (gray circles). Gray trend line includes data from TB-ARB and Hoekzema et al. (Reference Hoekzema, Brasier, Dunn and Liu2017) specimens.

Discussion
Expansion, Contraction, and Total Module Numbers.—A larger sample is always preferred when available, but the Ediacaran fossil record commonly contains rare taxa for which a significant number of specimens may not be attainable. Comparison of all specimens from the Ediacara Member and two subsets (those from TB-ARB and Hoekzema et al. [Reference Hoekzema, Brasier, Dunn and Liu2017]) suggests mixed results. The consistent linear relationship between total length and width in Dickinsonia costata (Sprigg Reference Sprigg1949; Runnegar Reference Runnegar1982; Retallack Reference Retallack2007; Evans et al. Reference Evans, Droser and Gehling2017) is reproduced in smaller datasets, and minor differences are unlikely to meaningfully skew interpretations of growth patterns.
Both small and large sample sizes reveal a similar relationship between total length and number of modules in D. costata. However, smaller datasets may underrepresent the total degree of variability when all specimens are considered. Independent indicators suggest that the magnitude of expansion and contraction is less than the entirety of variation observed between specimens on TB-ARB. Rare examples of D. costata from elsewhere in the Ediacara Member and associated trace fossils demonstrate expansion of individuals to two times total length (Runnegar Reference Runnegar1982; Evans et al. Reference Evans, Huang, Gehiling, Kisailus and Droser2019b). However, these do not match the maximum threefold difference in total length observed between different specimens with the same number of modules (Evans et al. Reference Evans, Droser and Gehling2017). Dickinsonia costata with such variability do not contain consistent indicators for expansion in larger specimens or contraction in smaller specimens (Supplementary Fig. S8).
Trace fossils of D. costata are consistently larger than body fossil progenitors, suggesting that they represent individuals expanded to increase surface area while feeding (Evans et al. Reference Evans, Gehling and Droser2019a). Thus, it is reasonable to assume that trace fossils represent D. costata in approximately the same state of relative expansion, confirmed by the similar size of successive traces left by the same individual (Ivantsov and Malakhovskaya Reference Ivantsov and Malakhovskaya2002; Gehling et al. Reference Gehling, Droser, Jensen, Runnegar and Briggs2005; Sperling and Vinther Reference Sperling and Vinther2010; Evans et al. Reference Evans, Gehling and Droser2019a). Three previously published specimens (see Evans et al. Reference Evans, Gehling and Droser2019a: figs. 4f,g, and 6d) all contain between 27 and 29 modules but are associated with trace fossils of 13, 25, and 51 mm in total length, respectively, demonstrating similar variability to that observed in body fossils. It is unlikely that differences between body size and module number in D. costata entirely reflect expansion and contraction.
One possible explanation for variation in D. costata module number is that environmental differences (e.g., temperature, oxygen availability, salinity, pH) caused variations in growth rate. However, D. costata preserved on the same bed (e.g., TB-ARB), living under similar environmental conditions, exhibit considerable variation. We suggest instead that this variation is due to a lack of developmental synchronization. This lack of consistency between module number and body size in D. costata is not necessarily surprising. Similar variation is observed in modern segmented organisms (although we do not wish to imply that Dickinsonia was necessarily segmented or a crown bilaterian). For example, in certain polychaetes, synchronization is lost in later developmental stages, producing different numbers of segments in siblings living in the same, controlled laboratory conditions (Fischer and Dorresteijn Reference Fischer and Dorresteijn2004; Fischer et al. Reference Fischer, Henrich and Arendt2010).
Growth in Dickinsonia clearly involved the addition of modules. However, variability in module number relative to body size calls into question the validity of growth models that assume contemporaneous specimens with different module numbers fall along the same growth trajectory. This is corroborated by the fact that plots of module width versus module number for a select set of specimens can produce overlap and changes in the trajectory of the widest module assuming either anterior (Supplementary Fig. 5B) or posterior differentiation (Hoekzema et al. Reference Hoekzema, Brasier, Dunn and Liu2017: fig. 3iii). Similarly, this variability is likely responsible for the inferred change in gradient with respect to the rate of module addition in Dickinsonia (Hoekzema et al. Reference Hoekzema, Brasier, Dunn and Liu2017), better described as a continuum when all specimens are considered.
Polarity
Module addition at the anterior was proposed as evidence for redefining axial polarization in Dickinsonia, because bilaterians typically differentiate serial units at the posterior (Hoekzema et al. Reference Hoekzema, Brasier, Dunn and Liu2017). The observation that Dickinsonia moves in a specific, preferred direction (Gehling et al. Reference Gehling, Droser, Jensen, Runnegar and Briggs2005; Sperling and Vinther Reference Sperling and Vinther2010; Evans et al. Reference Evans, Gehling and Droser2019a) allows the assignment of anterior and posterior independent of growth (see Fig. 2). The fact that bilaterians typically add units at the posterior end (Jacobs et al. Reference Jacobs, Hughes, Fitz-Gibbon and Winchell2005; Gold et al. Reference Gold, Runnegar, Gehling and Jacobs2015) supports posterior differentiation. This is complicated by the recognition that “terminal” addition in bilaterians is typically not at the posterior-most extreme but rather at a “sub-” or “pre-terminal” generative zone (Jacobs et al. Reference Jacobs, Hughes, Fitz-Gibbon and Winchell2005; Hoekzema et al. Reference Hoekzema, Brasier, Dunn and Liu2017). However, this may corroborate previous claims that Dickinsonia represents a stem-group bilaterian.
Evidence for the Location of Module Addition
Incomplete modules in Dickinsonia are common, occurring in nearly all specimens, including some of the best-preserved specimens. The distinct lack of consistency in the expression, number, and morphological position of all such instances of incomplete modules (e.g., Figs. 1, 3) is contradictory to expectations if these represented Dickinsonia preserved during new module differentiation.
Rare examples with incomplete modules at the anterior also contain several such modules not limited to the anterior (Fig. 3D) and occurring asymmetrically about the midline (Fig. 3E). These would indicate the addition of multiple modules simultaneously at various locations. We consider this unlikely, especially given the relatively large size of these specimens, interpreted to represent a later growth stage wherein module addition slowed relative to inflation (Evans et al. Reference Evans, Droser and Gehling2017; Hoekzema et al. Reference Hoekzema, Brasier, Dunn and Liu2017; Zakrevskaya and Ivantsov Reference Zakrevskaya and Ivantsov2017; Fig. 4B). Other previously cited specimens (Hoekzema et al. Reference Hoekzema, Brasier, Dunn and Liu2017) lack any evidence for anterior-specific module incompleteness (Supplementary Fig. S9). The most parsimonious interpretation is that all incomplete modules are taphonomic in origin, representing imperfect preservation rather than any meaningful biologic signal.
The discovery of a single specimen on TB-ARB with two additional modules on one side of the midline could be evidence of asymmetrical module addition between the posterior and anterior. This would imply that Dickinsonia added multiple modules simultaneously, in this case only on one side of the specimen. We would also expect to find more examples of such asymmetry than the single specimen reported here if this was the location of module differentiation. It is difficult to envision a taphonomic scenario leading to the apparent formation of additional modules. This feature is more likely a growth defect. The identification of congruous, bilaterally symmetrical modules located directly posteriorly and anteriorly from atypical modules in this specimen suggests that this was a nonfatal malformation. Position within the body could fit either addition model, with deformation occurring earlier in life for anterior differentiation. However, such asymmetry may have had negative impacts on factors essential to the functioning of Dickinsonia, such as mobility. We support previous interpretations (Ivantsov et al. Reference Ivantsov, Zakrevskaya, Nagovitsyn, Krasnova, Bobrovskiy and Luzhnaya2020) that the preferential posterior location of such defects is consistent with posterior addition.
A majority of D. costata on TB-ARB, as well as numerous examples from the Ediacara Member, contain an indentation at the posterior end (Figs. 1, 3, white triangles). Unlike incomplete modules, this feature occurs preferentially in well-preserved specimens and in a particular morphological region, suggesting a biologic rather than biostratinomic origin. A possible explanation for posterior indentations is that newly added modules were initially small, requiring rapid growth to match that of adjacent modules, temporarily resulting in an imperfect, elliptical outer margin.
Our results do not support previous interpretations that more stable growth trajectories accompany the anterior differentiation model (Hoekzema et al. Reference Hoekzema, Brasier, Dunn and Liu2017). Both models produce variability, which is expected based on inconsistencies in module number relative to body size. Despite this, the anterior addition model necessitates a significantly greater frequency of decreased size of the oldest modules with growth (Figs. 5D, 6). We consider this strong evidence to reject differentiation of new modules at the anterior.
Increased width of the anterior-most modules with increased size was suggested by Hoekzema et al. (Reference Hoekzema, Brasier, Dunn and Liu2017) as evidence for anterior addition whereby progressively larger modules differentiated with growth. However, anterior-most modules would also increase consistently throughout life due to module inflation if they were the oldest in the specimen. Modules added at the posterior end would be expected at various states of addition (i.e., exhibit variable widths depending upon whether they were recently added or not) somewhat independent of total size, as is observed here.
Specimens from TB-ARB do not display any relationship between total module number and the relative area of the AMU, reflecting the small number of specimens in this subsample. As previously suggested, the size of the AMU clearly decreased relative to overall body size with increasing numbers of modules (Hoekzema et al. Reference Hoekzema, Brasier, Dunn and Liu2017). It is unclear why this would support one model over another. Instead, as D. costata grew, it added modules, resulting in an increasing proportion of the total area occupied by modules relative to that of the AMU. Variability of the width of the AMU could support pre-terminal, anterior addition with specimens preserved at different states of module addition. This relationship could also be explained by either model if inconsistencies in the number of modules versus total length were accommodated by variability in the size of the AMU.
The most parsimonious interpretation of the available data suggests that module differentiation occurred at the posterior of D. costata (Table 1). Evidence previously interpreted in favor of addition at the anterior (Hoekzema et al. Reference Hoekzema, Brasier, Dunn and Liu2017) either supports posterior differentiation as well or reflects taphonomic biases and/or irregular module numbers relative to size. Anterior addition requires numerous instances of a reduction in the size of the oldest modules, contradictory to expected growth patterns. We have identified several patterns consistent with differentiation at the posterior and no evidence to falsify this scenario.
Observations of Dickinsonia costata and relevance for hypotheses of the location of module addition. The number of examples refers to those from the Ediacara Member that support the indicated hypothesis; those in parentheses refer to the number that support the alternative. For example, we find 146 examples of posterior indentations compared with 9 located at the anterior. AMU, anterior-most unit.

Nature of Module Boundaries.—Differences in relief indicate that module boundaries in Dickinsonia represent features with greater rigidity than the modules themselves (Evans et al. Reference Evans, Huang, Gehiling, Kisailus and Droser2019b). These extend into impressions of the bottom of the organism left in the organic mat and were likely involved in the organization of musculature (Evans et al. Reference Evans, Gehling and Droser2019a), suggesting that module boundaries represent structurally integral divisions, rather than superficial features. Maintenance of shape in Dickinsonia with incomplete modules is thus consistent with their taphonomic origin, as greater morphological variability would be expected in specimens lacking such structurally integral features. Lack of polarity within modules is evidence against assignment as segments (Hannibal and Patel Reference Hannibal and Patel2013; Evans et al. Reference Evans, Droser and Gehling2017). As with “pseudosegmented” organisms today, establishment of repeated units was likely advantageous in body organization and possibly other developmental processes such as cell fate specification (e.g., Minelli and Fusco Reference Minelli and Fusco2004). Dickinsonia shares bilateral symmetry and compartmentalization with many animals, including those outside Bilateria, supporting such body organization as beneficial for factors such as locomotion and internal circulation (e.g., Finnerty Reference Finnerty2005) and not necessarily indicative of relatedness.
It is interesting to consider how such boundaries may have formed. Unfortunately, grain size, even in relatively fine sands on TB-ARB or from the White Sea region (Ivantsov et al. Reference Ivantsov, Zakrevskaya and Nagovitsyn2019), restricts definitive morphological observations of posterior-most modules in most specimens. In modern organisms, the formation of repeated units is remarkably diverse, with major differences between numbers of total units, when they form, and where they are added even in closely related taxa (e.g., Minelli and Fusco Reference Minelli and Fusco2004). Thus, identifying such features in modular Ediacaran taxa may provide limited phylogenetic information. However, the potential sub-millimeter size of obscured posterior-most modules may indicate that these formed at the cellular level, somewhat simultaneously (rather than propagating from the midline or outer margin). This may constrain the structural features (such as module boundaries or musculature) that could be present in relatively small posterior modules. This may support posterior addition, as continued growth would provide time for further development of modules, whereas the anterior addition model assumes posterior modules maintain this small size throughout life, with limited capacity for change after initial formation.
Genetic Regulation
Authors favoring contrasting views regarding the location of module addition are in general agreement that Dickinsonia was an animal of probable eumetazoan-grade complexity, exhibiting some characters consistent with a bilaterian affinity but lacking those necessary for placement within specific phyla (Gold et al. Reference Gold, Runnegar, Gehling and Jacobs2015; Evans et al. Reference Evans, Droser and Gehling2017; Hoekzema et al. Reference Hoekzema, Brasier, Dunn and Liu2017; Zakrevskaya and Ivantsov Reference Zakrevskaya and Ivantsov2017; Dunn et al. Reference Dunn, Liu and Donoghue2018; Ivantsov et al. Reference Ivantsov, Zakrevskaya and Nagovitsyn2019). However, analysis of growth provides new information regarding the development of Dickinsonia.
Metazoans commonly achieve axial polarity through antagonistic interactions between morphogen gradients (e.g., Gurdon and Bourillot Reference Gurdon and Bourillot2001; Aulehla and Pourquié Reference Aulehla and Pourquié2010). These include canonical regulatory pathways such as Wnt/β-catenin and BMP/chordin signaling, responsible for anterior–posterior and dorsoventral polarity, respectively, in bilaterians (e.g., Holley et al. Reference Holley, Jackson, Sasai, Lu, De Robertis, Hoffmann and Ferguson1995; Niehrs Reference Niehrs2010). As with bilateral symmetry, many of the regulatory elements operating in such gradients are found in non-bilaterian metazoans (e.g., Babonis and Martindale Reference Babonis and Martindale2016; Erwin Reference Erwin2020). Although the exact homology between animal axes remains unresolved (e.g., Nielsen et al. Reference Nielsen, Brunet and Arendt2018), similar signaling systems are associated with the development of such polarity (Finnerty et al. Reference Finnerty, Pang, Burton, Paulson and Martindale2004; Degnan et al. Reference Degnan, Leys and Larroux2005; Kusserow et al. Reference Kusserow, Pang, Sturm, Hrouda, Lentfer, Schmidt and Technau2005; Rentzsch and Technau Reference Rentzsch and Technau2016). This includes body patterning in poriferan larvae (Adamska et al. Reference Adamska, Degnan, Green, Adamski, Craigie, Larroux and Degnan2007), ctenophores (Pang et al. Reference Pang, Ryan, Mullikin, Baxevanis and Martindale2010), cnidarians (Finnerty et al. Reference Finnerty, Pang, Burton, Paulson and Martindale2004), and placozoans (DuBuc et al. Reference DuBuc, Ryan and Martindale2019).
In systems regulated by morphogen gradients, genetic signals emitted from a single location determine the fate of numerous surrounding cells, with antagonistic regulators emanating from the opposite region of the body (Gurdon and Bourillot Reference Gurdon and Bourillot2001; Aulehla and Pourquié Reference Aulehla and Pourquié2010; Schwank and Basler Reference Schwank and Basler2010; Averbukh et al. Reference Averbukh, Ben-Zvi, Mishra and Barkai2014). These involve complex interactions, often relying on confinement by synthesizing or degrading enzymes, and can produce a variety of responses, from binary on/off signals to complex body regionalization integrating multiple regulatory systems (Gordon and Bourillot 2001; Aulehla and Pourquié Reference Aulehla and Pourquié2010).
Morphogen gradients help maintain robust body plans despite genetic, environmental, and stochastic variance (Schwank and Basler Reference Schwank and Basler2010; Averbukh et al. Reference Averbukh, Ben-Zvi, Mishra and Barkai2014). This is consistent with the conservation of total length relative to width in D. costata. Although primarily operating early in development, these signals can establish global regulatory boundaries conserved throughout the life of the organism (Aulehla and Pourquié Reference Aulehla and Pourquié2010; Schwank and Basler Reference Schwank and Basler2010; Averbukh et al. Reference Averbukh, Ben-Zvi, Mishra and Barkai2014) and are used to generate constant, position-independent growth (Aulehla and Pourquié Reference Aulehla and Pourquié2010; Averbukh et al. Reference Averbukh, Ben-Zvi, Mishra and Barkai2014). In Dickinsonia, this would allow differentiated rates of growth in module width between the anterior and posterior and maintenance of the relative position of this boundary (i.e., the position of the widest module) despite more than an order of magnitude increase in total body size. Patterning in Dickinsonia suggests greater complexity than is observed in morphogen gradients of earlier-diverging animal lineages, such as sponges or placozoans, and comparable to that of eumetazoans (Evans et al. Reference Evans, Droser and Gehling2017; Hoekzema et al. Reference Hoekzema, Brasier, Dunn and Liu2017). The conservation of such regulatory tools among Metazoa and similarities in developmental patterning is consistent with the use of morphogen gradients to establish polarity and regulate growth in Dickinsonia.
Conclusions
Module differentiation in Dickinsonia costata most likely occurred at the posterior. Considerable fluctuation in the number of modules relative to body size observed in D. costata is not uncommon in modern animals. A consequence of this variability is that examinations of only a few specimens can produce competing outcomes that may be resolved through investigations of larger datasets. Patterns of growth indicate the utilization of morphogen gradients to regulate development in Dickinsonia. Future studies aimed at identifying developmental processes in Ediacaran taxa (e.g., Dunn et al. Reference Dunn, Liu and Donoghue2018) will help to resolve the evolutionary context of these ancient organisms.
Acknowledgments
We thank J. Holmes for helpful discussion as well as comments by J. Vinther and an anonymous reviewer regarding this article. S.D.E. was supported by a Peter Buck Foundation Fellowship and M.L.D. by a NASA Exobiology Grant (NNX14AJ86G).
Data Availability Statement
Data available from the Dryad Digital Repository: https://doi.org/10.5061/dryad.j9kd51cd4.