

I. Introduction
“Russian business is under pressure from unreasonable and excessive regulatory burden” – these were the words of the former Head of Russian Government, Dmitry Medvedev, during the January 2019 Gaidar Forum (an influential policymaking conference in Russia). He then proceeded to read out the mandatory legal requirements for an omelette cooking process that included but were not limited to its height in centimetres, the stove’s temperature, the need to scrub the shell with vinegar, etc.Footnote 1 This somewhat humorous monologue set the tone for a new phase of regulatory reform – the so-called guillotine – representing a drastic cutting down of mandatory rules. At this point, the reform has been going for three years. This attempt to reform regulation was not the first. Governmental officials started tackling the issues associated with regulation as early as 2000 when “Strategy 2010” for the country’s ten-year development path was devised.
Nevertheless, the 2016–2019 reform appears to be more complex and comprehensive in comparison to previous efforts. A risk-orientated approach became one of the focal points of the reform of control, and supervision officially started in 2016. The key objectives of the reform again were to reduce the administrative burden. In addition, they planned to reduce the number of business-related accidental deaths, deaths from diseases and food poisoning (by 50% compared to 2017) and property damage (by up to 70% compared to 2017).Footnote 2
The quest to reform Russian regulation did not start in 2016; nevertheless, the regulatory burden persisted as one of the main issues for Russian businesses. The most significant business owner association – the Russian Union of Industrialists and Entrepreneurs – listed twenty-eight Russian regulation issues.Footnote 3 Internationals rankings – regulatory quality ranking (Worldwide Governance Indicators) in sections dedicated to Business Regulations/Economic Freedom of the World – demonstrate that this sphere declined or stagnated. Business Regulations/Economic Freedom of the World surveys demonstrate that this sphere has declined or stagnated.Footnote 4 From time to time, Putin and other functionaries had to speak on the issue.
In 2016, the reformers proposed a four-stage roadmap of inspectorate transition to a risk-orientated approach:
-
(1) The risk category has to be assigned by inspectorate agencies for controlled objects.
-
(2) Risk categories have to be changed dynamically based upon the history of accidents.
-
(3) The dynamic model from Stage (2) has to be updated using a Big Data approach.
-
(4) Use data obtained during previous stages to re-evaluate risks and enable cross-country comparisons.
Did these efforts avail to anything? Despite Medvedev’s words about “unreasonable and excessive regulatory burden”, governmental officials presented the 2016 reform as an overall success, boasting of a 6.5% reduction in scheduled inspections during the campaign’s initial stages as their main achievement. These cuts were to be coupled with the adoption of the so-called risk-orientated approach by state inspectorates. Together, the proposed measures were meant to reduce regulatory burden. We argue that the reform’s two principal components proved to be much less efficient than anticipated. Both the arithmetical reduction in the number of inspections and the risk-orientated approach did not work due to path dependency, excessive bureaucracy and biased incentives. While there was no single proverbial “monkey wrench” that marred the 2016–2019 reform, we argue instead that at least two different sabotage mechanisms existed: institutionalised incentives to “hit the numbers” described by CampbellFootnote 5 and definition wrangling as theorised by Blanc.Footnote 6
In his seminal work on reform evaluation, CampbellFootnote 7 formulated a paradox of sorts: as soon as reaching specific values for some quantifiable metric/key performance indicator (KPI) becomes a goal of a reform or a policy, one can no longer use this metric to measure its success objectively. Government officials behave like rational agents; their goal is to achieve the best possible results while conserving as much effort as possible. Thus, if a manipulation of statistics can produce a desirable result (in the form of happy higher-ups), this would be the most common course of action. This effect has already been demonstrated in the Russian context using the data from law enforcement agencies.Footnote 8 Coupled with the uncertainty characterising the life of any “street-level bureaucrat”,Footnote 9 this produces an ideal reform saboteur. We argue that the same stimuli were in place when the fight against regulatory burden began. Creating a KPI to decrease the number of inspections without changing the overall institutional setting and system of incentives for inspectorates should produce the precisely opposite result. Indeed, the success mentioned above characterised the first year of the reform and marked a solid start in a purely arithmetical regard. The number of scheduled inspections decreased by 6.5% (or 60,000 inspections). However, this progress came to a grinding halt in the following years as the reduction rate decreased. Finally, in the last reporting year (2019), the number of scheduled inspections increased by 2.2% (19,000 inspections). This result clashed with one of the reformers’ ambitious tasks – to halve the number of inspections. Nevertheless, we suspect that several detected violations provide a “measure of performance” that justifies the inspectorate’s existence and provides a perverse incentive to keep the number of inspections relatively stable.
Using the theoretical framework proposed by Blanc,Footnote 10 we demonstrate that red tape managed to enervate the reform through the definition wrangling process. Governmental officials promoted the risk-orientated approach as an example of best practices. It became a de facto motto of the reform. Nevertheless, it remained just a motto, as we will argue. The notion of risk used during the reform was a mixture of normative and bureaucratic ideas regarding whether some economic activity types entailed a greater or lesser degree of danger. That view is opposed to the fundamental risk-orientated approach that assumes that risk could be measured objectively through the accident rates for each industry or even for an individual enterprise. The risk regulation reflex (RRR) paradigm leads to puzzling outcomes as readers not familiar with Russian or post-Soviet regulation may question why spheres such as migration, education and science even deserve separate inspection bodies. Non-market economies created a situation where the quality of products and services could not be regulated through consumers’ choices; thus, regulation became the sole channel for feedback. In this system, inspectorates played the role of “internal quality control” as producers and providers were also state-owned. While modern post-Soviet countries mostly have market economies, their regulation is rooted in these approaches.
This paper demonstrates that definition wrangling and statistical manipulation were instrumental in inhibiting the Russian 2016–2020 regulatory reform. To do so, we will provide a brief overview of how current scholarship usually approaches inspections and regulatory burden in general. We will then show how risk is defined within the reform’s legal framework and explain why this definition is inherently flawed and would most likely contribute to the reform’s failure. In the final section of this paper, we use the administrative data to illustrate how institutionalised incentives employed within the Russian inspectorates combined with some overzealous activity by the Russian Government brought the reform to a grinding halt.
II. Literature review
Regulation can be burdensome, yet the public usually views it as a lesser evil, a price society pays for security and life quality. Governments around the world take different approaches to the organisation and enforcement of the rules regulating economic activities. One of the most common ways to control this compliance is inspection by governmental officials. Scholars and practitioners alike discuss the optimal configuration of this instrument extensively. How (procedurally) should we inspect? Are inspections the best way to ensure compliance? The latter question is usually perceived to be central, as the primary goal of regulation is compliance.Footnote 11
There are several normativeFootnote 12 and empirical answersFootnote 13 to this question that yield different policy recommendations. Current research provides controversial empirical results. Gray and MendeloffFootnote 14 examine the impact of the Occupational Safety and Health Administration (OSHA) inspections on workplace injuries. They demonstrate that the overall effect of OSHA inspections becomes smaller and less significant over the years. OSHA’s inspections in the construction industry show similar results for violations of any type.Footnote 15 At the same time, studies of inspection performance of California’s division of OSHAFootnote 16 and inspections of the Environmental Protection AgencyFootnote 17 arrived at opposite conclusions. Despite this controversy, most researchers agree that it is not the number of inspections but their qualities or procedures that define potential efficiency, as was demonstrated in a cross-country study of OSHA inspection impacts in countries with different regulatory traditions (the UK, Germany and France).Footnote 18
However, the procedural question usually lies at the core of every policy change since inspections remain the go-to regulations mechanism. Two fundamental regulatory dichotomies exist: scheduled versus surprise inspections and risk-orientated versus blind (total) approaches. Both dichotomies are central to understanding regulation reform in Russia. A considerable body of literature is aimed at determining whether surprise inspections are more efficient than scheduled inspections, or vice versa. Theoretically, a surprise regime provides all agents with pre-compliance incentives as there is a positive probability of being inspected. At the same time, the risk of so-called “information spoiling” is present. As inspectors become sole holders of information about future inspection, they can “tip-off” businesses for “compensation”. Thus, a corruption mechanism is created.Footnote 19 Dechenaux and SamuelFootnote 20 address this problem of a “moral hazard”, providing a detailed analysis of a corrupted regulatory agency. They argue that surprise inspections are ultimately superior. The “moral hazard problem” can be solved by reducing the number of inspections and raising inspectors’ wages. Other researchers posit that surprise inspections reduce the regulatory burden, demonstrating that both scheduled and surprise inspections have comparable efficiency levels when it comes to providing compliance and accident prevention.Footnote 21 In contrast, other empirical evidence supports the idea of surprise inspection as a better option for regulatory regimes.Footnote 22 In short, there is a shaky consensus amongst scholars that surprise inspections are more fitting instruments of regulation than scheduled inspections.
The second set of questions centres around whether blind (total) or risk-orientated approaches to the inspections are preferable. It is also true that former Soviet Union (FSU) countries are on a constant quest to reform their regulation. The case of Russia as the biggest FSU economy is emblematic of this issue. Scholars usually allude to the laissez-faire versus “nanny state” dichotomy/continuum when speaking about regulatory regimes.Footnote 23 A unique type of regulatory system emerged in many post-Soviet countries. Countries of the socialist block lacked both democratic procedures and market economies in most of the twentieth century.
Nevertheless, the need to regulate existed even in “People’s democracies”.Footnote 24 Blanc labelled the regulatory policies employed by the FSU countries as the RRR. He argued for a politically and economically motivated drive to move away from the RRR in most FSU countries, including Russia. According to him, a risk-orientated approach remains the main alternative to this burdensome regulatory philosophy. The current paper provides an overview of Russia’s ongoing regulatory reform, which started almost half a decade ago. We focus on how Russian regulation changed in terms of procedures and how the administrative data reflected this. We argue that the positive change was insubstantial; on the contrary, the reform probably led to several undesirable consequences (eg a turn towards more direct governmental control over inspectorates). We also argue that “red tape” sabotaged this reform along the lines of the theoretical model proposed in Blanc’s seminal paperFootnote 25 on the matter. This insight provides the necessary theoretical framework to analyse the efforts to reform RRR systems.
The RRR is an extreme version of the “nanny state” – a “brooding state”, for the lack of a better term. Under the RRR paradigm, every risk, regardless of its significance, plausibility or probability of occurrence, is worthy of regulation and elimination, no matter the cost. Thus, efforts to ensure compliance are unrelated to the actual risk. While natural in command economies, where every venture is state-owned, this may be burdensome for any private company in a market economy.
Modern Russia is a prime example of this approach. The Russian business community often cites the heavy regulatory burden it faces, which defines the slow growth of the nation’s economy, among other significant factors. Publicly, both business and government officials denounce RRR-type policies as a harmful legacy of the administrative-command system that does not fit with modern market economies. They argue that it is a significant obstacle for economic growth, with “red tape” and corruption being by-products of FSU countries’ regulatory heritage.Footnote 26 In recent years, there have been several reforms attempted to dismantle the RRR. Nevertheless, despite this rhetoric, Russian regulatory policies remain very restrictive and consume many resources.Footnote 27
III. Regulatory risk in Russia
BlancFootnote 28 explains how policymakers’ understanding of risk defines how they conduct a move from the RRR to a risk-orientated approach and whether it will occur at all. There are three possible ways to interpret risk, two of which cannot potentially complicate or sabotage reform:
-
(1) Risk as a probability of non-compliance with rules;
-
(2) Risk as a political priority (ie the risk is something that creates fears/concerns among the general populace and political actors regardless of how real or present the danger is);
-
(3) Risk as an actual probability of an accident or undesirable outcome.
By relying on types (1) and (2), the definition of risk is not inherently problematic, as rules can, in theory, adequately represent the structure of a risk (and the same goes for public opinion). However, these two sources usually provide biased or even misguided ideas on what is dangerous and how these risks should be regulated. Type (3) provides policymakers and society with clear metrics on what spheres of industry/particular businesses should be inspected more or less rigorously. This approach both conserves public resources (as an inspection has its costs) and reduces regulatory burden (as businesses with a low predicted probability of risk would be inspected less often and less intensively).
In the case of the Russian regulatory reform (2016–2019), both type (1) and type (2) strategies were used. The principal legislationFootnote 29 on the matter defines risk as a probability of non-compliance:
 $$R = Gp,$$
where R is a risk, G is the potential gravity of the accident and p is the average probability of the accident’s occurrence. In turn,
 $$G = UM,$$
where U is potential harm and M is the total population potentially affected.
While the proposed formulae do look like fairly standard ones, they use the number of detected violations instead of actual accidents. This is to be expected, as a national registry of accidents and emergencies does not exist, and as alternative inspectorate agencies themselves were asked to define “the undesirable outcomes”. Naturally, they used the only data available – their administrative reports on inspection results. For example, the normative level of individual fire risk (risk of death in a fire) diverges from its actual value by order of magnitude. Even countries enjoying the best levels of fire safety (eg Norway or Finland) do not meet this impossibly high standard. Russia, on the other hand, is the leader in per capita terms of victims of fires in Europe.Footnote 30 Thus, Russian regulation prioritises the adherence to formal rules as opposed to real-life consequences (eg injuries, damages, accidents, etc.). This approach is prevalent in most FSU countries.Footnote 31 Regulation is omnipresent and targets the business processes (eg how omelettes should be made) as well as (or even more than) their final product. This setup makes “compliance on paper” very important both for businesses and for watchdogs.
Again, this approach is not inherently problematic as long as we are sure that the rules reflect the structure of actual risks. Unfortunately, as we know from Medvedev’s admission, the rules are antiquated, overabundant and are to be radically reduced.
At the same time, political prioritisation of the risk, or the type (2) definition of risk, also became the staple of this reform. A cursory look at the so-called “danger levels” used by one of the most vigorous inspectorates (State Fire Inspection; SFI) reveals that places such as schools are classified as “Level 2”. To put things into perspective, SFI is responsible for at least one-third of all inspections. They designated “Level 1” (the highest level possible) to nuclear power plants. Schools share “Level 2” with dangerous industrial objects such as oil refineries. This focus on schools is one part of government policies directed at the “protection of children, childhood, and family”. While a particular risk does exist at schools, it is difficult to imagine that it holds as much danger as an oil refinery.
Another form of this prioritisation is “direct governmental commissions”. Usually, some tragic and widely publicised event (eg the 2018 fire at “Zimnyaya Vishnya” mall that killed more than forty people, most of them children) initiates a massive wave of inspections under direct orders from the government. Governmental officials use these actions to quell public fears and appease anger. This manual risk prioritisation also leads to inefficient workforce allocation by inspectorates. Given that the number of inspectors and their working hours are limited, businesses with higher risk levels will receive more attention. Thus, the places of political importance (eg schools, kindergartens or hospitals) will be inspected more often that one might expect, given their place in the nation’s economy or history of accidents.
IV. Data and results
1. Data
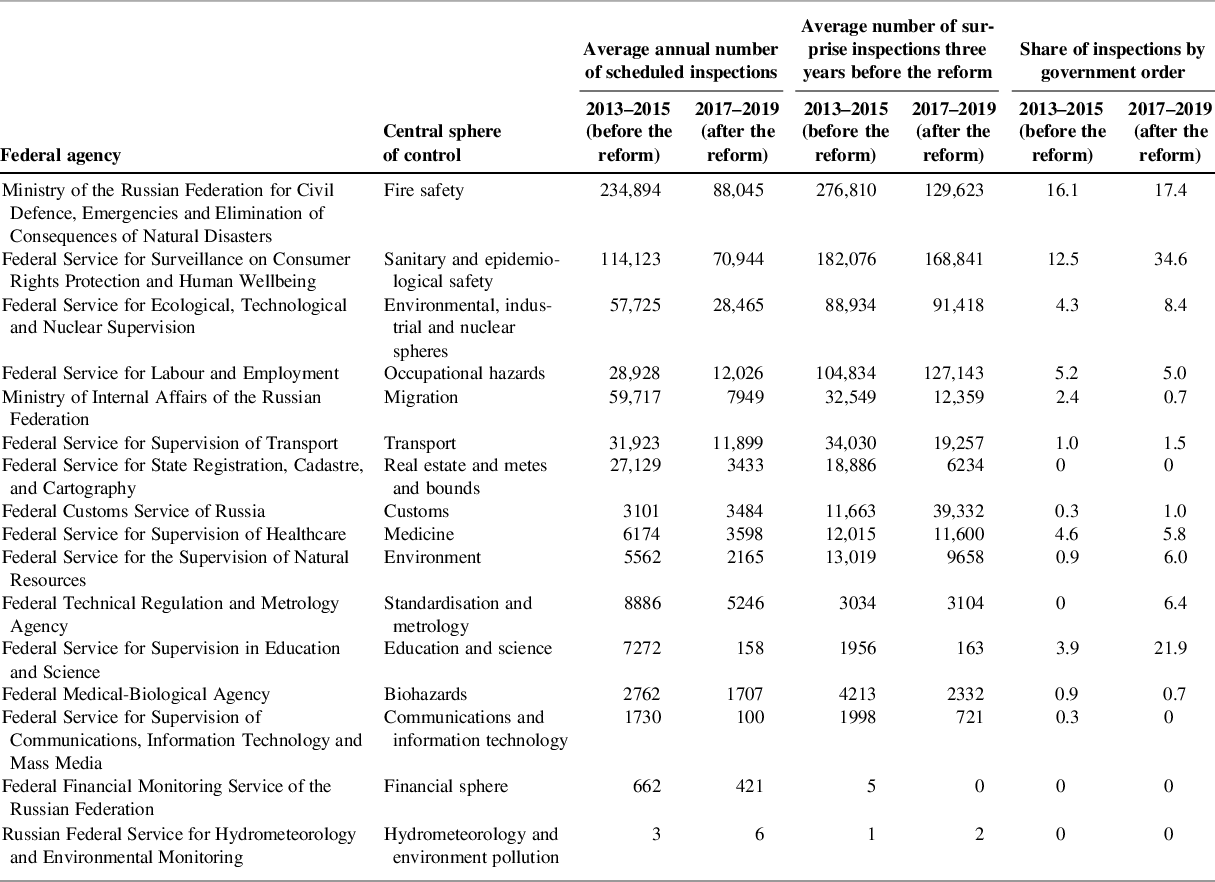
In this paper, we use aggregate information on the number of inspections conducted by Russian federal agencies in 2011–2019. This information comes from a special form, “1-Control”,Footnote 32 which agencies submit to the country’s Ministry of Economic Development.Footnote 33 In total, our panel includes 11,188,912 inspections by sixteen federal agencies (a list of all agencies with full names is given in Table 1). We utilised the data from sixteen federal inspectorates that reported their activities every year with no interruptions. Those sixteen agencies were responsible for over 90% of all the inspections that took place in the period under study.
Summary statistics.

Note: In April 2016, some of the Ministry of Internal Affairs of the Russian Federation inspections were relegated to the National Guard of the Russian Federation; thus, to obtain the comparable results, we summed their inspections. We count the average number of inspections “before the reform” for the period of 2013–2015 and “after the reform” for the period 2017–2019.
As it is an administrative dataset with high-level aggregation, its contents have to be approached with caution. Fortunately, previous scholarship already attested to this dataset’s reliability.Footnote 34 We also compared “1-Control” data and inspection/entity-level data with a balanced panel of regions and selected agencies found in Kudryavtsev et al.Footnote 35 Comparing the aggregate results with inspection/entity-level data also does not reveal any significant difference. The results of these tests demonstrate that these administrative data are relevant and reliable.
We take the Federal Taxation Service (FTS) out of our calculations. Given that the FTS’s inspections were beyond the reform’s scope and its activities happen off-site via electronic systems, this inspectorate effectively represents up to one-third of all regulatory activity. We decided to drop the FTS from our sample as this type of regulation is very particular and is vastly different from what the other inspectorates do. Inspection appears to be a fairly exotic instrument for this particular agency (especially compared to other inspectorates). The majority of its activities are centred around so-called “document requests” – the inspectorate has a right to demand documentation concerning supervised business activities.
V. Results
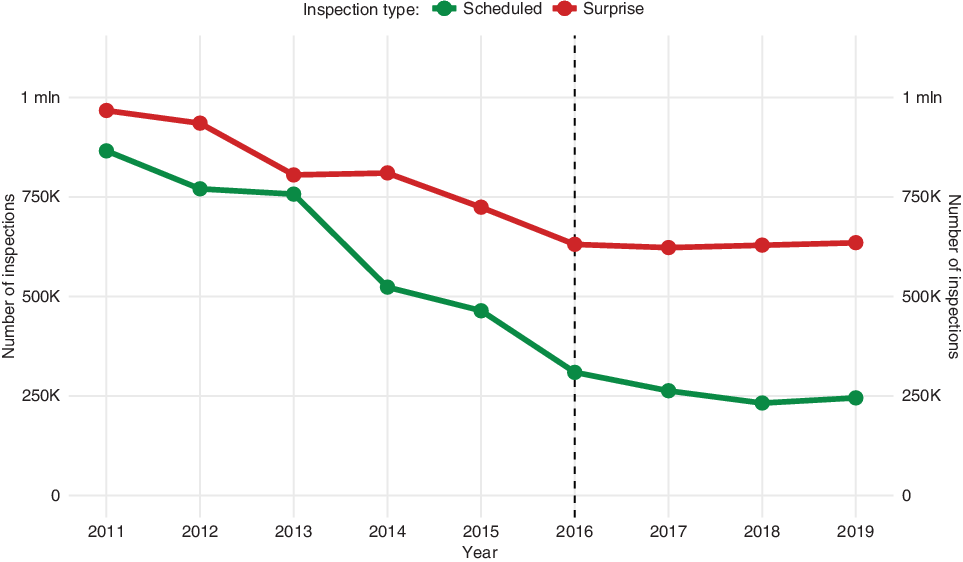
Using the aforementioned open data on inspections, in Figure 1 we plotted year-to-year inspectorate activities. One of the reform’s core goals was to optimise the regulatory burden and inspect legal entities using the risk-based approach. Minimisation of scheduled inspections was supposed to be the primary target. Nevertheless, Figure 1 demonstrates that the reform was mostly a failure in this regard as it had not reduced the number of inspections significantly. The initial success in the first year of the reform, when the number of scheduled inspections decreased by 6.5% (or 60,000 inspections), came to a grinding halt in the following years as the reduction rate decreased. Finally, in the last reporting year (2019), the number of scheduled inspections increased by 2.2% (19,000 inspections). This clashes with the ambitious goals proposed by the reformers – that is, to halve the number of inspections.
Overall number of inspections by inspection type.
Note: Data come from the reports of sixteen agencies. The dashed line marks the start of the new wave of regulation reform in the year 2016.

Probably the most interesting result comes from the historical perspective. Paradoxically, the declining trend that existed before the reform seems to be slowed, halted and then even reversed during the reform. One could expect that numbers of inspections would follow the number of business entities and other organisations. However, this was not the case. This trend existed even despite the overall reduction in the number of businesses and other types of organisations – the main targets of regulation – that took place by the end of the 2010s.Footnote 36 This contraction of businesses and other entities could have explained the reduction of inspections before 2016, but the number of organisations continued to decline, while the number of inspections, after a brief setback, resumed their (albeit not very significant) growth. Thus, the trend presented in Figure 1 is a conservative estimation. The growth of the number of inspections correlates with the reduction in the number of organisations.
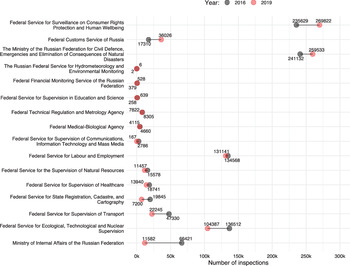
We couple Figure 1 with Figure 2 to provide additional evidence that the reform did not have a desirable impact in the case of most inspectorates (with several exceptions that cannot affect the overall trend). The two most active inspectorates that receive the most criticism from the business community – the Federal Service for Surveillance on Consumer Rights Protection and Human Wellbeing and the Ministry of Emergency Situations – actually became more active by the end of reform.
The number of inspections by federal agencies in 2016 and 2019.

This trend did not correlate with the number of inspectors as none of the watchdogs were downsizing significantly during the period in question. Somehow, the regulations reformed themselves outside of the intervention period, but this process was disturbed by the reform. While we cannot say exactly why this change took place, it is evident that it did stop right after the reform’s beginning.
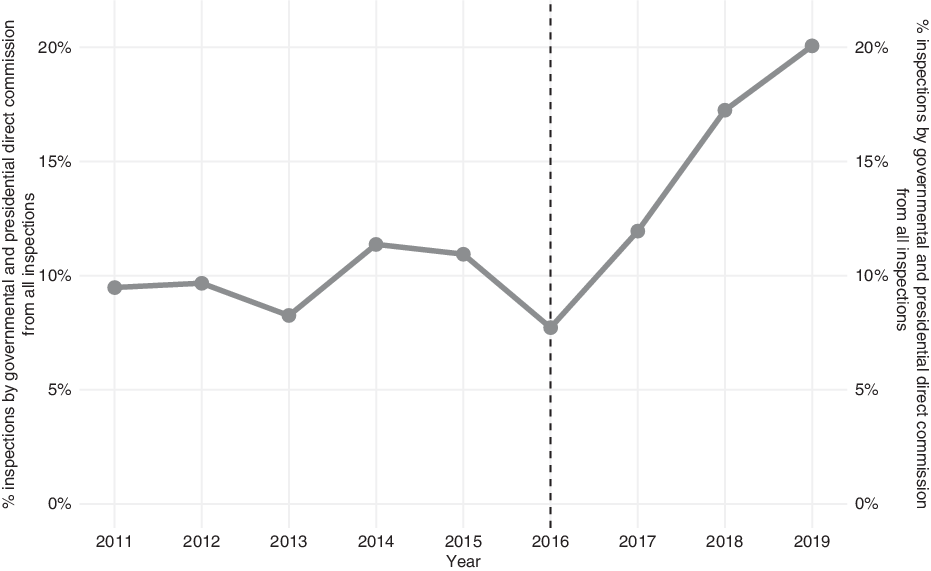
Moreover, Figure 3 demonstrates that this tendency is strengthening, as the splitting of authority between the Government and inspectorates should have been solved in the early 2000s. The number of inspections initiated by direct commission from the Government of the President effectively doubled during the reform. Inspections turn out to be another channel of the Government’s control over the economy and an emergency intervention mechanism.
Percentage of inspections initiated by governmental and presidential direct commissions.
Note: Data come from the reports of sixteen agencies. The dashed line marks the start of the new wave of regulation reform in the year 2016.

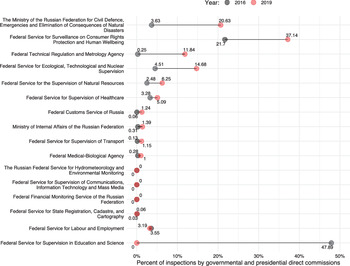
We complement Figure 3 with Figure 4 to address the possibility that this trend resulted from policy change within one or two inspectorates. Figure 4 demonstrates that this is not the case as most regulators display increasing numbers of inspections initiated by direct commission. There is a notable exception in the form of the sphere of higher education. This inspectorate acted as part of the crackdown on private colleges and universities, which took place in the mid-2010s; by 2019, the campaign was mostly over.
The percentage of inspections initiated by governmental and presidential direct commission in 2016 and 2019.

We have already mentioned the “Zimnyaya Vishnya” tragedy, a deadly accident in a Kemerovo mall. Dozens of children became victims of this fire, producing public outrage. The governmental response to this situation involved countrywide blanket inspections of retail businesses by the state fire agency. While tragedies such as this are more or less random, they tend to happen regularly given the scale of Russia’s territory and population. These situations trigger a well-oiled mechanism: (1) a tragedy dominates the news cycle; (2) public outrage builds up; and (3) the Federal Government or President orders the watchdogs to launch a surprise wave of inspections. Inspections initiated in this way represent up to 20% of all federal-level inspectorate check-ups. Thus, in 2019 alone, every fifth inspection was de facto politically motivated, further reducing the scope for the risk-orientated approach.
The “Zimnyaya Vishnya” tragedy is a case in point. President Putin initiated a blanket inspection campaign – all malls were to be inspected.Footnote 37 The Government,Footnote 38 the Ministry of Emergency SituationsFootnote 39 and the Office of the Prosecutor-General issued letters directing for the inspection of malls, multiplex cinema theatres other similar places. This campaign resulted in at least 86,000 additional surprise inspections by the Ministry of Emergency Situations and the Prosecutor General’s Office. The Ministry of Emergency Situations’ annual report claimed this to be the main driver of the inspection increase in 2018.Footnote 40 Tragedies are not the sole causes of such campaigns. Any mass participation (eg youth forumsFootnote 41 or sporting events) or even routine check-ups (eg heating system maintenance before cold seasonsFootnote 42 ) can warrant a blanket “surprise” inspection spree.
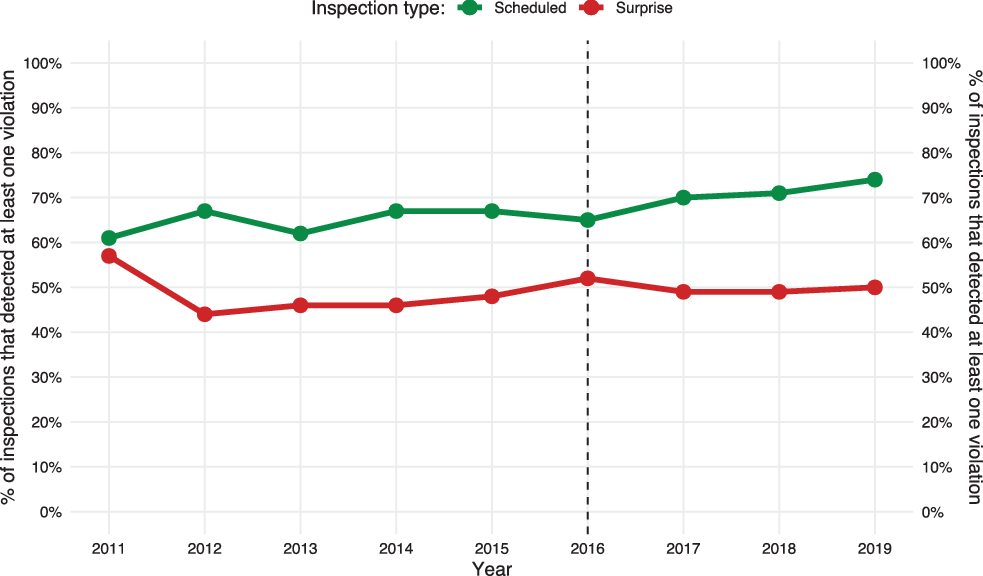
Figure 5 shows the evolution (or lack thereof) of the detection rate (the percentage of inspections that detected at least one violation). For both regimes of inspections, we do not see significant changes from year to year. This demonstrates that the detection rate stays very much the same regardless of the proposed changes, indirectly proving that these measures were either insufficient or sabotaged.
Detection rate, which is the percentage of inspections that detected at least one violation.
Note: Data come from the reports of sixteen agencies. The dashed line marks the start of the new wave of regulation reform in the year 2016.

The entity in question has minimal resources (time and otherwise) to improve its results by preparing in advance, as would be the case with a scheduled inspection. They also have to operate under severe informational asymmetry in terms of the inspector’s personality and the main emphasis of their activities. Thus, one could expect unannounced inspections to produce a higher detection rate compared to scheduled inspections. Nevertheless, this type of inspection produced a lower detection rate. This is even more surprising as the 2010s represented a turbulent time for the Russian economy as foreign exploits followed by international sanctions reshaped local businesses.
This surprising productivity of scheduled inspections and their stability can serve as indirect evidence for the KPI system’s existence. Announced inspections by design represent a more suitable instrument for planning and assessing the inspectorate’s activity, as activities and desirable outcomes can be planned in advance (eg the number of uncovered violations). One can assume that some external factor (eg administrative KPIs) exists that explains this otherwise stunning picture. The Campbell paradox (hitting the numbers as the main incentive) combined with Lipsky’s street-level bureaucrat uncertainty produces an ideal reform saboteur.
VI. Conclusion
Even though the Russian regulatory reform enjoyed public and administrative support from the political establishment at different stages, the results of its two-decades-long history are meagre at best. These top-down efforts ended up going full circle. Today, as twenty years ago, the reformers face two challenges: antiquated legislation and the murky border between the authority to create policies and to implement them. Time and time again, bureaucracy creates a new programme of reforms that provides either limited results or no results at all. The current reform demonstrates similar features. Its three-year results fail to show any significant changes in tackling the issue of regulatory burden. This failure is now recognised. A new top-down initiative – the “Regulatory Guillotine”,Footnote 43 advertised as a sort of silver bullet solution – is likely to meet the same fate.
Two main tendencies undermined the reform: conscious efforts through red tape to redefine risk in more comfortable terms and a reliance on so-called KPIs to evaluate inspectorates’ work. Real institutional change that would lead to some tangible lightening of regulatory burden would most likely be connected with either cutting down on the inspectorate discretion or massive inspector layoffs (or some combination thereof). Another strategy would involve equally massive re-education programmes for current inspectors that would turn them from controllers into consultants. None of these measures was a part of the 2016 reform design, with a risk-orientated approach being RRR under a new coat of paint.
While this paper chooses to view the Russian regulatory reform results mainly through Blanc’s approach towards post-Soviet regulatory regimes married with “Campbell’s law”, alternative explanations are possible. For instance, one could interpret the reform’s outcomes as strengthening Russian “debilitated dirigisme” tendencies, as noted by research conducted in the mid-2000s.Footnote 44 In that regard, inspections, primarily initiated by presidential or governmental direct commissions, could be viewed as a symptom of a general trend towards a directional economy.
Even keeping in mind that there is a consensus that Russia has an electoral-authoritarian regime,Footnote 45 it is possible to explain the apparent failure of the reform by blame avoidance strategies.Footnote 46 Political management’s refusal to “take the fall” for its unintended consequences, thus avoiding the implementation of any changes, may have led to the reform’s sabotage.
Current research is far from conclusive as to the issue at hand. Therefore, both qualitative and quantitative research are required in order to disentangle the complicated knot of Russian (and post-Soviet) regulation and attempts to reform it. If anything, this paper presents a puzzle that illustrates the inconsistency of the reform, its internal contradictions and its constraints.