1 Introduction
In economics, the relationship between inequality and economic growth is controversially debated. Many studies analyze the long-term effects of inequality on growth or vice versa. A large part of the current debate concentrates on trends for wealth and income inequality that are identified from the relevant data, see, for example, Alvaredo et al. (Reference Alvaredo, Chancel, Piketty, Saez and Zucman2017). Although a substantial fraction of changes in the income and wealth distribution can surely be attributed to structural changes, short-term business cycle-related changes also have non-neglectable distributional effects. Understanding how short-run fluctuations in output relate to fluctuations in inequality is important for several reasons. When assessing the empirical evidence regarding the evolution of inequality and discussing supposed structural causes, it is certainly helpful to know to what extent trends in inequality can be attributed to business cycle dynamics or if they are truly the result of structural changes. Furthermore, understanding the interactions between inequality and the macroeconomy is not just important for our understanding of aggregate dynamics but also for the design and implementation of policies.
Studies use complex incomplete markets heterogeneous agent models (HAM, HANK) to analyze this relationship (Kaplan and Violante (Reference Kaplan and Violante2018), Ahn et al. (Reference Ahn, Kaplan, Moll, Winberry and Wolf2017)). They focus not just on the distributional effects of fiscal and monetary policies (Kaplan et al. (Reference Kaplan, Moll and Violante2018), Ragot and Grand (Reference Ragot and Grand2017), Bayer et al. (Reference Bayer, Born and Luetticke2020)) but also on the causes and consequences of increasing income and wealth inequality in the USA. (Kuhn et al. (Reference Kuhn, Schularick and Steins2019), Bayer et al. (Reference Bayer, Born and Luetticke2020)). There are also studies trying to reduce the complexity of heterogeneous agent models, by using two agents, that still catch relevant parts of the macro-inequality relationship (Iacoviello (Reference Iacoviello2005), Galí et al. (Reference Galí, López-Salido and Vallés2007), Challe et al. (Reference Challe, Matheron, Ragot and Rubio-Ramirez2017), Debortoli and Galí (Reference Debortoli and Galí2017)). Clearly, analyzing the macro-inequality nexus within a full-fledged HANK model should not be replaced. However, simplifying the macro-inequality relationship can provide stylized results and general insights about the role of inequality for the macroeconomy.
Another topic that is discussed extensively is the functional income distribution, specifically its trends and fluctuations, that is, changes in the capital and labor share. As documented by Growiec et al. (Reference Growiec, McAdam and Mućk2018), functional income shares display a long-run trend and fluctuate at business cycle frequencies. Ríos-Rull and Santaeulàlia-Llopis (Reference Ríos-Rull and Santaeulàlia-Llopis2010), Mangin and Sedláček (Reference Mangin and Sedláček2018), and Cantore et al. (Reference Cantore, Ferroni and Leon-Ledesma2018) highlight that these fluctuations are linked to fluctuations in macroeconomic aggregates and have important implications for macroeconomic dynamics. To analyze the long-term development of the equity premium, Lansing (Reference Lansing2015) incorporates persistent changes in the functional income distribution into a macro model. While it seems natural to expect that the functional income distribution is linked to the personal income distribution, it is not yet examined how business cycle fluctuations in the functional income distribution are related to fluctuations in income and wealth inequality. As emphasized by Atkinson (Reference Atkinson2009), interactions between both are complex and it is difficult to disentangle how increases in the capital share translate into changes in income, and thus, wealth inequality.
The present paper contributes to the literature by connecting both strands of research in order to provide a general idea how fluctuations in functional income shares are related to fluctuations in income and wealth inequality over the business cycle. Furthermore, we assess the cyclical dynamics of standard inequality measures to understand to what extent movements in inequality are attributable to business cycles. In this endeavor, the aim of the analysis is to provide an empirical overview of the relationship and to assess how far the empirical facts can be rationalized within a simple theoretical model.
To achieve this, we proceed in three steps. First, we examine the cyclical correlation between GDP, the capital share, and the Gini coefficient of the income distribution in a panel of OECD countries for the period between 1970 and 2017. The results of the panel regressions show that, on average, the relationship between cyclical fluctuations in GDP and the Gini coefficient is statistically significant and countercyclical. Furthermore, the results also point toward a significant link between functional and personal income distributions. However, a closer look at the contemporaneous correlations between the cyclical components of GDP and the Gini coefficient reveals substantial heterogeneity across countries, that is, roughly one-third of countries in the sample, including the USA, show a rather procyclical, or at least an acyclical, relationship between inequality and GDP. In a detailed examination of the cyclical relationships for the USA, we find that the Gini coefficient of the income distribution and the capital share are about one-third as volatile as GDP. Furthermore, we observe a switching sign after around 1 year in the cross-correlations between GDP and the Gini coefficient.
In the second step, we employ a real business cycle model with agents who differ with respect to their initial productivity and wealth endowments following the approach of Maliar et al. (Reference Maliar, Maliar and Mora2005). Footnote 1 In order to incorporate cyclical variation in factor shares and inspired by work of Young (Reference Young2004), Ríos-Rull and Santaeulàlia-Llopis (Reference Ríos-Rull and Santaeulàlia-Llopis2010) and Lansing (Reference Lansing2015), we add distributive shocks to the model. In a reduced form, these shocks resemble non-Hicks-neutral productivity shocks. Within this framework, we derive analytical expressions for several standard inequality measures that define the dynamics of the cross section in terms of aggregate variables. The theoretical considerations reveal that the cyclicality of inequality depends crucially on the intertemporal elasticity of substitution and the shape of the stochastic process that induce aggregate dynamics. Furthermore, we see that TFP shocks predict that the Gini coefficients of wealth and income inequality will always move proportionally in the same direction and that a restriction to TFP shocks implies that the volatility of income inequality must always be smaller than that of wealth inequality. This highlights the importance of distributive shocks, which can induce an opposing reaction of both measures and also increase the volatility of income inequality.
Finally, to test the theoretical predictions from our model and to match the theoretical considerations with the empirical findings, we use Bayesian methods and estimate the model using data for the USA. In light of the theoretical discussion, the estimated parameter values suggest a procyclical relationship between inequality measures and GDP. This is also confirmed by the respective impulse responses, where we observe that inequality increases in response to TFP and distributive shocks. However, while the initial response of inequality measures to a TFP shock is positive, inequality starts to decline during the subsequent periods, that is, the relationship turns countercyclical in the medium term. Thus, the estimated model is also able to replicate the negative sign of lagged cross-correlations between the cyclical components of inequality measures and GDP, observed for the USA. According to a variance decomposition of the empirical model, about 85% of the cyclical fluctuations in inequality measures in the USA result from distributive shocks. Thus, our results suggest that the observed differences in the cyclical relationship between inequality measures and GDP across countries can be traced back to differences in structural parameters and distinct causes of cyclical fluctuations. Furthermore, our analysis reveals the important role of distributive shocks for short-run inequality dynamics.
The remainder of this paper is structured as follows. The second section presents the empirical findings for the group of OECD countries and the analysis of the cyclical properties of inequality measures, GDP and the capital share. The third section presents the theoretical model and the derivation of inequality measures. The fourth section discusses the implications of the model regarding the relationship between inequality and productivity shocks, as well as distributive shocks. Furthermore, it presents the results of matching the model to US data and assesses the model’s ability to replicate empirical facts. The fifth section concludes.
2 Inequality and the business cycle: empirical facts
2.1 OECD panel comparison
We start with a general assessment of the relationship between inequality and the business cycle. In the first step, we estimate a panel fixed-effects model based on annual data between 1970 and 2016 in order to highlight the relationship between the state of the business cycle and inequality in OECD countries. Thereby, we follow existing studies in explaining income inequality measured by the Gini coefficient of net disposable income. Footnote 2 As the main determinant of income inequality, we consider the natural logarithm of real GDP per capita, the squared real GDP per capita, and the degree of trade openness. Trade openness is measured as the share of imports and exports over GDP. Since we are interested in the relationship between inequality and the business cycle, we also consider the business cycle as measured by the HP-filtered GDP series. Footnote 3 Furthermore, to assess the relationship between the functional income distribution and the Gini coefficient, we include the cyclical component of the capital share. Inequality data are drawn from the UNU-WIDER Database, the data on real GDP and trade openness stem from the OECD and the data on the capital share stem from the Penn World Tables 9.0, as described in Feenstra et al. (Reference Feenstra, Inklaar and Timmer2015). Footnote 4
Our baseline estimation, presented in Table 1, confirms results from previous studies: Footnote 5 Neglecting low and medium-income non-OECD countries in the estimation cuts off the first part of the Kutznets curve, such that we observe a U-shaped relationship between income inequality and GDP per capita. Since the present analysis focuses mainly on the role of short-run fluctuations in GDP for inequality, this restriction of the sample, in favor of data quality, seems warranted and should not affect the overall conclusions drawn from this exercise. We find that trade openness is positively correlated with income inequality, but this relationship is not statistically significant, mostly because openness in OECD countries does not vary much between countries. Overall, our results largely confirm the relationship between inequality and the variables commonly examined in the literature. However, the business cycle of OECD countries, as measured by the cyclical component of GDP, is negatively and significantly correlated with income inequality on average. Although we estimate correlations, our results suggest that, in a boom situation, income inequality may shrink, while recessions could lead to increases in income inequality. For cyclical variations in the functional income distribution, we detect a positive and statistically significant correlation. This indicates that increases in the capital share are on average associated with rising inequality. Finally, by comparing income inequality over the cycle before and after redistribution policies, we find that the relationship between business cycles and income inequality becomes less countercyclical after redistribution policies. This could be a sign for the effectiveness of automatic cyclical stabilizers, that is, unemployment benefits or income tax in specific countries. Footnote 6
The relationship between income inequality and the business cycle—OECD countries, 1970–2017

 $^*$
denotes 90% significance level,
 $^{**}$
denotes 95% significance level, and
 $^{***}$
denotes 97.5% significance level. The Gini coefficient after redistribution is the net Gini coefficient of disposable household income. Before redistribution it is the Gini coefficient of market income.
While income inequality is on average countercyclical for the group of OECD countries, we draw a different picture if we focus on country-specific correlations. Figure 1 highlights the heterogeneity across OECD countries. The graph sorts OECD countries by sign and size of the contemporaneous correlation between income inequality and the business cycle. While around 50% of all countries exhibit a negative correlation, in some countries, income inequality is acyclical (e.g. Austria) if not procyclical (e.g. Germany, Switzerland).
Contemporaneous correlation between cyclical components of the income Gini and real GDP for OECD countries, annual averages between 1970 and 2017.

2.2 USA
To corroborate further on this specific pattern, we take a closer look at the cyclical relationship between GDP, the capital share, and the Gini coefficient of the income distribution for the USA. Here we use annualized data series for real GDP per capita obtained from the Bureau of Economic Analysis (BEA) and the capital share as reported by the Bureau of Labor Statistics (BLS). The time series for the Gini coefficient of the income distribution stems again from the UNU-Wider database. These series are available for a longer time period ranging from 1961 to 2016 and correspond to the series that are used in the estimation of the preceding model in Section 4. Footnote 7
Figure 2 shows the cyclical components of GDP, the capital share, and the Gini coefficient of the income distribution for the USA. The cyclical relation can be summarized by four main characteristics: First, the capital share moves rather procyclical in accordance with fluctuations in GDP. Footnote 8 Second, fluctuations of the Gini coefficient do not show such a clear pattern. Here we observe both periods where the Gini coefficient moves in tandem with GDP and periods where inequality behaves rather countercyclically. For example, during the recession in the early 1980s, we observe a decline in output, while income inequality increased, thus suggesting a countercyclical relationship. In contrast, over the expansion period, preceding the Great Financial Crisis, we observe increasing income inequality, which points toward a procyclical relationship. Third, the cyclicality of the functional income distribution measured by the capital share tend to lead movements of income inequality measured by the Gini coefficient. Fourth, we see that fluctuations in the capital share and Gini coefficient are small, compared to fluctuations in GDP.
Cyclical components of real GDP, income Gini, and capital share for the USA 1961–2016.

This general pattern is also confirmed by the respective statistics presented in Table 2. The upper panel shows the standard deviation and the contemporaneous correlations with GDP of the cyclical components for all three variables. Here we see that the variation in Gini coefficients and capital shares amounts to roughly one-third of the variation in GDP, indicating that cyclical movements in inequality are less pronounced compared to GDP fluctuations. In the second line, we observe that cyclical fluctuations in the Gini coefficient of the income distribution, as well as the capital share, are weakly procyclically related to fluctuations in GDP. Footnote 9 The lower panel shows the cross-correlations for the cyclical components of the Gini coefficient and GDP. First, note that the small positive contemporaneous correlation between GDP fluctuations and fluctuations in the Gini coefficients of the income distribution contrasts with the findings of Dimelis and Livada (Reference Dimelis and Livada1999), who document a countercyclical relationship between inequality measures and GDP for the US. This difference probably results from a different observational period. Furthermore, the cross-correlations also reveal that the dynamic relationship between fluctuations in output and inequality is characterized by sign switching. While the contemporaneous correlation indicates a nonsignificant positive association between GDP fluctuations and fluctuations in inequality, the relationship turns negative and statistically significant for the lead values of the Gini coefficient.
Characteristics of the cyclical relation between GDP, functional, and personal income distribution measures, USA 1970–2016

 $^*$
denotes 90%-,
 $^{**}$
95%-, and
 $^{***}$
97.5% significance level. Standard deviation of cyclical components of real GDP, capital share, and income Gini. Dynamic correlations of the cyclical components of real GDP and income Gini.
As discussed by Atkinson (Reference Atkinson2009), there is no clear-cut relationship between the functional income distribution and the personal income distribution. Footnote 10 How changes in the functional income distribution affect personal income inequality depends on the distribution of endowments.
In classical economics, this relationship is typically assumed to be almost perfectly correlated, which means that workers are always poor and capitalists are always rich. However, evidence shows that the relationship is more complex for two main reasons: First, households earn from different sources of income. Second, there is inequality within all categories of income. Following Atkinson (Reference Atkinson2009) variations in personal income inequality, depicted by the coefficient of variation of income
 $V^2$
, can be decomposed as follows:
 \begin{equation}
V^2=(1-\alpha)^{2}V^2_{L}+\alpha^{2}V^2_{K}+2\alpha(1-\alpha)\rho{V}_{L} V_{K},
\end{equation}
where
 $\alpha$
denotes the capital income share and
 $\rho$
denotes the correlation coefficient between wage and capital income. The first term considers the coefficient of variation of labor income
 $V^2_{L}$
, the second term the coefficient of variation of capital income
 $V^2_{K}$
, and the third term describes the covariation between both. It indicates that the functional distribution is strongly connected with the personal distribution.
Furthermore, it can be shown that an exogenous increase of
 $\alpha$
leads to increasing income inequality
 $V^2$
if
 $\alpha>(1-\rho\lambda)/(1+\lambda^2)-2\rho\lambda$
, where
 $\lambda={V_{K}}/{ V_{L}}$
denotes the ratio between variation of capital income to that of wage income.
Footnote 11
As shown in the regression analysis, cyclical movements in the capital share are on average positively associated with increases in the Gini coefficient of the income distribution for OECD countries. This finding confirms the proposed distributional arithmetic and can be rationalized if we interpret these cyclical fluctuations as a result of biased technological change, that is, labor or capital-augmenting technology shocks. Those shocks affect the functional income distribution and lead to changes in factor prices what eventually translates into changes in the personal income distribution. Thus, to understand fluctuations in the personal income distribution over the business cycle, it seems necessary to take fluctuations in the functional income distribution into account.
Overall, we interpret the empirical findings as evidence for business cycle-related fluctuations in income inequality and as an indication of the crucial role of the capital share in shaping the dynamic pattern. However, because our empirical findings cannot be interpreted as causal, we cannot rationalize the sign switch and the underlying dynamic pattern. Therefore, we augment a real business cycle model with income and wealth distributions that allow us to track the business cycle dynamics. The model also provides a structure that helps us to analyze the causal effects by identifying exogenous (business cycle and distributive) shocks. Furthermore, a pure data-based business cycle analysis of wealth inequality is very limited due to the lack of data availability, even at an annual frequency. With a structural model that tracks the observed dynamics of income inequality over the business cycle, we are able to simulate hypothetical business cycle effects on the income and wealth distribution.
3 Model
3.1 Structure of the model
The basic structure of the model is equivalent to Maliar et al. (Reference Maliar, Maliar and Mora2005). However, we add endogenous supply of labor and distributive shocks to their setting and derive analytic expressions for the Gini coefficients of the wealth and income distributions. Apart from this, we simplify the structure of the economy from the outset without affecting the main point underlying our analysis and the analysis of Maliar et al. (Reference Maliar, Maliar and Mora2005): As markets are complete and absent any restrictions on credit, the resulting allocation will be efficient and we use this to describe aggregate as well as distributive dynamics.
The economy consists of a set of agents
 $I = [0,1]$
. Agents are heterogeneous with respect to their accumulated wealth levels and their labor productivity but identical in all other respects. Wealth
 $k(i)_{t+1}$
of agent i at the end of any period t consists of physical capital and loans given to other agents. As private loans are in zero net supply, we have that individual net worth aggregates to average physical wealth
 $k_{t+1}$
, that is,
 $\int_I k(i)_{t+1} di = k_{t+1}$
. Note that we do not rule out that an agent’s net worth is negative, that is,
 $k(i)_{t+1}<0$
such that an agent is indebted. Labor productivity of agent
 $i \in I$
is denoted by e(i).
Each agent maximizes his expected lifetime utility, where preferences are assumed to be of the GHH type, that is, the period utility function of agent i is
 \[ u(i)_t = \frac{\left( c(i)_t - B\frac{h(i)_t^{1+\gamma}}{1+\gamma} \right)^{1-\eta}}{1-\eta},\qquad \gamma,\eta >0,\]
where
 $c_{t}(i)$
denotes the individual real consumption,
 $h_{t}(i)$
individual labor supply,
 $\eta$
,
 $\gamma$
, and B are parameters measuring the intertemporal substitution elasticity, the inverse Frisch labor elasticity and the relative preference for leisure.
The production side of the economy is essentially the same as in a canonical real business cycle model with stochastic shocks to technology. However, in addition to the usual technology shocks, distributive shocks—as in Lansing (Reference Lansing2015) and Ríos-Rull and Santaeulàlia-Llopis (Reference Ríos-Rull and Santaeulàlia-Llopis2010)—are included. The final output
 $y_t$
is produced by a representative firm according to the following function:
 \begin{equation}
y_t = exp(\theta_t)k_t^{\alpha_t}\tilde{h}_t^{1-\alpha_t},
\end{equation}
where the firm uses physical capital
 $k_{t}=\int_0^1\,k(i)_t\,di$
and labor in efficiency units
 $\tilde{h}_{t}=\int_0^1\,e(i)\,h(i)_t\,di$
. Here
 $exp(\theta_t)$
represents the level of productivity with
 $\theta_t$
following an AR(1) process, that is,
 $\theta_{t+1} = \rho_{\theta} \theta_t +\epsilon_{\theta,t}$
. The capital share
 $\alpha_t$
can be used as a measure for the functional income distribution.
Footnote 12
In contrast to the canonical real business cycle model, it is assumed to be stochastic with
 \[ \alpha_t = \frac{a \exp(\zeta_t)}{1+a \exp(\zeta_t)}\,, \]
where
 $\zeta_t$
represents a distributive shock that follows the AR(1) process
 $\zeta_{t+1} = \rho_{\zeta} \zeta_t + \epsilon_{\zeta,t}$
and a is a parameter that can be used to calibrate the functional income distribution.
Footnote 13
The optimization problem of the firm is then for all t given by
 \begin{equation*} \max_{k_t\,\tilde{h}_t}\, exp(\theta_t)k_t^{\alpha_t}\tilde{h}_t^{1-\alpha_t} -(R_t-1+\delta)\,k_t -w_t\tilde{h}_t\,,
\end{equation*}
where
 $w_t$
denotes the wage,
 $R_t$
the gross interest rate, and
 $0<\delta<1$
the depreciation rate.
The intertemporal problem that is solved by each agent i is given by
 \begin{equation*} \max_{\{c(i)_t,h(i)_t,k(i)_{t+1}\}_{t=0}^{\infty}} E_t \sum_{s=0}^{\infty} \beta^s \frac{x(i)_{t+s}^{1-\eta}}{1-\eta},
\end{equation*}
 \begin{align*}\text{s.t.}\qquad
R_t k(i)_t + e(i) w_t h(i)_t &= c(i)_t + k(i)_{t+1} \,,\\
x(i)_t &= c(i)_t -B\frac{h(i)_t^{1+\gamma}}{1+\gamma}. \\
\end{align*}
The competitive equilibrium is defined by the sequences
 $\{ c(i)_t, h(i)_t, k(i)_{t+1} \}_{t=0}^{\infty}$
for the consumers’ allocation, the sequences
 $\{k_t, h_t \}_{t=0}^{\infty}$
for the firm allocation and the sequences of prices
 $\{R_t, w_t\}_{t=0}^{\infty}$
, where the sequences for the consumers’ allocation solve each agent’s utility maximization problem (P-I) and the allocation plans of firms solve (P-F), such that the price of each input factor is equal to its marginal product. Furthermore, all markets clear, that is,
 $\tilde{h}_t=e\,h_t=\int_0^1\,e(i)\,h(i)_t\,di$
and
 $k_t=\int_0^1\,k(i)_t\,di$
, aggregate consumption is given by
 $c_t=\int_0^1\,c(i)_t\,di$
, where individual consumption must satisfy
 $c(i)_t\geq 0$
, and the aggregate resource constraint
 $exp(\theta_t)k_t^{\alpha_t}\tilde{h}_t^{1-\alpha_t} +(1-\delta)k_t = c_t + k_{t+1}$
is satisfied.
3.2 An aggregation result
In order to derive simple representations of the aggregate and distributive dynamics of the model, we follow Maliar and Maliar (Reference Maliar and Maliar2001) very closely and proceed as follows: First, we ignore any initial distribution of wealth holdings and just start with a given level of average physical wealth holdings
 $k_0=\int_0^1\,k(i)_0\,di$
. Given this, we show that efficient allocations for the above described economy are the solution of a simple optimization problem of a representative consumer, which implies
 $x(i)_t=\mu(i)\,x_t$
for all t, where
 $x_t=\int_0^1\,x(i)\,di$
. Here
 $\mu(i)^\eta$
is the weight a social planner assigns to agent i when solving for the efficient allocation. Second, we use the second welfare theorem and ask for the initial distribution of endowments (i.e.
 $k(i)_0$
) that allows for the implementation of an arbitrary (i.e. for arbitrary weights
 $\mu(i)$
) efficient allocation as a solution of (P-I). As this results in a specific relationship between the Pareto weights
 $\mu(i)^\eta$
and the initial distribution of wealth, we can finally revert this process, and thus, are able to describe allocations that result from a specific initial distribution of wealth as the solutions to the problem solved by a representative consumer.
Footnote 14
PROPOSITION 1 An efficient allocation in the above described economy with heterogeneous agents is characterized by aggregate variables
 $k_t=\int_0^1\,k(i)_t\,di$
,
 $x_t=\int_0^1\,x(i)_t\,di$
and
 $c_t=\int_0^1\,c(i)_t\,di$
that solve the following optimization problem of a representative consumer with productivity
 $e=\left(\int_0^1\,e(i)^\frac{1+\gamma}{\gamma}\,di\right)^\frac{\gamma}{1+\gamma}$
:
 \begin{equation*}\max_{\{c_t,h_t,k_{t+1}\}_{t=0}^{\infty}} E_t \sum_{s=0}^{\infty} \beta^s \frac{x_{t+s}^{1-\eta}}{1-\eta}, \end{equation*}
 \begin{align*}
\text{s.t.} \qquad R_t k_t + e w_t h_t &= c_t + k_{t+1} \\
x_t &= c_t -B\frac{h_t^{1+\gamma}}{1+\gamma},
\end{align*}
as well as the firm’s problem (P-F) with
 $\tilde{h}_t=e\,h_t=\int_0^1\,e(i)\,h(i)_t\,di$
, where
 $k_0=\int_0^1\,k(i)_0\, di$
.
Proof. See Maliar and Maliar (Reference Maliar and Maliar2001).
Proposition 1 establishes that efficient allocations in our economy with heterogeneous agents behave on the aggregate level like the allocations emerging in an economy with a representative consumer whose labor productivity is specified suitably according to the exogenously given distribution of individual labor productivities.
Footnote 15
As (P-R) and (P-F), together with the exogenous processes for TFP
 $\theta_t$
and the distributive shock
 $\zeta_t$
, characterize an otherwise standard real business cycle model, this implies that the aggregate dynamics of the model with heterogeneous agents can be derived and analyzed in a familiar fashion. Thus, aggregate dynamics are fully determined by the following set of equations (and a transversality condition as well as initial conditions for
 $k_t$
 $\theta_t$
and
 $\zeta_t$
, which are not displayed here):
 \begin{align}
x_t^{-\eta} &= \beta E_t\left[R_{t+1}x_{t+1}^{-\eta}\right], \end{align}
 \begin{align}
exp(\theta_t)k_t^{\alpha_t}(eh_t)^{1-\alpha_t} &= c_t + k_{t+1} -(1-\delta)k_t, \end{align}
 \begin{align}
h_t &= \left(\frac{w_t e}{B}\right)^{1/\gamma}, \end{align}
 \begin{align}
x_t &= c_t - B\frac{h_t^{1+\gamma}}{1+\gamma}, \end{align}
 \begin{align}
R_t &= 1-\delta+\alpha_t exp(\theta_t)k_t^{\alpha_t-1}(eh_t)^{1-\alpha_t}, \end{align}
 \begin{align}
w_t &= (1-\alpha_t)exp(\theta_t)k_t^{\alpha_t}(eh_t)^{-\alpha_t}, \end{align}
 \begin{align}
\theta_{t+1} &= \rho_{\theta} \theta_t +\epsilon_{\theta,t}, \end{align}
 \begin{align}
\zeta_{t+1} &= \rho_{\zeta} \zeta_t + \epsilon_{\zeta,t}.
\end{align}
The intertemporal Euler equation (3a), the budget constraint (3b), the optimal labor supply (3c) together with the definition of
 $x_t$
in (3d) determine the behavior of the representative consumer. The factor price equations for capital (3e) and labor (3f) determine firm behavior. The model dynamics are initiated by TFP (3g) and distributive shocks (3h). Thus, aggregate dynamics determined by the system (3a)–(3h) can be analyzed using, for example, perturbation methods or simply by linearizing the dynamics around the deterministic steady state of the model.
Footnote 16
Of course, with respect to TFP shocks, the dynamics of the model are equivalent to the dynamics of a canonical RBC model. The main new ingredients are distributive shocks. As mentioned above, the latter shock can interpreted as resulting from biased technological change, affecting the functional income distribution and factor price relations, which translates into changes in the personal income distribution. At least with respect to aggregate variables, the dynamic responses to distributive shocks do not differ much from the responses to TFP shocks, which are well known.
Footnote 17
Thus, regarding aggregate dynamics, distributive shocks simply represent a different kind of technology shock. However, with respect to the consequences for distributional dynamics this is not true. As we show in Section 4.1, each type of shock may have quite different implications for wealth and income inequality.
In order to describe the distributive dynamics, it remains to specify the relationship between the Pareto weights
 $\mu(i)^\eta$
used while deriving the efficient allocation and the initial distribution of wealth across agents. For this, we impose the second welfare theorem and ask for an initial distribution of wealth across agents that causes a specific efficient allocation as an equilibrium allocation, that is, as a solution of (P-I) and (P-F). In preparation for this, we first introduce some additional notation: Define the relative labor productivity of agent i as
 $\phi(i) = (e(i)/e)^{\frac{1+\gamma}{\gamma}}$
(notice, that
 $\int_0^1 \phi(i)di=1$
) and
 $U_t = E_t \sum_{s=0}^{\infty} \beta^s x_{t+s}^{1-\eta}$
, where
 $U_t$
follows the recursive equation:
Footnote 18
 \begin{equation}
E_t U_{t+1} = \frac{1}{\beta} (U_t-x_{t}^{1-\eta}).
\end{equation}
We then get:
PROPOSITION 2 An efficient allocation where the Pareto weight assigned to agent i is given by
 $\mu(i)^\eta$
, which can be implemented as an equilibrium of an economy where heterogeneous agents solve (P-R) and the firm solves (P-F) if initial wealth of this agent satisfies:
 \begin{equation}
k(i)_0
= \left(\mu(i)-\phi(i)\right)p_0{k}_0 +\phi(i)\,k_0,
\end{equation}
where the relative wealth position of agent i depends on her relative consumption share
 $\mu(i)$
and the relative labor efficiency
 $\phi(i)$
but also on the aggregate initial relation between the present value of current and future expenditures and wealth given by
 $p_0=\frac{U_0\,x_0^\eta}{R_0{k}_0}$
.
Proof. See Maliar and Maliar (Reference Maliar and Maliar2001).
Based on (5), we can always find an initial distribution of wealth across agents that implements any efficient allocation according to (P-R) and (P-F) as an equilibrium allocation that solves (P-I) and (P-F). Of course, as the weights
 $\mu(i)$
must be positive, the converse is not true: Fixing the left hand side of (5) arbitrarily, there might not exist a positive weight
 $\mu(i)$
that solves (5).
Footnote 19
We handle this by simply assuming that the initial wealth distribution in our heterogeneous agent economy is such that this is ruled out:
Assumption 1 The initial distributions of wealth
 $k(i)_0$
and productivities e(i) across agents are such that for all
 $i \in I$
:
 $$\mu (i) = \phi (i) + {{k{{(i)}_0}} \over {{p_0}{k_0}}} - {{\phi (i)} \over {{p_0}}} > 0$$
In what follows, we generally assume that (A.1) is satisfied and this, finally, enables us to describe the distributive dynamics in our model with heterogeneous agents:
PROPOSITION 3 Under assumption (A.1), a competitive equilibrium in an economy where heterogeneous agents’ decision rules solve (P-I) given initial wealth endowments
 $k(i)_0$
and the firm solves (P-F), individual wealth
 $k(i)_{t+1}$
of any agent i at the end of period t evolves according to:
 $${{k{{(i)}_{t + 1}}} \over {{k_{t + 1}}}} = {\mkern 1mu} \left( {{{k{{(i)}_0}} \over {{k_0}}} - \phi (i)} \right){{{q_t}} \over {{p_0}}} + \phi (i),$$
where
 $k_{t+1}=\int_0^1\,k(i)_{t+1}\,di$
,
 $\phi(i) = (e(i)/e)^{\frac{1+\gamma}{\gamma}}$
and
 $q_t=\frac{U_t\,x_t^\eta-x_t}{k_{t+1}}$
denotes the present value of future expenditures relative to next period wealth.
Proof. See Maliar and Maliar (Reference Maliar and Maliar2001).
Proposition 3 might seem a bit puzzling at first glance, but essentially equation (W) is nothing more than the transformed budget constraint of an agent as formulated in (P-I). This budget constraint reads
 $k(i)_{t+1}=R_t\,k(i)_t+e(i)\,w_{t}h(i)_t-c(i)_t$
and our aggregation result allows to rewrite this equation in terms of aggregate variables as well as endogenously given initial values for some variables in our model. The intuition behind equation (3) is quite straightforward: In every period, each agent must adjust his next period wealth in order to fill a possible gap between present value of future expenditures and the present value of future labor income, where expenditures and labor income are proportional to that of the representative agent. Hence
 $q_t$
shows up in equation (3) because it determines how the representative agent must choose his next period wealth in order to close this gap.
We discuss the implications of Proposition 3 at some length below. For the moment, it is sufficient to realize that equation (W) states that the dynamics of individual wealth depend on aggregate dynamics (via
 $x_t$
,
 $U_t$
and
 $k_t$
) as well as the initial endowments of wealth and productivities.
3.3 Distributional dynamics
For a more detailed analysis of the distributional dynamics, let us switch from wealth levels to wealth shares. Defining the wealth share of agent i as
 $a(i)_t = k(i)_t/k_t$
, and with
 $a(i)_0=k(i)_0/k_0$
denoting the initial wealth share of agent i, we get from (W) that
 $a(i)_t$
evolves over time according to:
 $$a{(i)_{t + 1}} = [a{(i)_0} - \phi (i)]{{{\mkern 1mu} {q_t}} \over {{p_0}}} + \phi (i),{\mkern 1mu} \quad t = 0,1,2, \ldots ,$$
(6a) is the essential equation we use to describe the distributional dynamics. The dynamics of the individual wealth shares are completely determined by the exogenous initial cross-sectional distributions of wealth holdings
 $a(i)_0$
and labor productivities
 $\phi(i)$
as well as the initial values of the aggregate state variables (which are pinned down by initial values
 $p_0$
) and depend via
 $q_t$
on the expected aggregate expenditure dynamics. Thus, the dynamic properties of the wealth distribution also depend on initial values of aggregate state variables.
Equation (6a) describes the dynamic evolution of the wealth distribution and, given this, it is possible to describe other relevant cross-sectional distributions. First, note that the transformed productivities
 $\phi(i) = (e(i)/e)^{\frac{1+\gamma}{\gamma}}$
are, by construction, equivalent to the ratio of individual efficiency hours worked to average efficiency hours and, thus, equivalent to the—therefore time invariant—ratio
 $\omega(i) = \frac{w_t e(i) h(i)_t}{w_t e h_t}$
of individual labor income to average labor income.
Footnote 20
If we define income of agent i as
 $(R_t-1+\delta)\,k(i)_t+e(i)h(i)_t\,w_t$
, the share
 $y(i)_t$
of agent i in total factor income in period t is given by:
Footnote 21
 \begin{equation}
y(i)_t = \alpha_t a(i)_t + (1-\alpha_t)\phi(i).\end{equation}
Under the innocuous assumption that
 ${a_0}(i)$
and
 $\phi(i)$
are both integrable on I, it is always possible to compute, from equations (6a) and (7), variances and covariances in a straightforward way in order to describe the dynamics of the cross-sectional distributions of wealth and income. So, for instance, the coefficient of variation
 $\sigma_{a,t}$
of
 $a(i)_t$
evolves according to:
 \begin{equation}
\sigma_{a,t+1} = \sqrt{(p_0 q_t)^2\sigma_{{a_0}}^2+(1-p_0q_t)^2\sigma_{\phi}^2 +2 p_0 q_t(1-p_0q_t)\sigma_{{a_0},\phi}^2},\end{equation}
where
 $\sigma_{{a_0}}^2$
and
 $\sigma_{\phi}^2$
denote the cross-sectional variances of
 ${a_0}(i)$
and
 $\phi(i)$
, respectively, and
 $\sigma_{{a_0},\phi}^2$
denotes the cross-sectional covariance between
 ${a_0}(i)$
and
 $\phi(i)$
.
Of course, a more convenient way to characterize the distributional implications of the model would be to consider usual inequality measures, like Gini coefficients, as these are predominantly used in empirical analyses. However, a straightforward computation of Gini coefficients from the cross-sectional distributions generated by the model is possible only if
 ${a_0}(i)$
and
 $\phi(i)$
satisfy some preconditions that are summarized below:
Footnote 22
Assumption 2 The initial distributions
 ${a_0}(i)$
and
 $\phi(i)$
are such that for all
 $i \in I = [0,1]$
:
(i)
 $\phi(i)$
is integrable and monotone increasing,
(ii)
 ${a_0}(i)$
is integrable and monotone increasing, and
(iii)
 ${a_0}(i)-\phi(i)$
is integrable and monotone increasing.
Conditions (i) and (ii) imply that the initial wealth and productivity of the agents are both monotonously increasing on I such that agents are, in both dimensions, arranged in an ascending order on I. Given this, Gini coefficients of the initial wealth and productivity distributions can be constructed simply by integrating
 $\phi(i)$
and
 $a(i)_0$
. So, for instance, the Gini coefficient of the initial wealth distribution is then given by
 $G_{{a_0}}=1-2\,\int_0^1\,\int_0^j\,a(i)_0\,di\,dj$
.
Footnote 23
As equation (6a) reveals, condition (iii) then ensures that
 $a(i)_{t+1}$
is for all
 $t\geq 0$
integrable and monotonically increasing on I such that the Gini coefficient
 $G_{a,t+1}$
of the wealth distribution at the end of period t for all
 $t=0,1,\ldots$
can also be constructed simply by integration of
 $a(i)_{t+1}$
. Finally this implies that
 $y(i)_t$
is also integrable and monotonically increasing such that the Gini coefficient of the income distribution
 $G_{y,t}$
is a result of integrating
 $y(i)_t$
. Thus, from (6a) and (7) we get:
 \begin{align}
G_{a,t+1} &= p_0 q_t\,\left(G_{{a_0}}-G_{\phi}\right) + G_{\phi}, \end{align}
 \begin{align}
G_{y,t} &= \alpha_t p_0 q_{t-1}\,\left( G_{{a_0}}- G_{\phi}\right)+G_{\phi}\,,\end{align}
with
 $q_t$
as defined in (6a) and with
 $G_{a_0}$
and
 $G_\phi$
denoting the exogenously given Gini coefficients of the endowment distributions. Notice that
 $p_0$
and the dynamics of
 $q_t$
are completely determined by the model parameters and the initial values of the aggregate state variables. Thus, together with
 $G_{a_0}$
and
 $G_\phi$
this then determines the dynamics of wealth and income inequality.
Let us now discuss the restrictions Assumption 2 poses on the initial cross-sectional distributions
 $a(i)_0$
and
 $\phi(i)$
: The concept of a Lorenz curve and concept of the Gini coefficient building on that both assume an ascending order of agents in terms of the attribute in question. While it is actually not that restrictive to assume that such an order exists with respect to initial wealth or productivities each taken for itself, it is in fact restrictive to assume that conditions (i) and (ii) stated in Assumption 2 are satisfied simultaneously. Simply speaking, this assumption requires that initially wealthier agents are also always more productive than initially poorer agents. Certainly, a positive correlation between initial wage income and wealth as implied by (i) and (ii) might seem not that restrictive against the background of empirical evidence as individuals with higher labor incomes in general also tend to possess higher levels of wealth (see on this, e.g. Diaz-Gimenez et al. (Reference Diaz-Gimenez, Quadrini and Rios-Rull1997) or Garcia-Milà et al. (Reference Garcia-Milà, Marcet and Ventura2010)). However, assuming (i)–(ii) in conjunction with (iii) is in fact restrictive and its relevance is difficult to grasp. Given (i) and (ii) are satisfied, (iii) formulates a restriction over the second derivatives of the respective Lorenz curves
 $L_{a_0}(i)$
and
 $L_{\phi}(i)$
for wealth and productivities (i.e. the change of their respective slopes) that is satisfied whenever
 $L''_{a_0}(i)\geq L''_{\phi}(i)$
for all
 $i\in I$
.
Footnote 24
Thus, given that the slope of the Lorenz curve for initial wealth
 $L_{a_0}(i)$
is increasing on I, the slope of the the Lorenz curve for productivities
 $L_{\phi}(i)$
may not increase more than that. All in all this means that a straightforward computation of Gini coefficients from the model is not always possible as this requires that the initial distributions of wealth and productivities across agents have to met restrictive conditions. Note, however, that the conditions stated in Assumption 2 are always satisfied if agents are homogenous with respect to their productivities and thus labor income (i.e.
 $e(i)=e$
for all
 $i\in I$
). Thus, this is one case in which (i)–(iii) are satisfied and a straightforward computation of Gini coefficients for wealth and income from the model is always possible.
Footnote 25
A special feature of the distributional dynamics described by equations (9a) and (9b) is that the cross-sectional dynamics still depend on the initial value
 $p_0$
. However, we will get rid of this initial value if we make use of the steady-state values
 $\overline{G}_{a}$
and
 $\overline{G}_{y}$
for the Gini coefficients of wealth and income. As shown in Appendix B we then get:
 \begin{align}
{G}_{a,t+1} &= \frac{q_t}{\overline{q}} \left(\overline{G}_{a}-G_{\phi}\right)+G_\phi, \end{align}
 \begin{align}
{G}_{y,t} &= \frac{\alpha_t\,q_{t-1}}{\overline{\alpha}\,\overline{q}} \left(\overline{G}_{y}-G_{\phi}\right) +G_\phi\,,\end{align}
where
 $\overline{q}$
and
 $\overline{\alpha}$
represent the steady-state values of the capital share
 $\alpha_t$
and
 $q_t$
from equation (W). Moreover, the steady-state values of inequality measures for wealth
 $\overline{G}_{a}$
and income
 $\overline{G}_{y}$
itself are related through the following equation:
 \begin{equation}
\overline{G}_{y} = \overline{\alpha}\, \overline{G}_{a} + (1-\overline{\alpha})G_\phi\,,\end{equation}
To summarize, the complete set of equations describing aggregate as well as distributional dynamics is given by equations (3a)–(3h) from above as well as equations (4) and (W), which define the dynamics of
 $U_t$
and
 $q_t$
, as well as (10a) and (10b), which depict the dynamics of inequality measures. Thus, augmenting an otherwise conventional stochastic macroeconomic model with the just derived equations enables us to describe and simulate the distributional implications of exogenous shocks in that model.
3.4 Implications for the dynamics of income and wealth inequality
The above stated equations for the inequality measures allow for deriving some first conclusions regarding the business cycle properties of wealth and income inequality.
Concerning this, let us first look at the volatility of income and wealth inequality. Equations (10a) and (10b) reveal that this volatility depends, on the one hand, on the volatility of the aggregate variables
 $q_t$
and
 $\alpha_t$
as well as, on the other hand, on the cross-sectional distribution in the stochastic steady state as determined by
 $\overline{G}_{a}$
and
 $G_\phi$
. There are two special cases where there is no volatility in inequality at all such that the wealth and income distributions remain unchanged over time: The first is the case where
 $q_t$
as well as
 $\alpha_t$
are constant over time. While
 $\alpha_t$
is constant whenever there are no distributional shocks,
 $q_t$
stays constant only for certain parameterizations (
 $\eta=1$
and
 $\delta=1$
) of the model.
Footnote 26
The second case is the one where
 ${a_0}(i) = \phi(i)$
for all
 $i \in I$
(cf. equations (6a) and (7)). In this case we have
 $\overline{G}_{a}=G_{a,0} = G_\phi$
, such that wealth and income inequality stay constant over time.
Footnote 27
By including distributive shocks, we allow for exogenous changes in the factor share relation. A positive shock to the capital share
 $\alpha_t$
captures biased technical changes that lead to a capital-augmenting process.
Footnote 28
While economic growth is associated with pure labor-augmenting technical change in the long-run, capital-augmenting technical change leads to fluctuations in the factor shares along the transition path and in the short run.
Footnote 29
The dynamic equations for the Gini coefficients of wealth and income (10a) and (10b) reveal the significance of distributive shocks for the dynamics of wealth and income inequality: Distributive shocks are necessary in our model in order to distinguish dynamic changes in the relationship between functional and personal income distribution. TFP shocks would not affect the relationship between personal and functional income distribution. Because of their neutrality, they neither change the factor share
 $\alpha$
nor the correlation
 $\rho$
between labor and capital incomes, driving the volatility of labor and capital income distributions in the same directions. Once we allow for fluctuations of the capital share
 $\alpha$
(or the labor share 1-
 $\alpha$
), this neutrality result is offset. The personal income distribution fluctuates over time and the relationship between the functional and the personal income distribution changes over time and can be either positive or negative.
Furthermore, without these shocks (i.e.
 $\alpha_t=\overline{\alpha}$
for all t), also the Gini coefficients for wealth and income move always proportionally to each other and—given the empirically plausible fact that
 $\overline{G}_{a}>\overline{G}_{y}$
—the volatility of the wealth Gini is necessarily greater than that of income. Both inequality measures will then move in the same direction as
 $q_t$
, that is, wealth and income inequality behave procyclical whenever
 $q_t$
does so (and we will show later that a plausible calibration of the model implies that
 $q_t$
is in fact procyclical). Only the presence of distributive shocks opens the possibility that this proportionality is broken such that the Ginis of wealth and income might move in opposite directions and that the Gini of income is more volatile than that of wealth. Besides this, (10a) and (10b) allow for the conclusion that the volatility of wealth and income inequality will be larger, the larger are the differences between wealth, labor income, and total income distributions.
4 Quantitative analysis
4.1 Shocks and inequality
To assess the consequences of exogenous technology shocks for wealth inequality, it is useful to neglect any distributive shocks and to look at the dynamics of wealth inequality in a deterministic model first. Chatterjee (Reference Chatterjee1994) and Caselli and Ventura (Reference Caselli and Ventura2000) perform such analyses; the latter shows that, with
 $\eta = 1$
and Cobb–Douglas technology, the transition toward the deterministic steady state from below (above) goes along with declining (rising) wealth inequality. While this suggests that a positive technology shock in an equivalent stochastic model should go along with a decline in wealth inequality, we see that this is not necessarily true as the serial correlation of the technology shocks also matters for the response of wealth inequality.
To see this, we follow the reasoning of Maliar et al. (Reference Maliar, Maliar and Mora2005) and look at the ratio
 $\frac{x_t}{k_{t+1}}$
, which governs the dynamics of wealth inequality in the case where the elasticity of intertemporal substitution is
 $\eta = 1$
(cf. eqn. (10a) and (10b)). Assume that, in period t, the economy is hit by a purely transitory and positive technology shock. Starting from
 $x_{t-1} = \overline{x}$
and
 $k_t = \overline{k}$
, both
 $x_t$
as well as
 $k_{t+1}$
will increase, with the increase in
 $x_t$
being smaller than the increase in
 $k_{t+1}$
, that is, the capital stock increases by more than consumption adjusted for the labor supply.
Footnote 30
Consequently,
 $x_t/k_{t+1} < \overline{x}/\overline{k}$
and wealth, as well as income inequality, will decline. If, however, the productivity shocks display a high enough degree of serial correlation, the increase in
 $x_t$
might well be larger than the increase in
 $k_{t+1}$
, such that wealth and income inequality rises in response to a positive technology shock. This results because an anticipated long lasting future increase in TFP requires a less pronounced increase in capital accumulation in response to the shock.
TFP shocks
Figure 3 shows typical impulse responses of wealth inequality to a positive technology shock for different values of some of the model’s parameters.
Footnote 31
The upper panel shows impulse responses for the case of serially uncorrelated shocks, the lower panel shows the responses for serially correlated shocks. As can be seen, whether or not wealth inequality increases in response to a positive technology shock—thus behaves procyclical—depends on the intertemporal elasticity of substitution
 $1/\eta$
and the persistence of productivity shocks
 $\rho_{\theta}$
. In case shocks are not persistent, a negative response results for low enough values of
 $\eta < 1$
or, conversely, a positive response now requires a large enough value of
 $\eta > 1$
. For plausible values of
 $\eta \approx 2$
and
 $\rho_{\theta} \approx 0.95$
, wealth inequality rises on impact and then converges back to its steady-state level. From the business cycle perspective, this implies that wealth inequality behaves procyclical. Moreover, for low values of
 $\eta$
, the adjustment of wealth inequality is non-monotonic, that is, during the transition, wealth inequality falls below its steady-state level and converges to this level from below.
Footnote 32
Impulse responses of wealth inequality to a positive technology shock at different values of
 $\eta$
. Without persistent shocks (
 $\rho_{\theta} = 0$
) in the upper panel, with persistent TFP shocks (
 $\rho_{\theta}= 0.95$
) in the lower panel. The other parameters are set as follows:
 $\beta = 0.98$
,
 $\delta = 0.025$
,
 $\alpha = 0.38$
.

In summary, if technology shocks are the main drivers of business cycle fluctuations, procyclical behavior of wealth inequality results whenever the intertemporal elasticity of substitution
 $1/\eta$
is low enough and/or the autocorrelation of the technology shocks is high enough. Intuitively, the importance of these parameters for inequality dynamics is straightforward. A high value of
 $\eta$
is associated with a strong preference for consumption smoothing. Thus, at higher values of
 $\eta$
, households will be inclined to accumulate more capital in response to a productivity shock in order to smooth their consumption. Since households at the top of the wealth distribution have a higher capital income, they need to accumulate relatively more capital compared to poorer households, which eventually results in increasing wealth and income inequality. A similar reasoning applies to the persistence of shocks. In case of an uncorrelated one time increase in productivity, households will also smooth consumption but not as much as in the case of correlated shocks. Therefore, in this case, we observe increasing wealth inequality only for high values of
 $\eta$
. When shocks are serially correlated, the consumption smoothing motive dominates and inequality increases in response to productivity shocks.
Distributive shocks
Next, we turn to distributive shocks. Again, we find that the response of inequality measures will crucially depend on the values of
 $\eta$
and
 $\rho_{\xi}$
. Consider again the case of
 $\eta =1$
: If the economy is hit by a purely transitory distributive shock, the capital share increases, with both
 $x_t$
and
 $k_{t+1}$
increasing, where the increase in
 $x_t$
is again smaller than the increase in
 $k_{t+1}$
, meaning that we see a decline in the Gini coefficient of the wealth distribution. This results from the stronger increase in investment and the physical capital stock relative to the increase in consumption adjusted for the labor supply. However, as we can see from equation (10a) and (10b), in the case of distributive shocks, the Gini coefficients of the wealth and income distribution must not necessarily move into the same direction. While distributive shocks have only an indirect impact on the Gini coefficient of the wealth distribution through the effects on
 $\frac{x_t}{k_{t+1}}$
, they exert an additional direct effect on the Gini coefficient of the income distribution. Thus, if the increase in
 $\alpha_t$
is large enough, it dominates the indirect effect and we see an increase in the Gini coefficient of the income distribution.
Figure 4 shows the reaction of the Gini coefficient of the wealth distribution (upper panels) and the Gini coefficient of the income distribution (lower panels) to uncorrelated (left panels) and correlated (right panels) distributive shocks for different values of
 $\eta$
. As can be seen, for uncorrelated shocks and
 $\eta = 1$
, the above reasoning applies and we see a decline in the Gini coefficient of the wealth distribution accompanied by a rise in the Gini coefficient of the income distribution. This pattern changes when either
 $\eta$
increases or the correlation of distributive shocks is taken into account. For
 $\eta > 2$
, both Gini coefficients show procyclical behavior in the case of uncorrelated shocks.
Impulse responses of wealth and income inequality to a positive distributive shock at different values of
 $\eta$
and
 $\rho_{\zeta}$
. The left panels show the responses to uncorrelated shocks, the right panels show the responses to correlated shocks. The other parameters are set as follows:
 $\beta = 0.98$
,
 $\delta = 0.025$
,
 $\alpha = 0.38$
.

4.2 Matching to US data
Next, to find an empirically plausible specification, we use Bayesian methods to match a subset of the model parameters to US data. In a second step, we then compare the simulated Gini path with the historical data series. To this end, we focus mostly on the stochastic process for productivity
 $\theta_t$
and the process that describes distributive shocks
 $\zeta_t$
. Moreover, we are especially interested in the parameter that is particularly relevant for the reaction of inequality measures, that is, the inverse of
 $\eta$
. In the specification for the estimation, we take the results of Ríos-Rull and Santaeulàlia-Llopis (Reference Ríos-Rull and Santaeulàlia-Llopis2010) as a starting point and specify a bivariate process of productivity as follows:
Footnote 33
 \begin{equation}
\begin{bmatrix}
\theta_t \\ \zeta_t
\end{bmatrix}= \begin{bmatrix}
\rho_{\theta} & \rho_{\theta,\zeta} \\
\rho_{\zeta,\theta} & \rho_{\zeta}
\end{bmatrix} \begin{bmatrix}
\theta_{t-1} \\ \zeta_{t-1}
\end{bmatrix}
+ \begin{bmatrix}
\epsilon_{\theta,t} \\
\epsilon_{\zeta,t}
\end{bmatrix},
\end{equation}
where
 $\rho_{\theta,\zeta}$
and
 $\rho_{\zeta,\theta}$
denote the off-diagonal elements of the coefficient matrix. In addition, in order to make the estimation of the intertemporal elasticity of substitution more robust, we add observational errors to consumption.
In order to estimate the model for the USA, we use three series of observables: real per capita GDP, real private consumption per capita, and the capital share. The data series for real GDP and real private consumption were retrieved from the Bureau of Economic Analysis (BEA). The data on private consumption comprises the consumption expenditures on nondurable goods and services. The data on the US capital share were retrieved from the Bureau of Labor Statistics (BLS). The data are available at a quarterly frequency for the period 1948Q1:2017Q4. All series are seasonally adjusted, and we apply a one-sided HP filter with
 $\lambda = 1600$
to isolate the cyclical components of the series.
Footnote 34
4.3 Calibration and priors
As is common in the literature, we calibrate a set of parameters to match general properties of the US economy (See Table 3 for an overview of the calibrated parameters). In particular, we set
 $\beta$
to 0.988, this gives an annual steady-state interest rate of approximately 4.8%. The depreciation rate
 $\delta$
is set to 0.025, which gives an annual depreciation of 10%, as it is common with quarterly data. Steady-state aggregate labor input is calibrated to match the average working time in the USA, we set B to 5.06, and
 $\gamma=0.5$
, this results in average hours worked of 0.23 which translates into 38.6 average working time per week (fulltime equivalent). Regarding the distributional implications of the model, parameters to be determined are
 $G_{\phi}$
,
 $G_a$
, and
 $G_y$
. Here calibration targets
 $G_a$
and
 $G_{\phi}$
for steady-state wealth and labor income inequality, together with
 $\alpha$
, deliver via (11) a unique value for
 $G_y$
. However, as
 $G_a$
,
 $G_\phi$
and
 $G_y$
are tied to each other via (11) not all desired combinations of inequality measures can be reproduced by the model. Whenever we start from the empirical fact that the wealth distribution is the most unequal distribution, it must be the case that
 $G_a > G_y > G_\phi$
. In contrast to this, focusing on coefficients of variation or generalized entropy indices provides more flexibility as it is not necessarily the case that
 $\sigma_a > \sigma_y > \sigma_\phi$
. Focusing on these inequality measures, however, comes at the cost of a loss of clarity as we have a more intuitive understanding of plausible Gini coefficients than of plausible values for coefficients of variation.
Calibrated Parameters

The wealth Gini coefficient is calibrated in line with Kuhn et al. (Reference Kuhn, Schularick and Steins2019) and corresponds to the average Gini coefficient of the wealth distribution reported there, which is has a value of
 $G_a = 0.8$
. With regards to the Gini coefficients of the income distribution, we use the sample average, obtained from the WIID data, of
 $G_y = 0.437$
. Finally, we calibrate the steady-state capital share in accordance with the sample average and set
 $\alpha = 0.381$
.
Most prior distributions and priors are chosen as common in the literature. We assume an inverse gamma distribution for the parameters that are bounded to be positive, that is,
 $\epsilon_{\theta,t}$
and
 $\epsilon_{\zeta,t}$
. We follow Smets and Wouters (Reference Smets and Wouters2007) and choose a loose prior mean for the innovations of
 $0.1$
. With respect to the persistence parameters,
 $\rho_{\theta}$
and
 $\rho_{\zeta}$
, we assume a beta distribution. We set the prior mean to
 $0.6$
with a standard deviation of
 $0.2$
. Regarding the parameters of the utility function, we assume a normally distributed prior for
 $\eta$
, with a prior mean of 2 and standard deviation of
 $0.3$
. In absence of further information on the bivariate process, we use the estimated specification of Ríos-Rull and Santaeulàlia-Llopis (Reference Ríos-Rull and Santaeulàlia-Llopis2010) as prior and set the prior mean of
 $\rho_{\theta,\zeta}$
to 0 and the prior mean of
 $\rho_{\zeta,\theta}$
to
 $-0.015$
.
Footnote 35
We assume that the prior distributions are normal and, in order to account for parameter uncertainty, we set the standard deviation of both parameters to
 $0.2$
.
Footnote 36
Table 4 provides an overview of the estimated posterior median values of the parameters. All estimated shocks and parameters are uniquely identified.
Footnote 37
We find that the stochastic processes are estimated to be quite persistent, with a persistence of TFP shocks
 $\rho_{\theta}$
of
 $0.97$
. The persistence of distributive shocks is estimated to be somewhat lower with a value of
 $0.95$
. Both values are roughly consistent with values employed in the literature. With respect to the coefficients of the bivariate process, the results are also reasonably consistent with the results of Ríos-Rull and Santaeulàlia-Llopis (Reference Ríos-Rull and Santaeulàlia-Llopis2010). Finally, the estimation yields a value for
 $\eta$
of
 $2.4$
. Thus, in the light of the preceding discussion, since shocks are found to be persistent and since the intertemporal elasticity of substitution is sufficiently small, we expect inequality measures to react procyclical to TFP shocks on impact.
Prior and posterior distribution of the estimated parameters. The posterior distribution is obtained using the Metropolis–Hastings algorithm with two MCMC chains to generate a sample of 500.000 draws each

4.4 Shock contribution and historical comparison
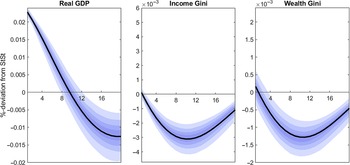
We analyze the estimated behavior of macroeconomic variables and inequality measures to shocks to total factor productivity and the capital share at the posterior mean. Figure 5 shows the responses of the Gini coefficients of the income (left panel) and wealth distribution (right panel) to a TFP shock. Footnote 38 As can be seen, only the initial response of the income Gini coefficient is positive, that is, behaves procyclical. However, on impact the response is not statistically significant. After around two quarters, income inequality starts to decline and the effect becomes statistically significant. This response is in line with the empirical pattern of cross-correlations between GDP and the Gini coefficient of the income distribution reported in the empirical motivation. Furthermore, the response displays the above mentioned non-monotonic convergence from below after peaking on impact. So overall, while income inequality reacts procyclical on impact, the pattern reverses after some periods and inequality declines. We observe a very similar, but less pronounced, pattern for wealth inequality.
Impulse responses of income and wealth inequality to a positive technology shock at the posterior mean.

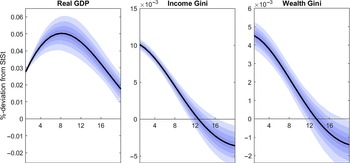
The distributive shock is modeled as an increase of the capital share and reflects a change in the functional income distribution. The main difference with respect to TFP shocks is that the capital share behaves procyclical when the capital share increases endogenously. This is related to the positive growth effects of capital-augmenting technological changes. Figure 6 shows the responses of inequality measures to a distributive shock. Here, clearly a shift toward higher capital intensity in production expands the dispersion of the income and wealth distribution on impact. Only after 10 to 15 quarters does the pattern reverse and inequality decline.
Impulse responses of income and wealth inequality to a positive distributive shock at the posterior mean.

In general, we find that income inequality displays a stronger reaction to both types of business cycle shocks compared to the reaction of wealth inequality. This suggests that wealth inequality is less susceptible to cyclical fluctuations. Footnote 39 This finding seems intuitive, while changes in wealth inequality are bound to changes in the individual capital stock, which requires an adjustment period, changes in income inequality can materialize directly in response to changes in factor prices. The more pronounced reaction of the Gini coefficient of the income distribution in response to distributive shocks relative to standard TFP shocks can be explained by the direct effect that the distributive shock exerts on the income composition. Intuitively, the redistribution of income toward capital clearly favors wealthier households. Given the assumed functional forms, the distributive shock induces a rise in the real interest rate and an expansion of output. This leads to an increase in investment, which translates into a higher capital stock and eventually leads to an increase in wages. This pattern conforms with the notion of productivity shocks that diffuse slowly into production and primarily benefit capital income, while labor income increases only with a delay after a couple of periods. In contrast, a standard TFP shock increases overall productivity, which induces a broadly proportional increase in labor and capital income, resulting in less dispersion in income.
The results of the historical variance decomposition are summarized in Table 5. Our estimation confirms the results of Young (Reference Young2004), Ríos-Rull and Santaeulàlia-Llopis (Reference Ríos-Rull and Santaeulàlia-Llopis2010), and Lansing (Reference Lansing2015) regarding the important role of capital share fluctuations shaping the business cycle. Additionally, we find that TFP shocks also play a pivotal role in explaining fluctuations in inequality measures. In the case of the USA, about 17% of the fluctuations in inequality measures is attributable to TFP shocks. However, according to the model, in the USA, a major share of fluctuations in wealth and income inequality results from distributive shocks. Furthermore, the results of the historical variance decomposition also complement the recent empirical evidence, regarding the long-run relationship between income inequality and changes in GDP growth for the USA as presented by Rubin and Segal (Reference Rubin and Segal2015). In a panel estimation, they find that GDP changes tend to increase income inequality. According to their results, this finding is especially driven by the changes in asset income, which is more volatile than labor income.
Variance decomposition of Gini coefficients of income and wealth

In a last step, we use the estimated quarterly shock decomposition and simulate a historical Gini series based on observed GDP, consumption, and capital share development. In order to compare the model-based series with actual data at quarterly and annual frequency, we use the cyclical variation for both series. Footnote 40
Figure 7 depicts the actual annual (solid blue) and model-based simulated (dashed red) development of the Gini coefficient for market income together with NBER recession periods (gray shaded areas). Because quarterly data are not available for the actual Gini coefficient, we compare the cyclical components of the annual Gini coefficient to the model generated quarterly variations (left panel). Additionally, we use annual averages of the model-based series for an annual comparison (right panel). Since we do not include the Gini coefficient as an observable, we consider this comparison to be an interesting exercise to assess the model’s ability to mimic fluctuations in income inequality.
Simulated and actual cyclical component of the income Gini coefficient.
 $^1$
Comparison between model-based with actual cyclical component based on quarterly data. The actual cyclical component is available only at annual frequency. For comparison we hold actual values constant over quarters.
 $^2$
Comparison between model-based with actual cyclical component based on annual data. The model-based series is estimated using quarterly data from GDP, consumption and capital share. For comparison we calculate the annual mean of the model-based series.

The comparison of the model-based series to the actual fluctuations in income inequality reveals three noteworthy aspects. First, major events of increasing or decreasing Gini coefficients can be explained by the model. Over the full sample period, the correlation between the model output and the actual Gini series is 0.33 for quarterly data and 0.38 for annual data. In contrast, a model-based series of Gini coefficients where TFP shocks are the only source of business cycle fluctuations is uncorrelated to the actual data series. Thus, the inclusion of distributive shocks substantially improves the ability to match short-run inequality dynamics within a standard RBC framework. Second, the correlation between the simulated series and the actual series is significantly higher in a subsample over the 1991–2016 period. Here, we obtain a correlation of 0.49 with quarterly data and 0.58 with annual data. In some periods, especially before 1991, the model does not fully fit the cyclical fluctuations in inequality. To some extent, this can be attributed to the different time dimensions of both series. Moreover, in specific periods the differences can also be explained by structural shortcomings of the model. For example, between 1971 and 1973 and after 1980, the model overpredicts fluctuations in income inequality. These periods are widely regarded as oil shock episodes. Since GDP and the capital share have decreased simultaneously during these periods, the model treats the oil shocks as negative distributive shocks. As explained, according to the model, this leads to a decline in income inequality. However, according to the data, income inequality increased during these periods. This observed pattern could be related to substitution effects. In response to an increase in oil prices, firms rather substitute oil through capital (less energy-intensive capital goods) than through labor. Introducing energy as third input factor in the production function Footnote 41 could potentially solve this mismatch. Third, we find that the model is able to match the development of income inequality during the Great Financial Crisis in 2007. The model treats the financial crisis as a negative distributive shock, which leads to declining inequality. We can sum up that a simple business cycle model, extended by distributive shocks, is able to fit short-run inequality dynamics quite well. However, given the simplicity of the model, it still provides room for future research on the drivers of the short-term business cycle dynamics of inequality, such as housing Footnote 42 or entrepreneurial income Footnote 43 . The advantage of our approach is the simple framework, which allows for analyzing and estimating the equilibrium dynamics of inequality measures via Bayesian techniques. Footnote 44
5 Conclusion
In order to understand the short-run dynamics of inequality, we investigate how the income and wealth distribution evolves along the business cycle. In a panel estimation with annual OECD country data from 1970 to 2016, we find that personal income and wealth inequality measured by the Gini coefficient are countercyclical and statistically significant on average. However, by calculating country-specific cyclical correlations of inequality we detect substantial cross-country heterogeneity: More than half of all OECD countries display a countercyclical relationship between output fluctuations and inequality. Yet, roughly a third of the countries, including, among others, the USA, show an acyclical or even procyclical pattern. In a detailed analysis of the cyclical properties of the income Gini coefficient, we find that in the USA, income inequality is weakly procyclical and less volatile than output, with a relative standard deviation of about one-third.
To understand the driving forces of the income and wealth distribution over the business cycle in more detail, we incorporate distributive shocks in a standard business cycle model, where agents are ex ante heterogeneous with respect to wealth and ability. Within this framework, we derive representations of standard inequality measures such as Gini coefficients. Applying the model to our research question, we show that the cyclicality of these inequality measures depends crucially on the parameters of the model and, in particular, on the intertemporal elasticity of substitution. In addition, the theoretical considerations highlight the importance of distributive shocks for the cyclical dynamics of income and wealth inequality. Thus, the behavior of inequality is eventually an empirical question about the size of structural parameters and the relative contribution of TFP as well as distributive shocks. Therefore, the heterogeneity between OECD observed in the panel analysis can potentially be traced back to differences in structural parameters across countries or might result from differences in the underlying shock processes. While our approach provides a general idea of the mechanisms, a definitive explanation for the observed differences is beyond the scope of this paper and left for future research.
We match our model to quarterly data for the USA by estimating the shock processes and relevant parameters of the model using Bayesian methods. We find that the intertemporal elasticity of substitution is close to two and that the shock processes display a high degree of persistence. Therefore, both TFP and distributive shocks generate a procyclical reaction of the income and wealth distribution on impact. However, in response to TFP shocks, it declines afterwards, which renders the effect countercyclical in later periods. In case of the distributive shock the dynamics of the income and wealth distribution stays procyclical. This finding matches the empirical cross-correlation pattern between GDP and the Gini coefficient of the income distribution observed in the USA. Furthermore, we find that income inequality reacts more pronounced to business cycle shocks compared to wealth inequality. According to the results of stochastic simulations, the model predicts that wealth inequality is about half as volatile throughout the business cycle as income inequality.
Finally, we analyze the relative shock contribution according to our posterior specification. Here, we find that the model assigns the major share of fluctuations in inequality measures, roughly 85%, to distributive shocks. Thus, our estimation confirms the important role of fluctuations in factor shares, for example, due to capital-augmenting technological change, in shaping the business cycle and, furthermore, highlights its importance for short-run inequality dynamics.
Acknowledgements
The authors would like to thank two anonymous referees and the associate editor for their fruitful comments and suggestions. Marius Clemens is grateful to the Deutsche Bundesbank for financial assistance.
Appendices
A Data description
Data sources and variable descriptions

Evolution of real per GDP, real per capita consumption, and the capital share in the USA 1948–2018.

B Deterministic steady state and representations of Gini coefficients
This appendix derives the deterministic steady state of the model. Given
 $e_*$
, the steady-state value
 $\alpha_*=a/(1+a)$
and steady-state hours of the representative consumer
 $h_*$
, we have
 $R_*=1/\beta$
from the Euler equation (3a) and according to (3e)
 $k_*$
solves:
 \begin{align*}
\frac{1-\beta\,(1-\delta)}{\alpha_*\,\beta}=k_*^{\alpha_*}\,(e_*\,h_*)^{1-\alpha_*}. \end{align*}
The steady-state wage rate then results from (3f) as
 $w_*=(1-\alpha_*)\,(k_*/(e_*\,h_*))^{\alpha_*}$
and according to (3c) the value for B that generates
 $h_*$
therefore solves:
 \begin{align*}
B =\frac{w_*\,e_*}{h_*^\gamma}. \end{align*}
From (3b) steady-state consumption results as
 $c_*=k_*^{\alpha_*}\,(e_*\,h_*)^{1-\alpha_*}-\delta\,k_*$
and this can be used to compute
 $x_*=c_*+B\,\frac{h_*^{1+\gamma}}{1+\gamma}$
from (3d). This then allows to compute
 $U_*=\frac{1}{1-\beta}\,x_*^{1-\eta}$
as well as
 $q_* = (x_*^\eta\,U_* - x_*)/k_*$
from equations (4) and (W). With respect to the steady-state values of Gini coefficients of wealth and income, (9a) and (9b) imply
 $G_{a,*}=p_0 q_* G_{{a_0}}+(1-p_0 q_*) G_{\phi}$
and
 $G_{y,*} = \alpha_t p_0 q_{*} G_{{a_0}}+(1-\alpha_t p_0 q_{*})G_{\phi}$
.
In order to derive (10a) and (10b) of the main text, we solve
 $G_{a,*}=p_0 q_* G_{{a_0}}+(1-p_0 q_*) G_{\phi}$
for
 $G_{{a_0}}-G_{\phi}$
, which is exogenous, and insert the result into the expression for
 $G_{a,t+1}$
and
 $G_{y,t}$
, this yields:
 $${G_{a,t + 1}} = {{{q_t}} \over {{q_*}}}\left( {{G_{a,*}} - {G_\phi }} \right) + {G_\phi }.$$
Inserting the same expression into (9b) gives:
 \begin{align}
G_{y,t} &=\alpha_t\,\frac{q_{t-1}}{q_*}\left(G_{a,*}-G_\phi\right) + G_\phi.\end{align}
From that we derive that
 $G_{y,*} =\alpha_*\left(G_{a,*}-G_\phi\right) + G_\phi$
, that is, equation (11). Using this, (A.1) becomes:
 $${G_{y,t}} = {{{\alpha _t}{\mkern 1mu} {q_{t - 1}}} \over {{\alpha _*}{\mkern 1mu} {q_*}}}\left( {{G_{y,*}} - {G_\phi }} \right) + {G_\phi }.{\rm{ }}$$
C Derivation of inequality measures
C.1 Linearization of the variance of the wealth and income distribution
This appendix demonstrates how to derive a linearized representation of the variances of the wealth and income distribution. The variance of the wealth distribution is given by
 \begin{align*}
\sigma^2_{a,t+1}=(p_0\,q_{t})^2\sigma^2_{{a_0}} +(1-p_0\,q_{t})^2\,\sigma^2_\phi+2\,(p_0\,q_{t})(1-p_0\,q_{t})\,\sigma^2_{{a_0},\phi}.\end{align*}
In the stochastic steady state we have
 $\sigma^2_{a_0}=(p_0\,q)^2\sigma^2_{{a_0}} +(1-p_0\,q)^2\,\sigma^2_\phi+2\,(p_0\,q)(1-p_0\,q)\,\sigma^2_{{a_0},\phi}$
, where q denotes the unconditional mean of
 $q_t$
. A first-order approximation of
 $\sigma^2_{a,t+1}$
around q then gives:
 \begin{align}
\sigma^2_{a,t+1}&\approx \sigma^2_{a_0} + 2\,q_t\,\left[(p_0\,q)^2\,\sigma^2_{{a_0}}-(1-p_0\,q)\,p_0\,q\,\sigma^2_\phi+(p_0\,q-2\,(p_0\,q)^2)\,\sigma^2_{{a_0},\phi}\right]. \end{align}
Using the above stated expression for
 $\sigma^2_{a_0}$
, this becomes:
 \begin{align}
\sigma^2_{a,t+1}& \approx \sigma^2_{a_0} +2\,\hat{q}_{t} \,\left[\sigma^2_{a_0} -(1-p_0\,q) \sigma^2_\phi -p_0\,q\,\sigma^2_{{a_0},\phi}\right]. \end{align}
Because
 $\sigma^2_{a_0,\phi}=p_0\,q\,\sigma^2_{{a_0},\phi}+(1-p_0\,q)\,\sigma^2_\phi$
, we finally end up with:
 \begin{align}
\sigma^2_{a,t+1}&\approx \sigma^2_{a_0} +2\,\hat{q}_{t} \,\left[\sigma^2_{a_0} -\sigma^2_{a_0,\phi}\right]
\\
&\quad = \sigma^2_{a_0} +2\,\hat{q}_{t}\sigma^2_{a_0} \,\left(1 -\rho_{a_0,\phi}\,\frac{\sigma_\phi}{\sigma^2_{a_0}}\right)
\\
\Leftrightarrow \quad \widehat{\sigma^2}_{a,t+1} &\approx 2\,\hat{q}_{t} \,\left(1 -\rho_{a_0,\phi}\,\frac{\sigma_\phi}{\sigma^2_{a_0}}\right) \,,\end{align}
where
 $\rho_{a_0,\phi}$
denotes the correlation between
 $a_0(i)$
and
 $\phi(i)$
.
With respect to the income distribution we have
 $y(i)_t=(\alpha_t p_0 q_{t-1})\,{a_0}(i)+(1-\alpha_t\,p_0\,q_{t-1})\,\phi(i)$
. Thus, the variance of the income distribution is given by
 \begin{align*}
\sigma^2_{y,t}=(\alpha_t\,p_0\,q_{t-1})^2\sigma^2_{{a_0}} +(1-\alpha_t\,p_0\,q_{t-1})^2\,\sigma^2_\phi+2\,(\alpha_t\,p_0\,q_{t-1})(1-\alpha_t\,p_0\,q_{t-1})\,\sigma^2_{{a_0},\phi}.\end{align*}
In the stochastic steady state we have
 $\sigma^2_{y}=(\alpha p_0 q)^2\sigma^2_{{a_0}} +(1-\alpha p_0 q)^2\,\sigma^2_\phi+2\,(\alpha p_0 q)(1-\alpha p_0 q)\,\sigma^2_{{a_0},\phi}$
and a linearization of
 $\sigma^2_{y,t}$
around q and
 $\alpha$
gives:
 \begin{align}
\sigma^2_{y,t}&\approx
\sigma^2_{y} + 2\,\hat{q}_{t-1}\,\Bigl[ (\alpha\,p_0\,q)^2 \,\sigma^2_{{a_0}}- (1-\alpha\,p_0\,q)\,\alpha\,p_0\,q\,\sigma^2_\phi + ( \alpha\,p_0 q-2\,(\alpha p_0 q)^2)\,\sigma^2_{{a_0},\phi} \Bigr] \\
&\qquad + 2\,\hat{\alpha}_{t}\,\Bigl[ (\alpha\,p_0\,q)^2 \,\sigma^2_{{a_0}}- (1-\alpha\,p_0\,q)\,\alpha\,p_0\,q\,\sigma^2_\phi + ( \alpha\,p_0 q-2\,(\alpha p_0 q)^2)\,\sigma^2_{{a_0},\phi} \Bigr]. \end{align}
Using the expression for
 $\sigma^2_{y}$
from above, this becomes:
 \begin{align}
\sigma^2_{y,t}& \approx \sigma^2_{y} +2\,(\hat{q}_{t-1}+\hat{\alpha}_t) \,\left[\sigma^2_{y} -(1-\alpha p_0 q) \sigma^2_\phi -(\alpha p_0 q) \,\sigma^2_{{a_0},\phi}\right]. \end{align}
Because
 $\sigma^2_{y,\phi}=\alpha p_0 q \,\sigma^2_{{a_0},\phi}+(1-\alpha p_0 q)\,\sigma^2_\phi$
, this equation is equivalent to:
 \begin{align}
\sigma^2_{y,t}& \approx \sigma^2_{y} +2\,\left(\hat{q}_{t-1}+\hat{\alpha}_t \right)\,\left[\sigma^2_{y} -\sigma^2_{y,\phi}\right] \\
& \quad = \sigma^2_{y} +2\,\left(\hat{q}_{t-1}+\hat{\alpha}_t \right)\,\sigma^2_{y,*} \,\left[1 -\rho_{y,\phi}\,\frac{\sigma_\phi}{\sigma_y}\right] \\
\Leftrightarrow \quad \widehat{\sigma^2}_{y,t} &\approx 2\,\left(\hat{q}_{t-1}+\hat{\alpha}_t \right) \,\left[1 -\rho_{y,\phi}\,\frac{\sigma_\phi}{\sigma_y}\right]\end{align}
C.2 Generalized entropy measures
This appendix demonstrates how to derive the generalized entropy index of the wealth distribution. Since we have
 $\int_0^1\,a(i)\,di=1$
the GE index for the wealth distribution in period t is given by (a(i) denotes the steady-state value of
 $a(i)_t$
):
 \begin{align*}
GE(\tau)_{a,t+1}= \frac{1}{\tau\,( \tau-1)}\, \int_0^1\,a(i)_{t+1}^\tau-1 \,di.\end{align*}
Now,
 $a(i)_{t+1} = [a(i)_0-\phi(i)]\,p_0\,q_t +\phi(i)$
. Thus a first-order approximation of
 $GE(\tau)_{a,t+1}$
around q gives:
 \begin{equation}
GE(\tau)_{a,t+1}-GE(\tau)_{a}=\frac{ \hat{q}_t}{\tau-1}\int_0^1\,a(i)^{\tau-1}\,[a(i)-\phi(i)]\,di.\,\end{equation}
If the expression under the integral is approximated by a second-order Taylor polynomial around
 $a(i)=1$
and
 $\phi(i)=1$
, we get:
 \begin{align}
a(i)^{\tau-1}\,(a(i)-\phi(i)) &\approx [a(i)-1] -[\phi(i)-1] \\
&\qquad +(\tau-1)\left([a(i)-1]^2-[a(i)-1][\phi(i)-1]\right). \end{align}
Thus the integral can be approximated as
 \begin{align*}
\int_0^1\,a(i)^{\tau-1}\,[a(i)-\phi(i)]\,di \approx (\tau-1)\,\sigma^2_a\left[1-\rho_{a_0,\phi}\,\frac{\sigma_\phi}{\sigma^2_{a_0}}\right].\end{align*}
Finally, a second-order approximation of
 $GE(\tau)_{a}$
around
 $a(i)=1$
and
 $\phi(i)=1$
gives:
 \begin{align*}
GE(\tau)_{a}\approx \frac{1}{2}\,\sigma^2_a.\end{align*}
Substituting this expression and the approximated expression for the integral into (A.4) then gives:
 \begin{align*}
\widehat{GE}(\tau)_{a,t+1}=2\,\hat{q}_t\,\left(1-\rho_{a_0,\phi}\,\frac{\sigma_\phi}{\sigma^2_{a_0}}\right).\end{align*}
Proceeding in a similar fashion it is possible to derive a measure for the income distribution.
D Second-order effects
Cumulative effects of TFP and distributive shocks based on estimated parameter with first-order and second-order simulations.

E IRF distributive and TFP shock
Impulse responses to a 1% shock to
 $\theta_t$
(TFP) and
 $\alpha_t$
(Distributive Shock). Notes: The underlying model is calibrated with
 $\beta=0.988$
,
 $\delta=0.025$
,
 $\eta=1$
,
 $\gamma=0.4545$
,
 $B=4.42$
(such that
 $h_*=0.31$
), and
 $\alpha_*=0.38$
(i.e.
 $a=0.6158$
). The shocks are serially correlated with
 $\rho_\theta=\rho_\zeta=0.9$
.