


Kaolinite is one of the most abundant and industrially important clay minerals, being used widely in the manufacture of porcelain, paper and other materials. Dehydroxylated kaolinite, known as metakaolinite, formed by decomposition of kaolinite at 400–600°C, is also used for the production of new types of concrete, such as self-compacting concrete. Therefore, understanding the relationship between the properties and structures of different kaolinites in their natural states and after dehydroxylation is an important area of research. The dehydroxylation of kaolinite has been studied extensively by various methods, including magic-angle-spinning nuclear magnetic resonance (MacKenzie et al., Reference MacKenzie, Brown, Meinhold and Bowden1985; Rocha & Klinowski, Reference Rocha and Klinowski1990; Massiot et al., Reference Massiot, Dion, Alcover and Bergaya1995; Rocha, Reference Rocha1999; He et al., Reference He, Guo, Zhu and Hu2003), infrared spectroscopy (Brindley et al., Reference Brindley, Kao, Harrison, Lipsicas and Raythatha1986; Frost et al., Reference Frost, Finnie, Collins, Vassallo, Fitzpatrik, Churchman and Eggleton1995; Frost & Vassallo, Reference Frost and Vassallo1996), thermal analysis methods (Yeskin et al., Reference Yeskin, van Gross and Guggenheim1985; Guggenheim & van Groos, Reference Guggenheim and van Groos1992; Dion et al., Reference Dion, Alcover, Bergaya, Ortega, Llewellyn and Rouquerol1998; Ptaček et al., Reference Ptaček, Šoukal, Opravil, Havilica and Brandštetr2011, Reference Ptaček, Opravil, Šoukal, Wesserbauer, Mosilko and Baraček2013), electron paramagnetic resonance (Djemai et al., Reference Djemai, Balan, Morin, Hernandez, Labbe and Muller2001) and transmission electron microscopy (Bergaya et al., Reference Bergaya, Dion, Alcover, Clinard and Tchoubar1996). White et al. (Reference White, Provis, Riley, Kearley and van Deventer2009, Reference White, Provis, Proffen, Riley and van Deventer2010a, Reference White, Provis, Proffen, Riley and van Deventer2010b) suggested new techniques combining thermodynamics and local structures to solve the metakaolinite structure. Their model for metakaolinite retains the 1:1 layering inherent in the initial kaolinite structure, although the layers are buckled locally because the octahedral coordination of Al cations is replaced by multi-coordinated environments. Also, Sperinck et al. (Reference Sperinck, Raiteri, Marks and Wright2011) simulated the thermally introduced transformation of kaolinite into metakaolinite by molecular dynamics and stepwise dehydroxylation and found that, during dehydroxylation, Al cations migrate from the octahedral sheets of the 1:1 kaolinite layers into interlayer sites, leading to four- and five-fold coordination of Al and a significant distortion of the structure.
Additional data on the phase transformations of kaolinite and the fine structural features of metakaolinite were also obtained using energy-filtering transmission electron microscopy (Lee et al., Reference Lee, Kim and Moon1999, Reference Lee, Kim and Moon2003). In particular, it was shown that metakaolinite may preserve its short-range order up to 920°C.
Despite the decades of studies on kaolinite dehydroxylation kinetics, starting from the pioneering publications of Brindley & Nakahira (Reference Brindley and Nakahira1956, Reference Brindley and Nakahira1957, Reference Brindley and Nakahira1958, Reference Brindley and Nakahira1959), there is no general agreement concerning the rate-controlling mechanism of this reaction (Ortega et al., Reference Ortega, Macías and Gotor2010; Ptaček et al., Reference Ptaček, Šoukal, Opravil, Havilica and Brandštetr2011 and references therein). The main reason for this lack of agreement is probably that the kinetics of kaolinite dehydroxylation were investigated continuously as a single reaction from the beginning to the end. Instead, Drits & Derkowski (Reference Drits and Derkowski2015) studied the kinetics behaviour of kaolinite samples at different stages of dehydroxylation and showed that each stage of partial dehydroxylation consisted of two kinetic reactions. At the low-temperature step, the kinetic reaction is described by the Arrhenius equation and the mechanism corresponds to a zero-order reaction. The acceleration of the dehydroxylation reaction within the second kinetic step decreases with increasing temperature, and the mechanism observed for each of the studied samples was independent of stacking order, particle size and size distribution. An analytical formula describing the rate-controlling mechanism of the second step was also deduced (Drits & Derkowski, Reference Drits and Derkowski2015).
Surprisingly, in contrast to the methods mentioned above, the potential advantages of modern powder XRD for the study of the transformations of kaolinite at different stages of dehydroxylation have not been fully exploited. Brindley & Nakahira (Reference Brindley and Nakahira1956, Reference Brindley and Nakahira1957) were the first to show that the positions and profiles of the 001 and 002 basal reflections recorded from a well-crystallized kaolinite do not change at different stages of dehydroxylation, whereas the intensity of these reflections is related in a linear relationship to the measured weight loss. Using powder XRD patterns and the Rietveld method, Suitch (Reference Suitch1986) found that a highly ordered Keokuk kaolinite sample was dehydroxylated by up to 40% after heating at 455°C, and that the individual crystallites spontaneously reacted either completely, to form metakaolinite, or not at all, with the latter crystallites retaining all of the structural details of the initial kaolinite. Following these publications, it was commonly accepted that partially dehydroxylated kaolinite samples consist of a physical mixture of two phases: initial, non-dehydroxylated kaolinite and metakaolinite (Bergaya et al., Reference Bergaya, Dion, Alcover, Clinard and Tchoubar1996).
Recently, Drits et al. (Reference Drits, Derkowski, Sakharov and Zviagina2016) determined the phase composition of partially dehydroxylated specimens of two Clay Minerals Society Source Clay kaolinite samples, KGa-1 and KGa-2, using XRD, infrared spectroscopy and thermogravimetric data. For the first time, the transition from kaolinite to metakaolinite was shown to be accompanied by the formation of intermediate phases with specific diffraction and spectroscopic features. This result clearly contradicts the conventional view of the phase composition of partially dehydroxylated kaolinites. In the present article, modelling of experimental XRD patterns is used to determine the phase composition of partially dehydroxylated kaolinite samples independently of the experimental conditions of their dehydroxylation. In particular, two different kaolinite dehydroxylation reaction pathways were observed. In one, a partially dehydroxylated specimen consists of two phases: the original kaolinite and its dehydroxylated product, metakaolinite. In the other, along with the above two phases, an additional intermediate phase is formed, the diffraction features of which correspond to a defective kaolinite structure.
The structure of kaolinite
Kaolinite, Al2Si2O5(OH)4, is a common dioctahedral 1:1 layer mineral; its layers consist of one octahedral sheet and one tetrahedral sheet that are bound to each other via apical oxygen atoms. One of the important factors responsible for cohesion of the adjacent layers is hydrogen bonding from OH groups on the basal surface of one layer to oxygen atoms forming a basal surface of the next layer. The octahedral sheet of the kaolinite layer contains three symmetrically independent sites differing in the arrangement of OH groups and oxygen atoms coordinating two Al cations and one vacant octahedron. A defect-free kaolinite has a one-layer triclinic structure and a C1 space group (Bailey, Reference Bailey and Bailey1988; Bish & von Dreele, Reference Bish and von Dreele1989). Nonetheless, the characteristic feature of most kaolinite varieties is that they have a defective structure (Brindley et al., Reference Brindley, Kao, Harrison, Lipsicas and Raythatha1986; Bailey, Reference Bailey and Bailey1988). The nature of defects in kaolinite structures has been the subject of intense discussion. Bookin et al. (Reference Bookin, Drits, Plançon and Tchoubar1989) comprehensively analysed the possible defects in the kaolinite structure and concluded that the distortions of the actual 1:1 layer structure do not allow such stacking faults as ±120° layer rotations and ±b/3 interlayer translations, nor the vacancy displacement model suggested in the literature (Brindley & Robinson, Reference Brindley and Robinson1946; Murray, Reference Murray1954; Plançon & Tchoubar, Reference Plançon and Tchoubar1977). According to the model of Bookin et al. (Reference Bookin, Drits, Plançon and Tchoubar1989), two different layer displacement vectors, t1 and t2, related by a pseudo-mirror plane passing through the centre of the vacant octahedral site and the long diagonal of the kaolinite layer unit cell form defect-free enantiomorphic kaolinite structures that cannot be distinguished by XRD. Random interstratification of the layer displacements within individual kaolinite crystallites results in right-hand and left-hand kaolinite subsequences of the same layers and thus produces most of the structural disorder of kaolinite. Because of the approximately trigonal symmetry of the kaolinite layer, a third layer displacement vector, t0, directed along the pseudo-mirror plane, may also exist in the kaolinite structure. Thus, a reliable model of the defective kaolinite structure should be defined by probabilities  $W_{t_1}$,
 $W_{t_2}$ and
 $W_{t_0}$, of t1, t2 and t0 layer displacements, respectively, which may be determined by the simulation of the experimental powder XRD pattern of a kaolinite sample. Interstratification of the right- and left-hand structural fragments consisting of the same layer types in natural kaolinite samples is in agreement with the results of high-resolution transmission electron microscopy (Kogure & Inoue, Reference Kogure and Inoue2005; Kogure et al., Reference Kogure, Johnston, Kogel and Bish2010). Based on this model, Plançon et al. (Reference Plançon, Giese, Snyder, Drits and Bookin1989), Reynolds & Bish (Reference Reynolds and Bish2002) and, more recently, Sakharov et al. (Reference Sakharov, Drits, McCarty and Walker2016) simulated a set of the experimental XRD patterns of natural kaolinite samples and showed that, as a rule, they consist of a physical mixture of two distinct populations of kaolinite crystallites, one that has a defect-free or almost defect-free structure and another that consists of highly defective structures.
Materials and methods
Samples
The two samples investigated in this study are a ‘Hywite Alum’ raw kaolinite (a ‘ball clay’ from Devon, UK) obtained from Imerys (UK), hereafter referred to as the ‘Imerys’ sample, and The Clay Minerals Society's source clay kaolinite, KGa-2. We note, however, that the diffraction features of the studied KGa-2 sample differ substantially from those described by Sakharov et al. (Reference Sakharov, Drits, McCarty and Walker2016) and Drits et al. (Reference Drits, Derkowski, Sakharov and Zviagina2016). To highlight this difference, hereafter this sample is referred to as KGa-21. The phase composition of the Imerys sample is 85.3% kaolinite, 4.6% quartz, 3.0% illite, 0.9% iron oxide (Fe2O3), 0.8% anatase, and ~6.0% organic matter. The phase composition of the Imerys sample was determined by phase analysis based on its XRD pattern, chemical and thermogravimetric data and qualitative and quantitative analyses of gas molecules formed during dehydroxylation. The phase composition of KGa-21 includes, along with kaolinite, ~2% anatase. The KGa-21 sample, having unimodal particle-size distribution, was mixed with National Institute of Standards and Technology (NIST) 10% silicon powder standard SRM640 to serve as an internal standard for subsequent intensity normalization purposes.
Heating procedure
Homogenized samples were split into representative fractions of equal amounts. To demonstrate that the phase transformation from kaolinite to metakaolinite does not depend on particular geometrical forms, the Imerys sample was placed in a Petri dish. The dishes were ~3 cm in diameter and contained a friable powder ~1 cm thick from the bottom, whereas the KGa-21 sample was loosely and equally spread thin into a 2 mm-thick layer with a smooth surface of 5 cm diameter on stainless steel plates that were actually flat crucibles. The samples were heated in a laboratory furnace. A special thermocouple was placed accurately at the sample position. The furnace was heated and allowed to become stable over 3 h at the selected temperature before introducing the sample. After a fixed time of isothermal treatment, the heating was stopped, and cooling of the heated samples occurred at room temperature and 40% relative humidity. Each Imerys specimen was heated for 2 h at 150°C, 400°C, 425°C, 450°C, 475°C, 500°C, 525°C and 550°C. The KGa-21 specimens were heated at 150°C, 400°C, 420°C, 427°C, 438°C and 495°C for 1 h. The heated specimens were kept in a dry atmosphere until they were analysed. The term ‘heated specimen’ indicates that the heating was performed before XRD patterns were obtained.
X-ray diffraction
The XRD patterns were recorded using Co-Kα radiation with Phillips PW1050 and PW3040 diffractometers. The PW1050 diffractometer has a vertical goniometer with a normal focus tube, Kβ-filter and pulse-height selection. The PW3040 diffractometer has a vertical goniometer with a curved graphite monochromator, fine-focus tube and solid-state detector. For powder XRD patterns of the specimens in the interval 1.5–80°2θ, fixed divergence and receiving slits (1°, 1° and 0.1°, respectively) were used, and intensities were recorded for 100 s per 0.02°2θ step. The PW3040 diffractometer was fitted with two 2.5° Soller slits. For each heated specimen, a flat rectangular sample holder with dimensions of 4.5 cm × 2.5 cm × 0.3 cm contained the same mass of sample. The heated specimens of both samples were recorded with the two diffractometers.
Simulation of the experimental XRD patterns
An effective way of obtaining quantitative information about the defect structure of a mineral is to simulate diffraction effects using a model that provides the best possible agreement between the positions, intensities and profiles of the hkl reflections observed in the calculated and experimental XRD patterns (Drits & Tchoubar, Reference Drits and Tchoubar1990). This approach has been applied widely and successfully to various layer minerals with defective structures (Plançon et al., Reference Plançon, Giese, Snyder, Drits and Bookin1989; Drits & Tchoubar, Reference Drits and Tchoubar1990; Sakharov et al., Reference Sakharov, Lindgreen, Salyn and Drits1999; Drits et al., Reference Drits, Lindgreen, Sakharov, Jakobsen, Salyn and Dainyak2002a, Reference Drits, Sakharov, Dainyak, Salyn and Lindgreen2002b, Reference Drits, Lindgreen, Sakharov, Jakobsen and Zviagina2004; Lindgreen et al., Reference Lindgreen, Drits, Sakharov, Jakobsen, Salyn, Dainyak and Krøyer2002; Ferrage et al., Reference Ferrage, Lanson, Sakharov, Geoffroy, Jacquot and Drits2007; Lanson et al., Reference Lanson, Sakharov, Claret and Drits2009; McCarty et al., Reference McCarty, Sakharov and Drits2009; Sakharov & Lanson, Reference Sakharov, Lanson, Bergaya and Lagaly2013; Sakharov et al., Reference Sakharov, Drits, McCarty and Walker2016). To simulate diffraction effects for kaolinite structural models, the refined atomic coordinates of Bish & von Dreele (Reference Bish and von Dreele1989) and a homemade program of Sakharov & Naumov based on algorithms described by Drits & Tchoubar (Reference Drits and Tchoubar1990) were used. One type of model includes a statistically homogeneous population of crystallites, each of which has a given content of the randomly interstratified layer displacement vectors and thus corresponds to a low-ordered structural phase. The other type of model is based on a physical mixture of two crystallite populations with contrasting structural orders (i.e. with very small numbers and very large numbers of stacking faults resulting from the interstratification of the layer displacements). In the models, the coherent scattering domains (CSDs) consist of a set of strictly parallel layers, which in the layer plane have a disc-like shape with the same distribution of radii, the breadth of which is determined as D(min) – D(max) (see Table 1). Along the c* axis, the CSD sizes have a log-normal distribution, and the parameters of this distribution are determined using the mean thickness of the CSD and the regression of Drits et al. (Reference Drits, Środoń and Eberl1997) with mean (N) and maximum (N max ≈ 5N according to Reynolds, Reference Reynolds1985) thicknesses as variable parameters (see Table 1). Corrections for instrumental variables, such as horizontal and vertical beam divergence, and dimensions and thicknesses of samples are performed according to the recommendations of Drits et al. (Reference Drits, Kameneva, Sakharov, Daynyak, Tsipurski, Smolyar, Bookin and Salyn1993) and Reynolds (Reference Reynolds1986). A model of the defective kaolinite structure is defined by the probabilities $\; \; W_{t_1}$,
 $W_{t_2}$ and
 $W_{t_0}\; $ of t1, t2 and t0 translations, respectively, for each of the coexisting populations.
Structural parameters of the HOK and LOK fractions of the Imerys and KGa-21 samples.

W a is the amount of arbitrary stacking faults, which displace adjacent layers with respect to each other in arbitrary directions and arbitrary distances (see details in Drits & Tchoubar, Reference Drits and Tchoubar1990), N is the mean number of layers in the coherent scattering domain (CSD), D (Å) is the uniform distribution of CSD diameters (the same distribution was used for all angular ranges) and N(α) is a factor estimating the degree of particle orientation.
If the length of the displacement vectors is not fixed, their variation around the average value is described by Gaussian distributions. This distribution is expressed by the term exp(–π2[h 2δx2 + k 2δy2]), where δx and δy are the characteristic widths (in fractions of the unit cell) of the distribution along the a- and b-directions, respectively, and h and k are the Miller indices.
The degree of particle orientation is estimated by a parameter N(α)° (equal to a full width at half height of a particle distribution function) (Drits & Tchoubar, Reference Drits and Tchoubar1990). The structural parameters for each of the populations are changed step by step using a trial-and-error approach. At each step, the program automatically seeks the best agreement between experimental and calculated XRD patterns by adjusting the relative contributions of each population.
The quality of the agreement between the compared XRD patterns is estimated by the profile factor R p:
 $$R_p = \displaystyle{{\mathop \sum \nolimits_i \vert {I_i^{{\rm exp}} \; -\; I_i^{{\rm calc}}} \vert } \over {\mathop \sum \nolimits_i I_i^{{\rm exp}}}}, $$
where $\; I_i^{{\rm exp}} $ and
 $I_i^{{\rm calc}} $ are the measured and calculated intensities, respectively, each i step increment.
Results
Structural characterization of initial samples
Figure 1 compares the most diagnostic fragments of the experimental and modelled XRD patterns of the Imerys and KGa-21 samples. The results of the modelling show that both samples consist of two populations of kaolinite crystallites differing in their degree of structural order. These populations of each sample will be termed high-ordered kaolinite (HOK) and low-ordered kaolinite (LOK) structures. Table 1 contains the set of the probability parameters describing the HOK and LOK structural modifications in each sample as used for the modelling of the powder XRD patterns. The samples differ in the relative amounts, as well as in the structural order of the HOK and LOK components (Table 1). The proportion of the HOK fraction in the Imerys sample is 20% and its structure is almost defect free, as 90% of layer pairs are related by the layer displacement vector t1, 8% of layers pairs form enantiomorphic fragments and only 2% of layer pairs are related by the vector t0. In contrast, in the LOK structure, the right- and left-handed kaolinite structural fragments are randomly interstratified in almost equal proportions (Table 1). Compared to the Imerys kaolinite, the KGa-21 kaolinite contains a slightly smaller number of the HOK crystallites (16.6%), having a lower degree of structural order (18% of layer pairs are related by the layer displacement vector t2). The structural disorder of the LOK crystallites in both samples is quite similar (Table 1). Figure 1 shows the XRD patterns calculated for the HOK and LOK populations of crystallites of both kaolinite samples. The high degree of structural order of the HOK structure in the Imerys and KGa-21 kaolinites provides intense and sharp reflections in the 11,02 region (Fig. 1). The profiles and intensities of 20l and 13l reflections calculated for the HOK and LOK models of both samples are very similar (Fig. 1). Sakharov et al. (Reference Sakharov, Drits, McCarty and Walker2016) showed that this similarity is typical of kaolinite in which the right and left enantiomorphic fragments coexist, and that it is independent of their proportions. In the calculated XRD patterns of the LOK models, the 11,02 regions are similar for both samples (Fig. 1). For the Imerys and KGa-21 samples, the optimal agreement between the experimental and calculated XRD patterns was achieved at R p = 4.5% and R p = 4.0%, respectively. The different contents and levels of structural disorder in the HOK models of the samples are responsible for the substantial difference between the observed XRD patterns of the samples. In particular, the diffraction features in the XRD pattern of the Imerys sample are determined by the major contribution of the HOK structure to the positions, widths and intensities of the 11l,02l reflections, whereas the LOK structure contributes to the background, in a non-uniform manner, and to the intensity of the 020 reflection of the HOK structure from the rather sharp leading edge of the 11,02 region (Fig. 1). The slightly smaller content of the HOK structure and increased disorder in this HOK contribution in the KGa-21 sample provide the low modulated diffraction maxima in the 11,02 region of the experimental XRD pattern.
The most indicative fragments of the XRD patterns corresponding to the HOK and LOK fractions and to the optimal summation of the XRD patterns of the fractions providing the best possible agreement between the simulated and experimental (black lines) XRD patterns of the Imerys and KGa-21 samples. Indices of individual reflections in the 11,02 and 20,13 regions are given in the XRD patterns of the HOK fractions of the Imerys and KGa-21 samples. A = anatase; Q = quartz.

Main diffraction features of specimens heated at different temperatures
Imerys sample
The XRD patterns obtained from the specimens heated at different temperatures (T) may be subdivided into three groups. The XRD pattern of the sample heated at 400°C coincides with that heated at 150°C (not shown). The XRD patterns of the specimens heated up to 425–500°C are also similar to that of the non-dehydroxylated sample with respect to the positions of the corresponding hkl reflections (Figs 2, 3). However, the intensities of the hkl reflections in the XRD patterns of this group decrease progressively with temperature, while the diagnostic 11l and 02l reflections become significantly broader, less resolved or almost absent. The XRD patterns of the specimens heated at 550°C and 750°C (not shown) are similar to each other and correspond to that of metakaolinite (Figs 2, 3).
Comparison of the fragments containing reflections in the 11,02 regions of the experimental XRD patterns of the Imerys and KGa-21 specimens heated at different temperatures. A = anatase; Q = quartz.

Comparison of the fragments containing the 20l,13l reflections of the experimental XRD patterns of the Imerys and KGa-21 specimens heated at different temperatures. A = anatase; Q = quartz.

KGa-21 sample
The characteristic feature of the XRD patterns observed for specimens heated at different temperatures is that their diagnostic 11,02 regions consist of a single broad and rounded maximum with a sharp leading edge, reminiscent of the 020 reflection from a 3D structure (Fig. 2). The asymmetry and width of the broad maxima increase progressively with temperature, whereas the intensity of the sharp leading edges decreases with heating temperature and becomes negligible in the XRD pattern of the specimen heated at 450°C, which shows no leading edge (Fig. 2). The evolution of 20l,13l reflections with increasing temperature is similar for both samples and is mostly accompanied by a progressive decrease in the intensities of the reflections (Fig. 3). The most significant result, however, is that the XRD patterns of metakaolinite formed after the thermal decomposition of the Imerys and KGa-21 samples at 550°C and 495°C, respectively, have two fundamentally different intensity distributions (Fig. 2). In particular, the XRD pattern of Imerys metakaolinite contains a relatively intense and sharp maximum at 22.85°2θ, whereas the XRD pattern of KGa-21 metakaolinite does not contain any modulation in this region.
Metakaolinite contents determined by optimal summation of the experimental XRD patterns
We used an XRD pattern summation procedure to determine the content of metakaolinite in the heated samples. Our approach here was to fit the measured XRD patterns as the optimal sum of their respective kaolinite (T = 150°C) and metakaolinite (Imerys T = 550°C, KGa-21 T = 495°C) patterns. To check that the procedure gives a meaningful result, a new specimen was prepared as a physical mixture of 68% non-reacted Imerys kaolinite and of 32% Imerys metakaolinite. Excellent agreement was obtained between the experimental XRD pattern of the mixed sample and the XRD pattern simulated as a sum of 68.5% of the pattern of the initial sample and 31.5% of the pattern of the metakaolinite (R p = 4.5%; Fig. 4a).
The XRD pattern (a) demonstrates the perfect agreement between the experimental XRD pattern of the mixed sample and the XRD pattern obtained after summation of 68.5% and 31.5% of the XRD patterns corresponding to the initial Imerys sample (b) and its metakaolinite (c). A = anatase; Q = quartz.

A similar approach was used to obtain the best possible agreement between the experimental XRD patterns of the various kaolinite specimens heated at different temperatures and those simulated as optimal mixtures of the XRD patterns of the Imerys and KGa-21 samples heated at 150°C and the corresponding metakaolinites taken in different proportions. Importantly, to simulate the experimental XRD patterns of the Imerys and KGa-21 heated specimens, XRD patterns of metakaolinites corresponding to each sample were used. This procedure determines at least the amount of metakaolinite in the heated specimens.
Imerys sample
The agreement between the XRD patterns of specimens heated at <550°C and those obtained by the optimal summation of the XRD patterns of the initial kaolinite and metakaolinite (Figs 5, 6) is direct evidence of the coexistence of the initial kaolinite and metakaolinite in each heated specimen. The contributions of the XRD patterns of metakaolinite, Cmk, to the XRD patterns of the heated specimens (Table 2) led to low R p factors (5.8–6.1%).
The best possible agreement between the experimental (black line) XRD patterns in the 11,02 regions of the Imerys and KGa-21 specimens heated at different temperatures and the XRD patterns obtained as a result of the optimal summation of the XRD patterns corresponding to each of the non-reacted samples and metakaolinites. A = anatase; Q = quartz.

The best possible agreement in the region of the 20l,13l reflections between the experimental XRD patterns (black line) of the Imerys and KGa-21 specimens heated at different temperatures and the XRD patterns obtained as a result of the optimal summation of the XRD patterns corresponding to each of the non-reacted samples and metakaolinites. A = anatase; Q = quartz.

The values of the content of metakaolinite, C mk, for specimens of the Imerys and KGa-21 samples heated at different temperatures.

I 002, I Si and I Q are the intensities of the following reflections: 002 kaolinite, the internal standard silicon and quartz.
C mk(1) is the content of metakaolinite values obtained by the simulation of the XRD patterns of the heated specimens.
C inter is the content of the intermediate phases formed in the heated specimens.
C k is the content of the initial untreated kaolinite sample preserved in the heated specimens.
C mk(2) is the content of metakaolinite values obtained from the regression in Eqs (3) and (5) corresponding to Imerys and KGa-21 samples, respectively.
N(α) (°) values are equal to 65 and 60 for Imerys and KGa-21 samples, respectively, at room temperature.
KGa-21 sample
The XRD pattern of the specimen heated at 495°C shows no hkl reflections of kaolinite, which reflects the particular nature of the metakaolinite formed in this sample (Figs 2, 3). To determine the amount of metakaolinite in each heated specimen, the best possible agreement was achieved between the observed XRD pattern and the XRD pattern obtained as the optimal summation of the XRD patterns of the initial sample heated at 150°C and metakaolinite formed after heating of the sample at 495°C (Figs 5, 6). This shows that the increase in heating temperature is accompanied by a progressive increase in the contents of the metakaolinite phase from 14.7% at 420°C to 90.4% at 450°C (Table 2). However, the XRD patterns obtained after the optimal summation procedure differ substantially from the corresponding XRD patterns of the heated specimens (Fig. 5). Indeed, in the 22.8–26.0°2θ region, the intensities in the summed XRD patterns are less than those in the XRD patterns of the heated specimens. Moreover, comparison of the calculated and experimental patterns shows that the difference between the intensities in the regions varies irregularly as a function of the preheating temperatures: these differences are relatively small for the specimens heated at 420°C and 450°C; i.e. at the beginning of the reaction and close to its end. In contrast, for the specimens heated at 427°C and 438°C and with moderate (32.6%) and large (57.3%) amounts of metakaolinite, the difference between the intensities of the experimental and simulated XRD patterns is much more marked (Fig. 5). These differences indicate that the thermal decomposition of the KGa-21 specimens is accompanied by the formation of an additional product, hereafter referred to as an intermediate phase with a structure the diffraction signature of which differs substantially from those of the initial kaolinite and metakaolinite. At this point, it is important to recall that the optimal summation procedure provides good agreement between the positions and intensities of basal reflections in the XRD patterns of the heated specimens and the corresponding simulated mixture patterns, which are composed only of the initial kaolinite and the metakaolinite patterns (Fig. 5).
Metakaolinite contents in the heated specimens determined by an internal standard method
To cross-check the validity of the results obtained for the metakaolinite contents by the pattern summation method described above, quantitative phase analysis of the heated specimens was also carried out based on the intensity variations of the 002 reflections of kaolinite: in the case of the Imerys sample, this was relative to the nearest reflection of quartz with d = 3.35 Å and present at a known concentration of 4.6 wt.%, and in the case of the KGa-21 sample, this was with respect to the added (10 wt.%) silicon powder standard with d = 3.135 Å. The contents of quartz and silicon were assumed to be constant in the Imerys and KGa-21 specimens, each of which has the same mass absorption coefficient. Therefore, for a kaolinite sample in which the wt.% concentrations of metakaolinite in the heated specimens vary within a certain range, if the content of the internal standard is constant, the ratio of the intensities of the chosen reflections, I 002 and I S, should be proportional to the wt.% of kaolinite, C k, in each studied specimen. That is:
 $${I}_{002}/{ I}_{\rm S} = {\rm K}{ C}_{\rm k}$$
where K is a constant (analogous to a reference intensity ratio).
Imerys sample
Following the approach described above, the ratios of intensities of the 002 kaolinite and quartz reflections in the XRD patterns of the heated specimens, I 002/I Q, were measured (Table 2). For each specimen heated at a given temperature, the metakaolinite content (Table 2) was determined by the summation procedure. The I 002/I Q ratio and the metakaolinite content, C mk (%), of the corresponding specimen were found to be related by a linear regression equation (Fig. 7):
 $$\lpar {{I}_{002}/{I}_{\rm Q}} \rpar _{\rm T} = {\rm} - 0.0242{ C}_{{\rm mk}} + {\rm} 2.4423,{\rm} {\rm R}^2 = {\rm} 0.9999$$
The linear relationships between the amount of metakaolinite, C mk, and ratios of the I 002/I Si and of the I 002/I Q values corresponding to the KGa-21 and Imerys specimens heated at different temperatures. In the regressions, the x and y values correspond to the C mk and the intensity ratios, respectively.

According to Eqs (1) and (2), the I 002/I Q ratio is proportional to the kaolinite content, C k, which remained in each heated specimen, whereas the coefficient K in Eq. (1) is given by the intercept in Eq. (2). Thus:
 $$\eqalign{\lpar {{I}_{002}/{I}_Q} \rpar _{\rm T} & = {\rm} 0.02442{ C}_{\rm k} = {\rm} - 0.0242{C}_{{\rm mk}} + {\rm} 2.442 \ {\rm and} \cr {C}_{\rm k} & = {\rm} \lpar {100 - 0.991{C}_{{\rm mk}}} \rpar} $$
It is remarkable that the regression line intersects the abscissa axis at the point where C mk = 100%, i.e. the point at which the kaolinite sample was completely transformed into metakaolinite (Fig. 7). The line intersects the ordinate axis at a point that is slightly higher than the I 002/I Q value corresponding to the non-heated Imerys sample (Fig. 7). Regardless of the degree of their dehydroxylation, the specimens heated at ≥150°C have identical values for the degree of particle orientation, N(α), which, however, is slightly higher than that of the original sample. The corresponding calculations showed that for specimens heated at 150°C, the N(α) = 65° value is some 30° smaller than that for the room-temperature sample (Table 2). Further increases of temperature do not influence the degree of particle orientation. The results obtained are similar to those of Brindley & Hakahira (Reference Brindley and Nakahira1956, Reference Brindley and Nakahira1957), who used different geometrical forms in their heating procedure.
KGa-21 sample
Similar to the Imerys sample, the ratios of intensities I 002/I Si and the values of metakaolinite contents, C mk, of the specimens heated at different temperatures are related by a regression:
 $$\lpar {{I}_{002}/{ I}_{{\rm Si}}} \rpar _{\rm T} = {\rm} - 0.0138{C}_{{\rm mk}} + {\rm} 1.3913,{\rm} {\rm R}^2 = {\rm} 0.9987$$
where I Si is the intensity of the powder Si standard. Taking into account Eq. (3), it follows:
 $$\eqalign{\lpar {{ I}_{002}/{ I}_{{\rm Si}}} \rpar _{\rm T} & = {\rm} 0.01391{\rm} {C}_{\rm k}{\rm ^{\prime}} = {\rm} - 0.0138{C}_{{\rm mk}} + {\rm} 1.3913 \ {\rm and} \cr \quad {C}_{\rm k}^{\prime}{\rm} &= {\rm} \lpar {100 - 0.992{ C}_{{\rm mk}}} \rpar} $$
The regression straight line covers the range of the metakaolinite content, C mk, from 0% to 100% (Fig. 7, Table 2). For the reasons described above (small differences in preferred orientation), the intersection of the line with the ordinate axis occurs at a point located slightly above that corresponding to the non-heated sample (Fig. 7).
Equations (2) and (5) demonstrate that an almost identical metakaolinite content is derived for each heated specimen using either the linear intensity variation of the 002 kaolinite reflection vs. the measured intensity of the internal standards (quartz and silicon) or the full-pattern XRD simulation based on linear mixing of the XRD patterns of the metakaolinite and the initial kaolinite end members of the Imerys and KGa-21 sample series (Table 2). The agreement provides confirmation that the XRD pattern summation method returns accurate values for the metakaolinite contents of the samples.
Brindley & Nakahira (Reference Brindley and Nakahira1956) also found a linear relationship between the reflected intensity of the 001 and 002 basal reflections and the mass loss or metakaolinite content in partially dehydroxylated kaolinite specimens. Remarkably, the 001 and 002 reflections showed no significant broadening even up to 90% of complete dehydroxylation. More recently, Drits et al. (Reference Drits, Derkowski, Sakharov and Zviagina2016) showed that metakaolinite contents in the same partially dehydroxylated kaolinite specimens determined by the thermogravimetric method and by the methods described above almost coincide. This means that the diffraction features of metakaolinite remain essentially the same at each stage of partial dehydroxylation of kaolinite samples, and the sample mass absorption coefficient is approximately constant over this temperature range. In addition, the application of the internal standard method, although providing reliable values of the metakaolinite contents, does not reveal information about a possible formation of intermediate phases.
Identification of the XRD patterns of the intermediate phase
Figure 8 shows the XRD patterns of KGa-21 specimens heated at different temperatures. In contrast to the previous XRD patterns, the diffraction range of the patterns in Fig. 8 is extended from 001 to 060 reflections. To determine the amount and diffraction features of the intermediate phases, the contribution of the initial kaolinite needed to be subtracted from the metakaolinite-subtracted XRD patterns (Fig. 9). This subtraction was performed by the program which decreased successfully the amount of non-treated kaolinite, to avoid negative intensities in the resulting XRD patterns; i.e. the intensity at any portion of the differential curves could not to drop below zero. The resulting pattern is interpreted as corresponding to the intermediate phase of the particular specimen (Fig. 10). The results of this procedure allow for the determination of the actual amount of untreated initial kaolinite, C k, intermediate kaolinite phase, C inter, and metakaolinite, C mk, in the specimens heated at each temperature (Table 2).
XRD patterns of the specimens of the KGa-21 sample heated at different temperatures. A = anatase.

XRD patterns obtained as a result of subtraction from the experimental XRD patterns of the heated specimens of the contributions of the XRD patterns of the metakaolinite phase corresponding to the C mk value in each heated specimen. The upper XRD pattern corresponds to initial KGa-21 kaolinite.

XRD patterns of the intermediate phases obtained by subtraction from the experimental XRD pattern of each heated specimen of the contributions of the XRD patterns of metakaolinite and the KGa-21 sample the content of which was decreased until the negative intensities reached zero values.

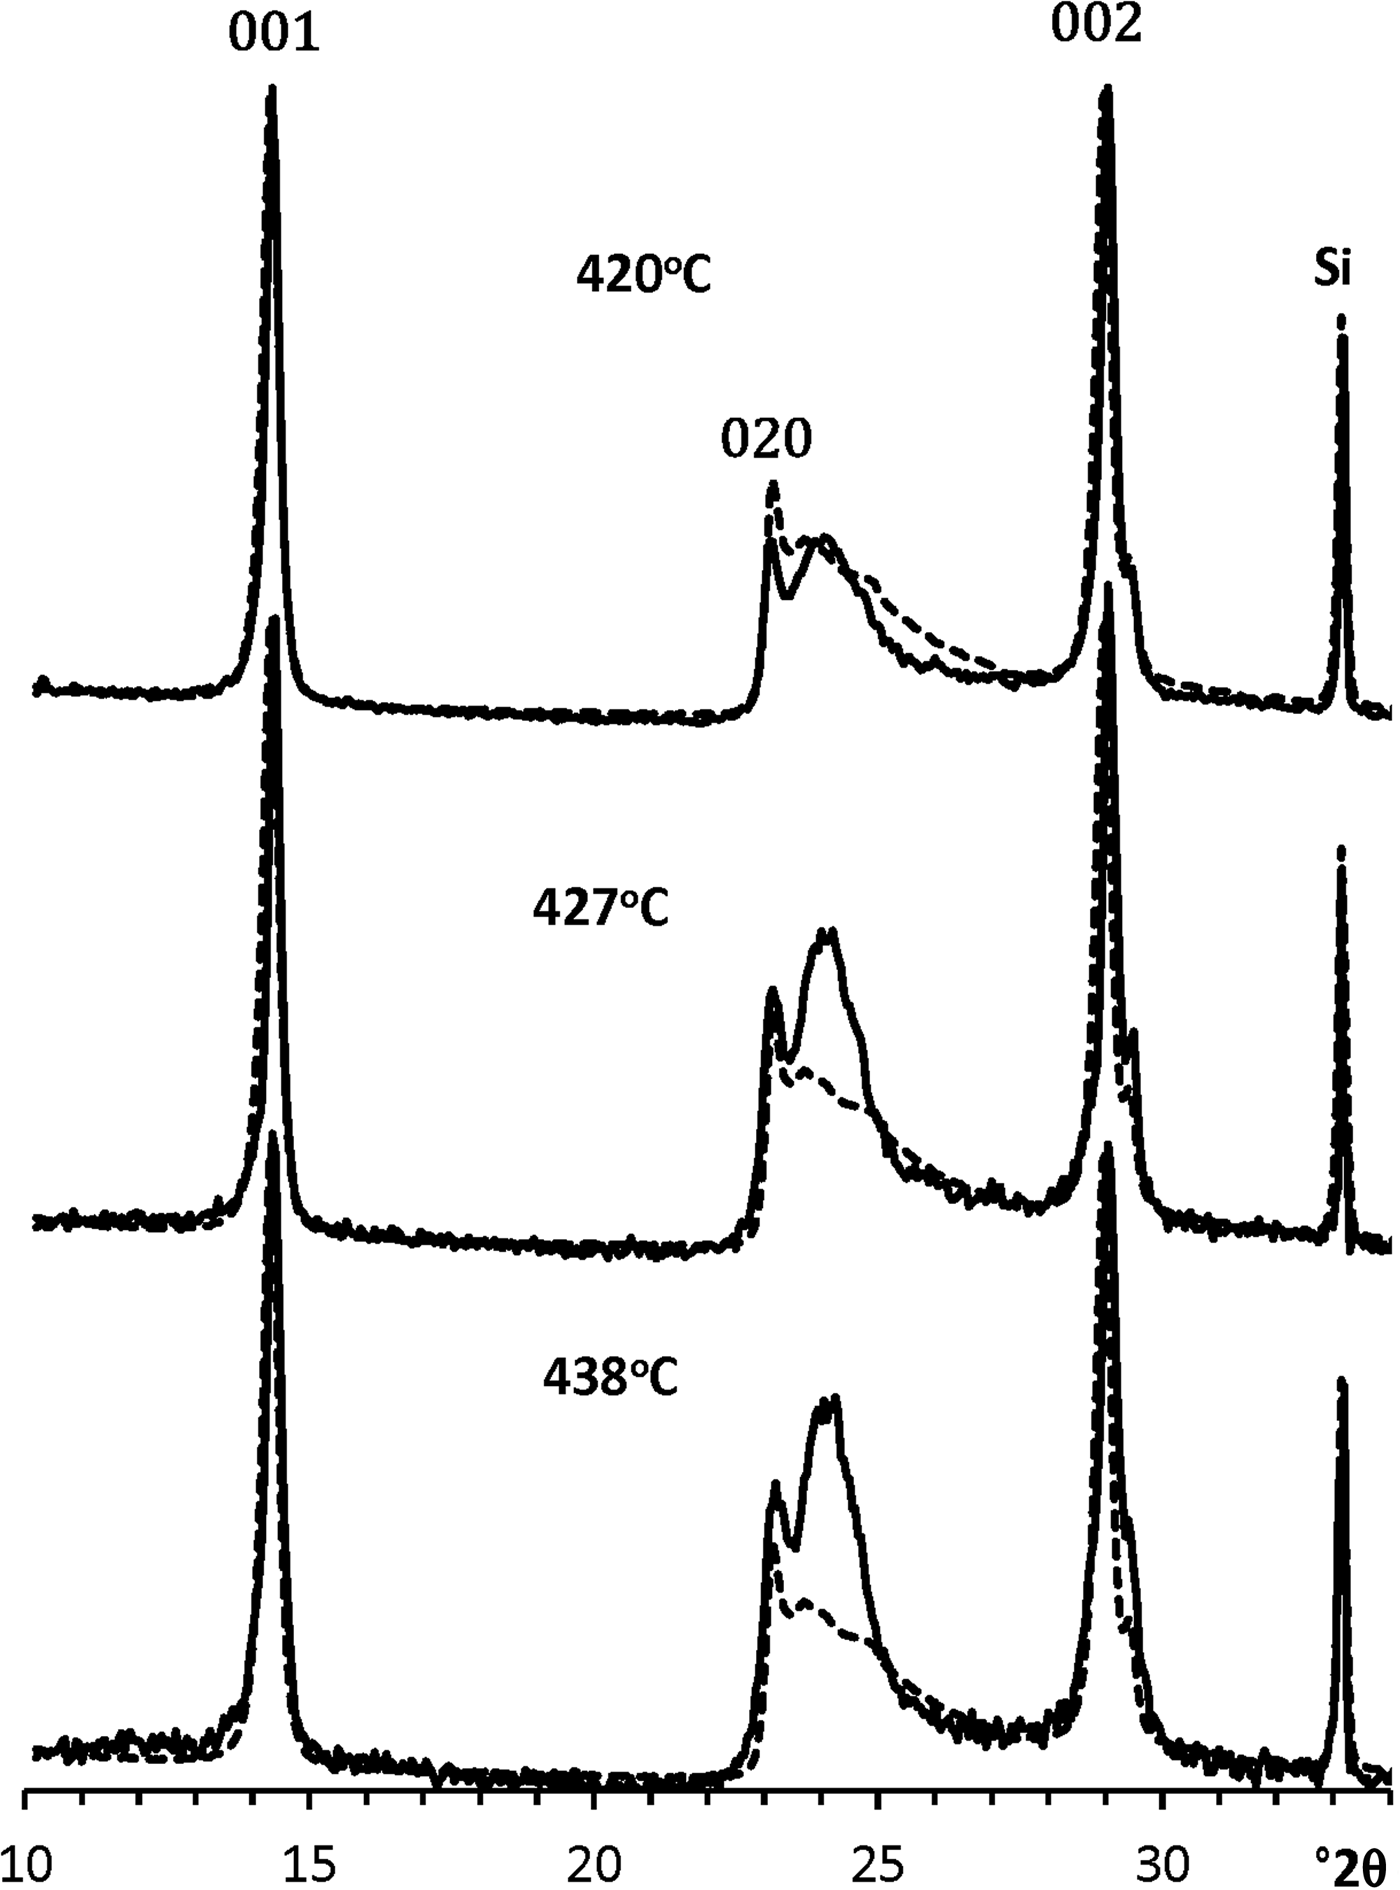
The most remarkable feature of the XRD patterns of the intermediate phase of the sample formed at C mk < 90% is that they contain a nearly rational series of basal reflections (Fig. 10). This means that kaolinite layers retain their fundamental one-dimensional periodicity along the c* axis, along with the layer-to-layer distance during the formation of the intermediate phase. Notably, the basal reflections of the intermediate phases preserve their narrow shape and high intensities in comparison with those of the other hkl reflections. To illustrate this, Fig. 11 compares the XRD patterns of the untreated initial KGa-21 sample and those of the intermediate phases formed after heating at different temperatures. The intensities in these traces were normalized to the internal standard intensities, which, in turn, were normalized to the intensity of the standard in the XRD pattern of the intact kaolinite sample. This clearly shows that the positions of the 001 and 002 basal reflections in the compared XRD patterns are shifted slightly towards higher 2θ, probably because the layer-to-layer distances decrease slightly due to the heat treatment. It also seems remarkable that the regular layer-by-layer sequence along the c* axis is the last remainder of structural ordering observed just before pure metakaolinite was formed at >450°C (Fig. 8). Finally, similar to metakaolinite, the diffraction signature of the initial kaolinite remains constant over the whole temperature range investigated.
Comparison of the XRD pattern of the untreated KGa-21 sample (dashed lines) with those of the intermediate phases formed after their heating at various temperatures (solid lines). The intensities of the Si reflections observed in the XRD patterns of the intermediate specimens were normalized to that of the XRD pattern of the initial sample.
Discussion
Structural paths of partial dehydroxylation of the studied samples
Imerys specimen
The phase composition of the partially dehydroxylated specimens heated within the temperature range of 425–500°C is a physical mixture of the initial (non-dehydroxylated) kaolinite and metakaolinite. This conclusion agrees with the results obtained by Bergaya et al. (Reference Bergaya, Dion, Alcover, Clinard and Tchoubar1996), who studied the ‘Gabriel’ (UK) kaolinite sample by transmission electron microscopy and selected area electron diffraction using controlled-rate thermal analysis and concluded that only two phases – initial non-dehydroxylated kaolinite and metakaolinite – coexist during the sample dehydroxylation. Such coexistence probably means that the dehydroxylation process occurs as a zero-order reaction, which is also typical of partially dehydroxylated dioctahedral 2:1 layer silicates including clay minerals (Drits et al., Reference Drits, Derkowski and McCarty2011a, Reference Drits, Derkowski and McCarty2011b, Reference Drits, Derkowski and McCarty2012a, Reference Drits, McCarty and Derkowski2012b). This implies that, during partial dehydroxylation, a non-dehydroxylated layer transforms into a completely dehydroxylated layer without the formation of any intermediate structure. In addition, if all of the layers in a crystal have identical structural and chemical features, the reaction should occur uniformly throughout the crystal, leading to crystal-by-crystal formation. Therefore, a certain amount of kaolinite crystallites of the specimen transforms into metakaolinite compounds in which the tetrahedral sheets of dehydroxylated layers probably preserve their flat surfaces.
KGa-21 specimen
Diffraction features of the intermediate phases, evolution of their content and interpretation
To a certain extent, the diffraction features of the intermediate phases inherit those of the initial kaolinite structure. To elucidate the specific diffraction features of the intermediate phases, they were compared with those of the initial kaolinite structure. For convenience, the consideration was confined to the most diagnostic 20,13 region (Fig. 12). This region of the XRD pattern of each intermediate phase calculated by subtracting metakaolinite and the initial kaolinite (C k) contents (Fig. 10) was normalized to that of the untreated sample. Although the two characteristic triplets of 20l and 13l reflections are pronounced in the intermediate phases, the positions of these reflections as well as their intensities changed significantly, especially for the phase formed at 450°C (Fig. 10). In particular, the 13l reflections of the intermediate phases shifted to lower 2θ angles, whereas the  $1\bar{3}1$ reflection of the phase formed at 420–438°C shifted progressively towards the 131 reflection (Fig. 12). Even more dramatic changes are observed for the
 $1\bar{3}\bar{1}$ reflection: after heating at 420°C, its position was shifted to lower 2θ angles, and at 438°C, its intensity drops down to the XRD pattern background. In agreement with the calculations made by Sakharov et al. (Reference Sakharov, Drits, McCarty and Walker2016) when studying the influence of different layer displacements on the diffraction features of a kaolinite structure, the observed shifts are probably related to layer displacements by the vector t0. However, a significant decrease of intensities with parallel broadening of the 13l,20l reflections of the intermediate phases formed after heating at >420°C could be related to the formation of adjacent layers shifted with respect to each other in arbitrary directions by arbitrary distances. The formation of such arbitrary interlayer displacements disturbs the layer stacking and weakens hydrogen bonding between adjacent layers, whereas increasing the temperature also favours the formation of arbitrary stacking faults. In addition, the contrasting intensity distribution within the 13l,20l triplets might be related to a structural modification of individual layers that preserves the structural periodicity along the c* axis. The layer structural disorder in the intermediate phases is probably associated with the formation of local dehydroxylated domains within the octahedral sheets of the 1:1 layers, in which the six-fold coordination around Al cations is violated and the atomic positions are rearranged. This assumption is in agreement with the metakaolinite model of White et al. (Reference White, Provis, Riley, Kearley and van Deventer2009, Reference White, Provis, Proffen, Riley and van Deventer2010b), which retains the 1:1 layering of the initial kaolinite structure, although the layers are buckled locally, because the octahedral coordination of Al is replaced by multi-coordinated environments.
Comparison of the fragments of the experimental XRD patterns of the untreated KGa-21 sample containing the 20l,13l reflections (dashed lines) with those of the intermediate phases formed in the KGa-21 sample heated at various temperatures, obtained by metakaolinite and kaolinite subtraction (solid lines). Intensities of the experimental XRD patterns of the intermediate phases were normalized to that of the XRD pattern of the untreated sample.

The diffraction features observed in the 02,11 regions of the intermediate phases (Fig. 10) are in agreement with those discussed for the 20,13 regions (Fig. 12). The intensity of the 020 reflection of intermediate phases decreases progressively with temperature and becomes negligible after heating to 450°C. At this temperature, the layer structure of the intermediate phase practically loses two-dimensional periodicity.
To conclude, the intermediate phases have defective kaolinite-like structures, the diagnostic diffraction features of which disappear progressively with increasing heating temperature because of the formation of random stacking faults and possible local dehydroxylation of the octahedral sheets.
Remarkably, the 00l reflections are the last diffraction features to be observed in the sample just before its full dehydroxylation.
Possible mechanism of structural transitions
Drits & Derkowski (Reference Drits and Derkowski2015) used a multi-cycle heating and cooling thermogravimetric method to study the kinetic behaviour of Keokuk, KGa-1 and KGa-2 kaolinite samples. Each cycle of partial dehydroxylation was shown to involve two kinetic mechanisms, and the reaction rate of dehydroxylation was computed for each of them. The first mechanism corresponds to a zero-order reaction that occurs as the first step in each cycle. This implies that the reaction is homogeneous, and each non-dehydroxylated layer is transformed into a metakaolinite layer. The kinetic mechanism of the second step of the same cycle corresponds to a temperature range that is higher than that of the first step of the same cycle. The acceleration of the reaction of dehydroxylation within this interval decreases, and the mechanism observed for each of the studied samples does not depend on stacking order, average particle size or particle-size distribution; i.e. it is the same for the Keokuk and the KGa kaolinite samples. This feature of the kinetic behaviour of partially dehydroxylated kaolinite allowed us to suggest the general scheme for the structural transformations of the studied kaolinites during partial dehydroxylation at different temperatures assuming that, at each increment of dehydroxylation, the reaction consists of two steps (Drits & Derkowski, Reference Drits and Derkowski2015). At the first step, a number of relatively small, thin particles that are unstable at this temperature transform into metakaolinite without any intermediate. At the second step of partial dehydroxylation, the reaction mechanism deviates from a zero-order reaction because the thermal energy available becomes insufficient to provide transformation of the remaining non-dehydroxylated particles into metakaolinite, but is still sufficient to transform coarser particles into the intermediate phase. It is probable that, at the first and the second steps, some of the smaller and larger particles, respectively, are involved in the reaction. At greater heating temperatures, the proportion of relatively small particles corresponding to the intermediate phase transformed into metakaolinite, and higher thermal energy should also be able to produce a new proportion of the intermediate phase among coarser particles. However, the structure of this intermediate phase should undergo deeper distortions as compared to those taking place at the preceding heating temperature. Additionally, a proportion of large and thermally stable particles should survive at temperatures of <495°C and retain their initial structural features.
The remaining question is: why do kaolinite samples that consist of physical mixtures of the HOK and LOK phases have different structural mechanisms for their transformation from kaolinite into metakaolinite? In particular, it is unclear why, in contrast to the Imerys sample, the dehydroxylation reaction of KGa-1 and KGa-2 kaolinites involves the formation of an intermediate phase (Drits et al., Reference Drits, Derkowski, Sakharov and Zviagina2016).
Diffraction features of the metakaolinite varieties
The XRD patterns of the metakaolinites formed during complete dehydroxylation of the Imerys and KGa-21 samples differ substantially, demonstrating that their structures differ also (Fig. 13). To assist with our discussion, these varieties will be termed metakaolinites of the Imerys and KGa-21 samples, respectively. In particular, the profile and intensity distribution in the XRD pattern of the metakaolinite of the Imerys sample is not typical because it is characterized by an intense and relatively sharp diffraction peak with a strongly asymmetrical profile (Fig. 13a). The position of the peak maximum is shifted slightly towards lower 2θ angles with respect to the position of the 020 reflection in the XRD pattern of the initial sample. In addition, the profile of the maximum is almost identical to those of the 02,11 regions observed in the XRD patterns of a material with a turbostratic layer structure, in which individual layers with relatively large CSDs within the layer ab plane and a two-dimensional periodicity are related to each other by arbitrary stacking faults. It is probable that a similar diffraction effect could appear when, during a zero-order reaction, crystallites of the Imerys sample lost interlayer H2O molecules and transformed into metakaolinite particles in which the tetrahedral sheets of dehydroxylated layers preserve their flat surfaces but lose the strict parallelism and equal distances between adjacent tetrahedral sheets. Interestingly, in certain aspects, this interpretation agrees with the observations of Brindley & Nakahira (Reference Brindley and Nakahira1959). By applying a single-crystal X-ray technique, those authors showed that kaolinite transforms into metakaolinite through ordered recrystallization. In particular, although the metakaolinite obtained after thermal decomposition of a single kaolinite crystal heated at 750°C retains two-dimensional periodicity in the ab plane, there is no regularity along the c* axis.
Comparison of the XRD patterns of metakaolinites formed during dehydroxylation of the (a) Imerys (solid line in insert) and (b) KGa-21 (dashed line in insert) samples. Insert shows that the main difference between the XRD patterns is due to the rather strong and asymmetrical shape of the diffraction maximum at d = 4.492 Å in the XRD pattern of the metakaolinite of the Imerys specimen. A = anatase; Q = quartz.

The XRD pattern of the metakaolinite of the KGa-21 sample showing a wide and weak asymmetrical diffraction maximum is typical of those published in the literature (Brindley & Nakahira, Reference Brindley and Nakahira1959; White et al., Reference White, Provis, Proffen, Riley and van Deventer2010a, Reference White, Provis, Proffen, Riley and van Deventer2010b; Sperinck et al., Reference Sperinck, Raiteri, Marks and Wright2011). The comparison of the profiles of the XRD patterns of the metakaolinites (insert in Fig. 13) shows that the intensity of the maximum responsible for the layer two-dimensional periodicity in metakaolinite of the KGa-21 sample is dramatically lower in the XRD pattern of the metakaolinite of the Imerys sample. This means that, in the latter metakaolinite, there is only a weak tendency towards periodicity within the layers. The second kinetic reaction along with transformation of the intermediate phases into metakaolinite and the formation of a new portion of intermediate phases probably disturbs the structural features of metakaolinite formed at lower temperatures and in zero-order reactions.
Conclusions
Modelling and pattern summation of the experimental XRD patterns are proposed as suitable approaches for the determination of the phase composition of partially dehydroxylated kaolinite samples independent of the experimental conditions of dehydroxylation. The conventional determination of the amounts of the initial kaolinite and metakaolinite in partially dehydroxylated kaolinites based on the XRD and differential thermogravimetric analyses of basal reflections and weight losses allows for correct determination of the metakaolinite content, but may lead to overlooking the formation of intermediate phases. Therefore, to identify unambiguously the presence of either two or three phases in the heated kaolinite samples, the full ranges of their XRD patterns should be analysed.
The application of this technique to the study of partially dehydroxylated specimens of the Imerys and KGa-21 samples provides new insights into the contrasting structural mechanisms accompanying the dehydroxylation of the samples during their transformation into metakaolinite. The results obtained revealed the following structural and diffraction features.
For the Imerys sample:
• At each stage of partial dehydroxylation, the heated specimens consist of two phases: initial non-dehydroxylated kaolinite and metakaolinite.
• The direct transformation of non-dehydroxylated kaolinite crystallites into metakaolinite means that the process corresponds to a zero-order reaction (Drits et al., Reference Drits, Derkowski and McCarty2011a, Reference Drits, Derkowski and McCarty2011b, Reference Drits, Derkowski and McCarty2012a, Reference Drits, McCarty and Derkowski2012b; Drits & Derkowski, Reference Drits and Derkowski2015), according to which non-dehydroxylated kaolinite crystallites transform into hydroxylated metakaolinite.
• The XRD pattern of metakaolinite and thus its structure remain the same regardless of the degree of partial dehydroxylation. Owing to this, the values of the contents of metakaolinite in the specimens heated at different temperatures were determined with high accuracy.
• The profile and intensity distribution of the XRD pattern of metakaolinite formed after heating of the Imerys sample at 550°C are not typical of metakaolinites obtained for other kaolinites and are characterized by an intense and strongly asymmetrical shape of the observed diffraction maximum (at d = 4.492 Å) (Fig. 13a). This feature indicates that the metakaolinite structure is characterized by a strong tendency towards regular structural periodicity along the a and b axes. It is probable that such diffraction features of the Imerys metakaolinite are results of the particular layer dehydroxylation of the kaolinite crystallites of the samples.
For the KGa-21 sample:
• The XRD patterns of metakaolinite formed at different stages of partial dehydroxylation of the heated specimens have the same shapes and intensity distributions. This allows for the proportion of metakaolinite in each heated specimen to be determined using the proposed modelling procedure.
• In contrast to the Imerys sample, the reaction of the structural transformations of the heated KGa-21 specimens is non-homogeneous, and the initial non-dehydroxylated kaolinite transforms into metakaolinite through an intermediate phase. The procedure using optimal summation of the experimental XRD patterns of the initial and heated specimens allows for the coexistence of three phases to be distinguished in partially dehydroxylated kaolinites. The possible structural mechanism of the transformation of kaolinite into metakaolinite through the intermediate phase is suggested.
• Further investigation is required to determine the crystal-chemical factors that are responsible for the particular structural features of the different types of metakaolinites.
Acknowledgements
V.A. Drits, B.A. Sakharov, B.B. Zviagina and O.V. Dorzhieva acknowledge the support of budget project #0135-2016-0010. The authors are very grateful to Dr S. Hillier for his valuable comments and English language corrections.



