


1. Introduction
Middle Devonian lacustrine flagstones deposited within the Orcadian Basin crop out in northern Scotland along Moray Firth and Caithness as well as on Orkney and the Shetland islands. These organic-rich sedimentary rocks form a 3–4 km thick succession with potential hydrocarbon source rocks. The characteristics of these hydrocarbon source rocks in the Orcadian Basin have been reported in several studies (e.g. Hamilton & Trewin, Reference Hamilton and Trewin1985; Marshall, Brown & Hindmarsh, Reference Marshall, Brown and Hindmarsh1985; Parnell, Reference Parnell1985). Generally, these studies confirmed that the cyclic successions of Middle Devonian organic-rich lacustrine sedimentary rocks are the principal source rocks in the Orcadian Basin (Donovan, Foster & Westoll, Reference Donovan, Foster and Westoll1974), commonly associated with oil staining, bitumen and seeps (Parnell, Reference Parnell1983).
Approximately 20% (900 m of c. 4500 m) of the flagstone succession in Caithness are organic-rich sedimentary rocks with Corg exceeding 1% (Hall & Douglas, Reference Hall, Douglas and Bjørøy1983; Duncan & Hamilton, Reference Duncan, Hamilton, Fleet, Kelts and Talbot1988). Biomarker composition indicates that these rocks might act as a major source of Beatrice oil produced from offshore Moray Firth (Duncan & Hamilton, Reference Duncan, Hamilton, Fleet, Kelts and Talbot1988; Peters et al. Reference Peters, Moldowan, Driscole and Demaison1989). Kerogen type seems to be poorly defined and variable, ranging from oil-prone to gas-prone. For instance, Marshall, Brown & Hindmarsh (Reference Marshall, Brown and Hindmarsh1985) carried out a study on samples from across the basin based on Rock-Eval pyrolysis, visual kerogen typing and spore colour, and concluded that the kerogens range from oil-prone type II to gas-prone type III with the majority of kerogens being a mixture of amorphous and woody types. In contrast, investigations of Trewin (Reference Trewin1989) on a sample set from the richest immature fish beds suggested that the organic matter is dominantly oil-prone type I kerogen and that woody organic matter is minor and negligible in the main lacustrine facies.
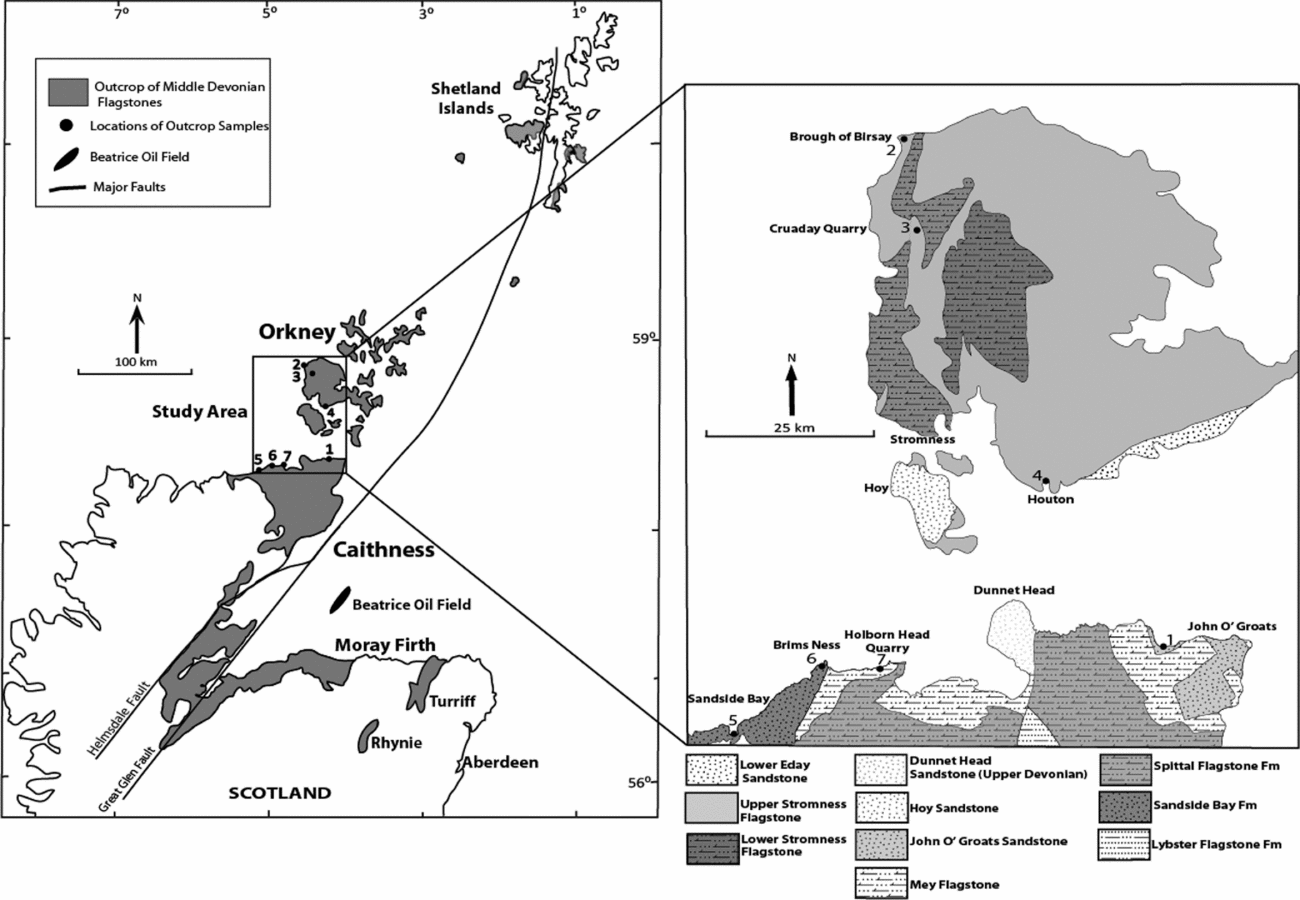
To re-evaluate these findings and put them into the context of a numerical petroleum systems model, we sampled potential source rocks at seven locations along the northern coast of Caithness and on Orkney (Fig. 1). The overall objectives of this study are (1) to investigate thermal maturity and petroleum generation potential of these source rocks; (2) to reconstruct burial and temperature history as well as petroleum generation; and (3) to use organic petrology and biomarker data for reconstruction of the depositional environment.
Map of Scotland showing the study area and the outcrop distribution of the Middle Devonian flagstones within the Orcadian Basin and sample locations (modified after British Geological Survey, 2014).
2. Geological background
During Devonian time, Scotland was part of the Old Red Sandstone Continent composed of North America, Greenland and northern Europe (Trewin & Thirlwall, Reference Trewin, Thirlwall and Trewin2002). The period of Iapetus Ocean closure predominantly formed compressional features across the continent known as the Caledonian fold belt. The Orcadian Basin developed as a series of half-grabens that provided accumulation space for Middle Devonian sediments (McClay et al. Reference McClay, Norton, Coney and Davis1986; Chauvet & Séranne, Reference Chauvet and Séranne1994). The tectonic controls on sedimentation are complex and the extension structures of the Middle Devonian sediment fill are discussed in detail by Astin (Reference Astin1985), Enfield & Coward (Reference Enfield and Coward1987) and M. A. Enfield (unpublished Ph.D. thesis, Imperial College, London, 1988). The Great Glen fault zone and Helmsdale fault are major NE-striking Caledonide structures controlling facies distribution in the western margin of the Orcadian Basin (Bluck, Reference Bluck, Ballance and Reading1980; McClay et al. Reference McClay, Norton, Coney and Davis1986; Coward & Enfield, Reference Coward, Enfield, Brooks and Glennie1987; Rogers, Marshall & Astin, Reference Rogers, Marshall and Astin1989; Clarke & Parnell, Reference Clarke and Parnell1999), where the eastward extent of the Orcadian Basin is not well defined (Downie, Reference Downie and Glennie1998). However, both fault systems were inactive during Devonian deposition (Rogers, Marshall & Astin, Reference Rogers, Marshall and Astin1989). During Eifelian time, an active extensional fault controlled the supply of alluvial fan sediments that reached Orcadian lakes, creating several depocentres extending from southern shores of the Moray Firth to Caithness, Orkney and Shetland in the north. The sedimentary system became dominated by lacustrine deposits (Marshall & Hewett, Reference Marshall, Hewett, Evans, Graham, Armour and Bathurst2003). The base of the lacustrine deposits of Middle Old Red Sandstone (ORS) in Caithness and Orkney are overlapping the lower ORS at the basin margins and directly onlapping on the Caledonian basement (Downie, Reference Downie and Glennie1998). The deposition of the lacustrine sediments occurred during Eifelian – early Givetian time, represented by the Lower Stromness Flagstone Formation (Orkney), Upper Caithness Flagstone Group (Caithness) and middle Givetian Eday Flagstone Formation (Fig. 2). These lacustrine sediments are characterized within the Orcadian Basin as a series of stratified upwards-shallowing cycles alternating from deep permanent to shallow playa lake (Marshall et al. Reference Marshall, Astin, Brown, Mark-Kurik, Lazauskiene, Becker and Kirchgasser2007). The maximum development of lacustrine sediments was accomplished during Eifelian time as represented by the extensive Achanarras/Sandwick Fish Bed horizon, a distinctive and well-known correlation horizon of deep permanent lake sediments found in all parts of the Orcadian Basin and encountered in a few offshore wells (Marshall, Brown & Hindmarsh, Reference Marshall, Brown and Hindmarsh1985; Trewin, Reference Trewin1986; Duncan & Buxton, Reference Duncan and Buxton1995; Marshall & Hewett, Reference Marshall, Hewett, Evans, Graham, Armour and Bathurst2003). The sediments of the deep permanent lake were deposited in a low-energy environment and consist of laminated organic-rich mudstone that was interpreted as result of deposition from suspension within the water column. However, siltstone–sandstone laminae indicate sporadic increased energy, possibly due to lowering of the wave base during storm conditions (Andrews & Trewin, Reference Andrews and Trewin2014). The shallow playa cycles alternate between thin-bedded laminated siltstone, very fine sandstone, carbonate-rich mudstone–siltstone and incipient mud cracks developed in a dry lake (Astin, Reference Astin1990). It is widely accepted that the cycles of lacustrine sediments were affected by climatic variation and dry–wet conditions associated with Milankovitch cyclicity within the basin (Rayner, Reference Rayner1963; Donovan, Reference Donovan1980; Hamilton & Trewin, Reference Hamilton and Trewin1985; Trewin, Reference Trewin1986; Astin, Reference Astin1990), suggesting that the lacustrine sediments within the Orcadian Basin were deposited under variable oxygenated to anoxic bottom-water conditions.
Middle Devonian flagstones succession with distinctive correlation of the Achanarras Fish Bed in Caithness and Orkney (modified after British Geological Survey, 2005; Newman & Den Blaauwen, Reference Newman and Den Blaauwen2008). Numbers indicate stratigraphic position of sample locations.

During Givetian time, sporadic fluvial and aeolian sandstone deposits enclosed the Moray Firth and extended from the NW, SE and central lake representing John O'Groats and Eday sandstones of Caithness–Orkney (Astin, Reference Astin1985). These sporadic sandstone deposits are intercalated with restricted and remnant shallow lake deposits, eventually causing the termination of the lacustrine environment (Andrews & Trewin, Reference Andrews and Trewin2014). In the upper Givetian Eday Marl Formation (Figs 2, 3), a few discrete levels show influences of episodic marine incursions in the east of the basin (Marshall, Reference Marshall1996; Marshall & Hewett, Reference Marshall, Hewett, Evans, Graham, Armour and Bathurst2003; Marshall, Brown & Astin, Reference Marshall, Brown and Astin2011).
Palaeogeographic map of Middle Devonian flagstones including study area and major tectonic faults. Thick cyclic organic-rich lacustrine successions were deposited in the centre of the lake and alluvial plain facies extended to distal parts. Modified after Séranne (Reference Séranne1992).

3. Methods
Nineteen dolomitic and calcareous siltstone samples were collected from the Middle Devonian flagstone succession. Total organic carbon (Corg) and total inorganic carbon (Cinorg) were measured using a liquiTOC II analyser measuring Corg between 350°C and 520°C and Cinorg between 520°C and 1050°C in a single analytical run without previous acidification. Released CO2 during both heating stages was analysed by a non-dispersive infra-red detector (NDIR). CaCO3 (wt%) was calculated using the formula CaCO3 = 8.333×Cinorg. If dolomite is present instead of calcite, this leads to a minor overestimation of the carbonate content. Total sulphur content (TS) was measured by a Leco S 200 sulphur analyser.
Rock-Eval pyrolysis was performed on a Rock-Eval VI instrument (Espitalié et al. Reference Espitalié, Madec, Tissot, Mennig and Leplat1977; Peters, Reference Peters1986). Parameters determined are S1, S2, S3, T max, hydrogen index (HI), oxygen index (OI) and production index (PI).
For organic petrology, samples were embedded in an epoxy resin and a section perpendicular to bedding was polished according to the procedure described in Amijaya & Littke (Reference Amijaya and Littke2006) and Sachse et al. (Reference Sachse, Littke, Jabour, Schümann and Kluth2012). The polished blocks were investigated at a magnification of 500× in incident white light and in incident light fluorescence mode, excited by ultraviolet (UV, 280–380 nm) and violet light (380–450 nm). Because the detailed maceral classification typically used for coals (Taylor et al. Reference Taylor, Teichmüller, Davis, Diessel, Littke and Robert1998) is not suited to aquatic sedimentary rocks, only four groups were differentiated: (1) vitrinites; (2) inertinites and resedimented organic particles derived from erosion of older rocks; (3) structured aquatic particles (telalginites and lamalginites); and (4) unstructured organic matter (Littke & Sachsenhofer, Reference Littke and Sachsenhofer1994). Vitrinite reflectance (VRr) measurements were performed under immersion oil using a Zeiss Axioplan incident light microscope at a wavelength of 546 nm with a Zeiss Epiplan-NEOFLUAR 50×/0.85 oil objective. An yttrium aluminium garnet (YAG) standard was used for calibration, with a reflectance of 0.889%. Vitrinite reflectance (VRr) was measured on randomly oriented particles under non-polarized light. DISKUSFossil software (Technisches Büro, Carl H. Hilgers) was used for data processing.
Palynological samples were processed following standard extraction techniques including demineralization in HCl–HF–HCl. To concentrate the miospores, the resultant residue was sieved at 10 µm. Residues very rich in amorphous organic matter (AOM) were briefly treated in an ultrasonic bath and re-sieved to remove AOM. No oxidation treatment was applied. Permanent strew mounts were produced with polyvinyl alcohol (PVA) as the mounting medium and Elvacite 2044™ epoxy resin as the embedding medium. Incident light fluorescence microscopy was performed using a UVA–blue light excitation filter (BP 350–460 nm), a chromatic beam splitter (FT 510 nm) and a barrier filter (LP 515 nm). Miospore and AOM colour were determined using the spore colour scale (SCS) (Pearson, Reference Pearson1990; Marshall & Yule, Reference Marshall, Yule, Jones and Rowe1999).
For organic-geochemical analyses, sample aliquots of 10 g were extracted with 50 mL of dichloromethane using ultrasonic treatment for 15 min. The raw extracts were fractionated by liquid chromatography into sub-fractions of: (1) aliphatic hydrocarbons (5 mL pentane); (2) aromatic hydrocarbons (5 mL pentane/DCM, 4:6); and (3) polar compounds (5 mL MeOH). Gas chromatography (GC) analysis of aliphatic hydrocarbons was performed on a Fisons Instruments GC 8000 series equipped with a flame ionization detector (FID). Helium was used as carrier gas at a velocity of 40 cm s−1. A ZB-1 HT Inferno fused silica capillary column (30 m × 0.25 mm i.d.; 0.25 µm film thickness) was used. The chromatographic conditions were as follows: split injection of 1 µL at 270°C injector temperature; the temperature programme began at 60°C with 3 min isotherm time; and temperature was then programmed to increase by 5°C/min to a final temperature of 300°C, held for 20 min.
GC-MS analyses were performed using a Finnigan MAT 95 mass spectrometer linked to a Hewlett Packard Series II 5890 gas chromatograph, which was equipped with a 30 m × 0.25 mm i.d. × 0.25 µm film thickness ZB-1 fused silica column. The spectrometer was operated in low-resolution electron impact ionization (EI+) mode with a ionization energy of 70 eV and a source temperature of 200°C, scanning from 35 to 700 Da with a scan time of 1 s/scan and an interscan time of 0.1 s. Helium was used as carrier gas with a velocity of 435 cm s−1. The oven temperature was programmed from 60°C (3 min isothermal time) to 300°C (held for 3 min) with a temperature rate of 5°C/min. The identification of compounds was based on comparison of mass spectra and gas chromatographic retention order with published data (Wang, Reference Wang1993; Weiss et al. Reference Weiss, Wilhelms, Mills, Scotchmer, Hall, Lind and Brekke2000; Peters, Walters & Moldowan, Reference Peters, Walters and Moldowan2005). Molecular ratios were calculated from integrated peak areas of specific ion chromatograms.
Bulk kinetic parameters for one sample were determined by non-isothermal open-system pyrolysis at different heating rates with a Source Rock Analyzer© (Humble Instruments & Services, Inc.) at GFZ Potsdam. Low heating rates of 0.7, 2.0 and 5.0°C/min were used to avoid heat transfer problems that might influence the product evolution curves, and consequently the geological predictions (Schenk & Dieckman, Reference Schenk and Dieckmann2004). The generated bulk petroleum formation curves served as input for the bulk kinetic model, consisting of an activation energy distribution and a single pre-exponential factor. The discrete activation energy distribution with a single frequency factor was determined using the Kinetics 2000 software. One-dimensional basin and petroleum systems modelling was performed using PetroMod 1D software (Schlumberger Version 2012). The concept of modelling burial and temperature history based on outcrop information was discussed by Welte & Yükler (Reference Welte and Yükler1981), Welte, Horsfield & Baker (Reference Welte, Horsfield and Baker1997) and Hantschel & Kauerauf (Reference Hantschel and Kauerauf2009). Measured vitrinite reflectance data was used to calibrate the 1D model.
4. Results
4.a. Elemental analysis
Corg values of Middle Devonian flagstone samples do not exceed 2.24% (Table 1). The carbonate content is variable; few samples show a CaCO3 content >50%. The total sulphur (TS) content is low, ranging from 0.03 up to 0.97 wt% with an average of 0.27 wt% (Fig. 4). The respective TS/Corg ratios range between 0.03 and 0.80. An exceptional high TS/Corg ratio (4.03) was only found for one sample with low Corg (13/391, Caithness/John O'Groats). Most sulphur is present as pyrite, well visible at incident light microscopic examination (Littke et al. Reference Littke, Klussmann, Krooß and Leythaeuser1991). Freshness of pyrite indicates that samples are not severely affected by weathering (Littke et al. Reference Littke, Klussmann, Krooß and Leythaeuser1991).
Sample list with outcrop locations, Corg, carbonate, VRr (± standard deviation) (number of measurements n in parentheses), total sulphur (TS) and Rock-Eval pyrolysis data from Middle Devonian flagstones of the Orcadian Basin; Ordnance Survey Great Britain at datum 36 (OSGB36).

Plot of total sulphur (TS) v. Corg of samples from the Orcadian Basin. The majority of the samples plot in the field for freshwater environment (modified after Berner & Raiswell, Reference Berner and Raiswell1983).

4.b. Corg–TS–Fe analysis
The ternary diagram of Corg–TS–Fe was used to illustrate the carbon–iron–sulphur relationship for four samples (13/398, 13/399, 13/402 and 13/403). These four samples are rich in iron, which is not the limiting factor for pyrite formation (Fig. 5). In Figure 5, the area below the pyrite line reflects iron-limited conditions of reduced sulphur fixation in sedimentary systems (Dean & Arthur, Reference Dean and Arthur1989). Samples plotting in this field would be expected to contain abundant organic sulphur which is clearly not the case for this sample set plotting above the pyrite line. This pattern indicates that sulphate reduction and pyrite quantity are limited by the availability of sulphate in bottom waters during deposition and pore waters during early diagenesis, as well as by primary organic matter content.
Ternary plot of carbon–iron–sulphur of selected samples revealing excess iron (modified after Lückge et al. Reference Lückge, Ercegovac, Strauss and Littke1999).

4.c. Rock-Eval pyrolysis
Rock-Eval pyrolysis results are summarized in Table 1. HI values range between 79 and 744 mg HC/g Corg (Fig. 6). The lowest values correlate with samples lean in Corg. OI values range between 34 and 292 mg CO2/g Corg and T max values between 424°C and 442°C (Fig. 6). T max values reflect thermal maturity of rocks but are also affected by variation in kerogen type (Peters, Reference Peters1986) and mineral-matrix effects (e.g. Jasper et al. Reference Jasper, Krooss, Flajs, Hartkopf-Fröder and Littke2009). T max is difficult to measure exactly if S2 peaks are small; T max should therefore be rejected if the respective S2 values are below 0.5 mg HC/g rock, which is the case for two of our samples. Production index (PI) values range between 0.02 and 0.40.
‘Cross-plot’ of T max and HI of the Orcadian Basin samples showing kerogen quality and thermal maturity (modified after Mukhopadhyay, Wade & Kruge, Reference Mukhopadhyay, Wade and Kruge1995). All samples plot in the field for immature to early mature kerogen.

4.d. Organic petrology
Vitrinite reflectance ranges between 0.42 and 0.84%, indicating immature to early mature OM. Petrographic analyses indicate the presence of predominant liptinite macerals, specifically lamalginite. Alginite occurs either in distinct individual, elongated particles (telalginite, Fig. 7a) or as even smaller lamalginite or liptodetrinite particles, the latter showing similar fluorescence as lamalginite (Fig. 7b, c). The bulk of the OM is therefore probably derived from aquatic hydrogen-rich organic matter classified as liptinite. Few particles of inertinite and vitrinite were also observed, indicating the low input of land-derived material in the Middle Devonian Orcadian Basin (Fig. 7d). Solid bitumen and abundant pyrite were also observed (Fig. 7e). Dolomite rhombohedra were identified in sample 13/400 (Fig. 7f).
Microscopic photos taken in incident fluorescence light (a–c, f, h, j, l), reflected white light mode (d, e) and transmitted white light (g, i, k). (a) Alginite, fine-grained, carbonate-rich siltstone, John O'Groats Sandstone Group, John O'Groats, sample 13/390. (b) Yellow fluorescing lamalginite, Sandside Formation, Sandside Bay, sample 13/403. (c) Unstructured organic matter with yellow fluorescing lamalginite, Mey Flagstone Formation, Holborn Head, 13/408. (d) Vitrinite and pyrite, Upper Stromness Flagstone, Cruaday quarry, sample 13/395. (e) Solid bitumen and pyrite, Upper Stromness Flagstone, Houton, sample 13/400. (f) Rhombohedral dolomite crystals, Upper Stromness Flagstone, Houton, sample 13/400. (g–l) Typical palynofacies. All unoxidized residues, >10 µm preparation. (g) Abundant amorphous organic matter and pale-coloured, badly preserved miospore. John O'Groats Sandstone, John O'Groats, sample 13/390, HI 437 mg HC/g Corg. (h) As for (g). Miospore shows strong yellow fluorescence while amorphous organic matter is dull to moderate fluorescing. (i) Large particles of amorphous organic matter. Upper Stromness Flags, Brough of Birsay, sample 13/398, HI 517 mg HC/g Corg. (j) As in (i). Amorphous organic matter with dull to moderate fluorescence. (k) Abundant and rather well-preserved miospores which show darker colour compared to miospores from AOM-rich palynofacies. John O'Groats Sandstone, John O'Groats, sample 13/391, HI 79 mg HC/g Corg. (l) As in (k). Most miospores show strong yellow fluorescence.

4.e. Palynofacies and miospore colour
As sampling concentrated on potential source rocks, most of the residues are dominated by amorphous organic matter (AOM) and yield few miospores and woody material. Only two AOM-rich samples are also rich in miospores (samples 13/395 and 13/396 from Cruaday quarry). As miospores are frequently obscured by AOM, the kerogen concentrate was treated in an ultrasonic bath and sieved again. For most samples, this resulted in richer miospore assemblages. However, the preservation of the miospores is rather bad as they are frequently degraded. AOM is largely translucent with diffuse, irregular margins and small, dark brown, discrete inclusions (Fig. 7g). Kerogen of some samples, for example from the Brough of Birsay, Houton Head and Sandside Bay, show large massive particles of AOM where the inner, thickest part is not translucent (Fig. 7i). As reprocessing of the sample resulted in the same type of AOM, we assume that these large particles are a characteristic feature of a separate palynofacies and not a sample preparation artefact (e.g. less mechanical disaggregation during kerogen isolation; gentler sieving process).
One sample (John O'Groats, 13/391) lacks abundant AOM and yielded a rich and better preserved miospore assemblage with many brown and black opaque phytoclasts (Fig. 7k). This sample has by far the lowest HI (79 mg HC/g Corg) of all studied samples and a very low Corg content (0.24%).
Acritarchs and scolecodonts were not recorded.
In the AOM-rich kerogen the miospore colour ranges from 3−4 (immature) on the SCS scale; highly degraded miospores may even have a SCS of 2 (Fig. 7g). In the AOM-poor sample from John O'Groats (13/391), miospores are clearly darker and reach 5−6 (early mature) on the SCS scale (Fig. 7k). AOM shows a more pronounced colour variation which is due to varying particle thickness (Fig. 7g, i). However, AOM colour of one sample from Holborn Head quarry (13/407) is consistently paler (mainly pale brown compared to dark brown).
Miospores show a bright yellow fluorescence (Fig. 7h, l). AOM fluorescence is dull and patchy to moderate and the intensity is much lower compared to miospores (Fig. 7h, j). Some fragments not discernible in transmitted white light are incorporated in the AOM (Fig. 7h). They show the same strong fluorescence as the miospores, so are probably highly degraded small fragments of miospores.
4.f. Molecular organic geochemistry
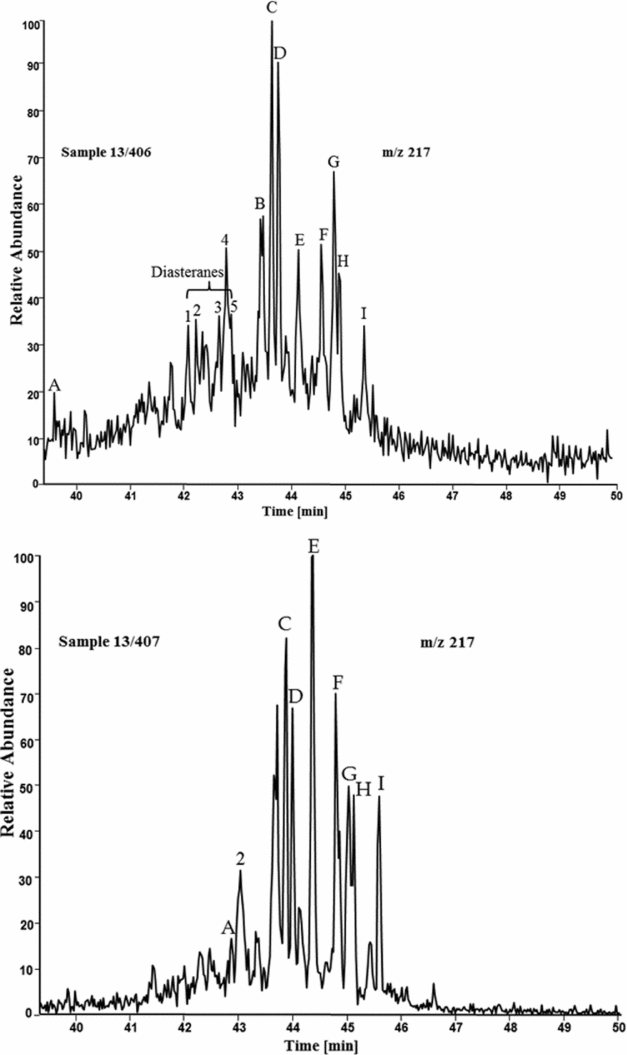
Biomarker ratios were used to characterize the depositional environment and the maturation range of the studied rocks. Molecular organic geochemistry focused on the distribution of n- and iso-alkanes as well as tricyclic terpanes (cf. Peters & Moldowan, Reference Peters and Moldowan1991), with special emphasis on evaluation of peak area ratios measured from the m/z (mass/charge number of ions) 191 trace (Table 2). Only a few samples have abundant steranes (m/z 217 and 218; Table 3). Diasterane biomarkers measured using m/z 259 were identified in only a few samples (13/405, 13/406 and 13/407), but at low concentrations. Polyaromatic hydrocarbons were studied with the aim to measure concentration ratios of dibenzothiophenes (m/z 184) and methylphenanthrenes (m/z 178). All identified biomarker ratios were calculated based on evaluation of peak areas and are summarized in Table 3.
Identified terpanes, hopanes (m/z191) and steranes (m/z 217) for Middle Devonian flagstones.

Biomarker parameters calculated for Middle Devonian flagstones. See text for discussion.

4.f.1. n- and iso-alkanes
The samples show a clear dominance of short to medium range (nC15–nC19) over long-chain n-alkanes (nC27–nC31; Fig. 8). The carbon preference index (CPI15–23) based on Bray & Evans (Reference Bray and Evans1961) shows a narrow range of values (1.0–1.57) with an average of 1.12. The OEP values based on Scalan & Smith (Reference Scalan and Smith1970; Table 3) also plot in a narrow range. Light hydrocarbon preference index (LHCPI) was calculated and the values range over 4.2–37.0 with an average of 13.9, clearly showing the predominance of short- over long-chain n-alkanes. Pristane/phytane (Pr/Ph) ratios vary between 1.24 and 1.95 (average 1.65). In most samples there is a clear dominance of nC17 and nC18 over pristane and phytane, respectively (Figs 8, 9).
Distributions of n-and iso-alkanes (Pr – pristane; Ph – phytane) in selected samples from the Orcadian Basin, showing the dominance of short- to medium-chain n-alkanes and also presence of γ- and β-carotane as indication of lacustrine origin.

Plot of Pr/nC17 v. Ph/nC18 for Middle Devonian samples from the Orcadian Basin. The plot suggests that deposition took place under oxygen-deficient bottom-water conditions (modified after Shanmugam, Reference Shanmugam1985).

4.f.2. Hopanes and steranes
Distribution patterns of hopanes and steranes are shown in Figures 10 and 11 (see also Table 2). The norhopane (C29)/hopane (C30) ratio (Peters, Walters & Moldowan, Reference Peters, Walters and Moldowan2005) is <1 in all samples. The homohopane C31 is found in almost all samples, with the exception of one sample which shows a low concentration close to detection limit (13/406). The C31 22R homohopane/C30 hopane ratio (Peters, Walters & Moldowan, Reference Peters, Walters and Moldowan2005) is low for most of the analysed samples. C31 homohopane 22S/(22S+22R) isomerization ratios (Peters, Walters & Moldowan, Reference Peters, Walters and Moldowan2005; S: stereochemical description; R: rectus) vary over the range 0.34–0.59 (Table 3). In addition, Ts (18α-22,29,30-trisnorneohopane) and Tm (17α-22,29,30-trisnorhopane) were measured as thermal maturity parameters ranging over 0.37–0.82 (Ts/(Ts+Tm); Table 3). The sterane ratios based on 20S/(20S+20R) ratio vary over the range 0.40–0.64 (Table 3).
m/z 191 mass fragmentograms showing the distributions of hopanes in the Orcadian Basin samples. The presence of gammacerane (GAM) was detected in samples 13/390 and 13/405 and C24 tetracyclic terpane was detected in samples 13/403, 13/405 and 13/407. For peak identification see Table 2.

m/z 217 mass fragmentograms illustrating the presence of diasteranes (in peaks labelled 1–5) and steranes. For peak identification see Table 2.
4.f.3. C24 tetracyclic terpane
C24 tetracylic terpane has been identified in a few samples (13/403, 13/405 and 13/407; Table 3) which are all characterized by high HI values (>700). Abundant C24 tetracyclic terpane is regarded as an indicator for a carbonate-evaporitic depositional environment (Palacas, Anders & King, Reference Palacas, Anders, King and Palacas1984; Connan et al. Reference Connan, Bouroullec, Dessort and Albrecht1986; Connan & Dessort, Reference Connan and Dessort1987; Clark & Philp, Reference Clark and Philp1989); other interpretations indicated marine or terrestrial origin (Philp & Gilbert, Reference Philp and Gilbert1986).
4.f.4. DBT/PHEN
Dibenzothiophene (DBT) and phenanthrene (PHEN) are aromatic biomarkers used to infer a source-rock depositional environment and lithology (e.g. Budzinski et al. Reference Budzinski, Garrigues, Connan, Devillers, Domine, Radke and Oudin1995; Hughes, Holba & Dzou, Reference Hughes, Holba and Dzou1995; Peters, Walters & Moldowan, Reference Peters, Walters and Moldowan2005; Zhang & Huang, Reference Zhang and Huang2005). The Orcadian source rocks have dibenzothiophene/phenanthrene ratios in the range of 0.08–0.81 (Table 3); further, the dibenzothiophene/phenanthrene ratio was plotted against the pristane/phytane ratio, and the values indicate that the Middle Devonian flagstones are typical lacustrine/marine shaly source rocks (Fig. 12).
‘Cross-plot’ of DBT/PHEN and Pr/Ph ratio (modified after Hughes, Holba & Dzou, Reference Hughes, Holba and Dzou1995).

4.f.5. β-carotane
The β-carotane is a highly specific biomarker commonly used to identify lacustrine deposits. It was measured using m/z 558 and m/z 125 fragments (Jiang & Fowler, Reference Jiang and Fowler1986; Koopmans, de Leeuw & Sinninghe Damasté, Reference Koopmans, de Leeuw and Sinninghe Damsté1997; Peters, Walters & Moldowan, Reference Peters, Walters and Moldowan2005). Small concentrations of β-carotane were identified in two samples (13/397 and 13/402; Fig. 8).
4.f.6. Gammacerane
Gammacerane is regarded as a specific biomarker to characterize water column stratification due to hypersalinity (Hall & Douglas, Reference Hall, Douglas and Bjørøy1983; Jiang & Fowler, Reference Jiang and Fowler1986; Sinninghe Damsté et al. Reference Sinninghe Damsté, Kenig, Koopmans, Köster, Schouten, Hayes and de Leeuw1995). It occurs in some of our Middle Devonian flagstones (13/390 and 13/405; Fig. 10) with a gammacerane index of 1.79 and 0.79 (gammacerane/C31 22R hopane).
4.g. Bulk kinetics
Kerogen in the sample set can be classified as immature to early mature type I or type I–II. Biomarker data (Table 3) confirm the low maturity and petrographic data support the predominance of algal/phytoplankton-derived organic material over terrestrial organic material. One sample (13/403) was selected to determine petroleum generation kinetics. This sample is characterized by abundant liptinite (Fig. 7b) and a hydrogen index value of about 700 mg HC/g Corg. Bulk kinetic parameters for the sample were determined by non-isothermal open system pyrolysis at three different heating rates (0.7, 2.0, 5.0°C/min). The pyrolysis product generation rate curves were used to calculate the kinetic parameters activation energy and frequency factor (Fig. 13). Dominant activation energy at 55 kcal/mol describes c. 90% of the total kerogen to petroleum conversion reaction, which indicates the presence of a quite uniform type of organic matter. This is consistent with microscopical observations and typical of kerogen in lacustrine type I source rocks (Fig. 13a; Burnham et al. Reference Burnham, Braun, Gregg and Samoun1987; Espitalié et al. Reference Espitalié, Ungerer, Irwin and Marquis1988; Wei, Bjørøy & Roaldset, Reference Wei, Bjørøy and Roaldset1994; Moretti & Deacon, Reference Moretti and Deacon1995; Reynolds & Burnham, Reference Reynolds and Burnham1995; Dessort et al. Reference Dessort, Connan, Derenne and Largeau1997). Transformation ratios (temperature and timing of petroleum generation) were calculated for a geological heating rate of 3.3°C Ma–1 (Fig. 13b) to define onset and end of primary petroleum generation. This heating rate roughly corresponds to an average geological heating rate in sedimentary basins (Schenk, Di Primio & Horsfield, Reference Schenk, Di Primio and Horsfield1997). Accordingly, most petroleum would be generated between 140 (c. 0.1 transformation ratio or TR) and 160°C (0.9 TR) with a maximum generation rate at c. 150°C (0.5 TR).
(a) Activation energy distribution (kcal/mol) and frequency factor (2.39 s−1) of a source-rock sample from the Orcadian Basin. (b) Calculated predictions of kerogen transformation ratio (black line) v. temperature for a geological heating rate (3.3°C Ma–1) and calculated vitrinite reflectance (grey line). The onset of oil generation is at c. 120°C.

5. Discussion
5.a. Depositional environment
Organic petrology reveals the presence of distinct algal/phytoplankton remains as the main contributors to the organic matter. A clear lamination indicating seasonal blooms and no evidence of bioturbation was observed. The scarcity of any land plant particles such as vitrinite or sporinite (except for samples 13/391, 13/395 and 13/396, which have numerous miospores) further supports the limited supply of terrestrial organic material into this aquatic environment. The low miospore recovery may indicate a more distal lacustrine environment where well-preserved and diverse miospore assemblages are rare or lacking (e.g. Marshall, Reference Marshall1996). Pyrite is common (Fig. 7d, e), but not very abundant. This observation corresponds with the low sulphur content and moderate to low TS/Corg ratios (Table 1; Fig. 5). Low TS/Corg ratios (below those of typical marine sediments) indicate lacustrine rather than marine depositional environments, because freshwater is commonly depleted in sulphate as compared to marine water. Pyrite is fresh in all samples, indicating that samples are not severely affected by weathering (Littke et al. Reference Littke, Klussmann, Krooß and Leythaeuser1991). The presence of dolomite in a few Middle Devonian flagstone samples (13/400, 13/401 and 13/406) points to concentrated water columns in alkaline, shallow lakes or playa-lake environments, but excludes a high contribution of fresh water (Fuhrmann et al. Reference Fuhrmann, Horsfield, Lòpez, Hu and Zhang2004). In addition, a diagenetic origin should not be excluded.
The dominance of n-alkanes of medium chain length (nC15–nC20) suggests a signature of aquatic organic matter derived from algal and phytoplankton input (Cranwell, Reference Cranwell1977; Fig. 8). LHCPI values clearly support the conclusion that aquatic organic matter dominated over terrestrial organic matter. According to Pr/nC17 and Ph/nC18 ratios, deposition took place in an oxygen-depleted, but not completely anoxic depositional environment (Fig. 9). This fact is also indicated by Pr/Ph ratios varying between 1.2 and 1.9 (Table 3), whereas completely anoxic environments are often characterized by Pr/Ph values lower than 1.0. The occurrence of carotane is regarded as an indication of a lacustrine environment (Fig. 8; Shanmugam, Reference Shanmugam1985).
The relative amount of each of the regular steranes depends on the type of organic matter contributing to the sediment. The relative distribution of C27, C28 and C29 steranes is shown in a ternary diagram (Huang & Meinschein, Reference Huang and Meinschein1978; Reference Huang and Meinschein1979; Fig. 14), with a clear dominance of C28 and C29 steranes. Samples plot within the deltaic-terrigenous field, far from the ‘marine’ fields within the diagram. This result basically agrees with that from the cross-plot of DBT/PHEN, also suggesting a terrestrial (lacustrine) environment. The results show a depletion of C27 steranes as also reported by Duncan & Hamilton (Reference Duncan, Hamilton, Fleet, Kelts and Talbot1988) and Hall & Douglas (Reference Hall, Douglas and Bjørøy1983) for the Orcadian Basin. The high abundance of C28 steranes is clearly common in Old Red Sandstone Group samples, but cannot be explained by the significant input of terrestrial higher land plants here. Instead, these C28–C29 steranes are possibly associated with cyanobacterial and archaebacterial lipid input. Similar conclusions were drawn in previous studies on the Orcadian Basin (e.g. Duncan & Hamilton, Reference Duncan, Hamilton, Fleet, Kelts and Talbot1988) and some other basins (Aquino Neto et al. Reference Aquino Neto, Trendel, Restle, Connan, Albrecht and Bjørøy1983; Palacas, Anders & King, Reference Palacas, Anders, King and Palacas1984).
Ternary diagram of relative abundance of regular steranes C27, C28 and C29, indicating that the analysed samples from Orcadian Basin are derived from a non-marine source (modified after Huang & Meinschein, Reference Huang and Meinschein1979).

The ratio of dibenzothiophene over phenanthrene (DBT/PHEN) and the ratio of pristane over phytane (Pr/Ph) are additional markers used to identify the source-rock palaeodepositional environment (Fig. 12). The cross-plot of the DBT/PHEN and Pr/Ph ratios indicates that the organic matter was derived from a depositional environment which was not depleted in iron; higher DBT/PHEN ratios would be expected otherwise.
β-carotane is a highly specific biomarker associated with anoxic, saline lacustrine deposition (Peters et al. Reference Peters, Moldowan, Driscole and Demaison1989). Small concentrations of β-carotane have been identified in a few samples (13/397 and 13/402; Fig. 8). Its occurrence was also reported from other lacustrine sedimentary rocks including the Middle Devonian flagstones of the Orcadian Basin by Hall & Douglas (Reference Hall, Douglas and Bjørøy1983), Jiang & Fowler (Reference Jiang and Fowler1986) and Duncan & Hamilton (Reference Duncan, Hamilton, Fleet, Kelts and Talbot1988). Furthermore, β-carotane as biomarker for oil-source-rock correlation was used to provide evidence that the Devonian flagstone succession has largely contributed to the hydrocarbon accumulation of the Beatrice field (Peters et al. Reference Peters, Moldowan, Driscole and Demaison1989).
Gammacerane is a highly specific biomarker for stratified water column, often associated with hypersalinity (Hall & Douglas, Reference Hall, Douglas and Bjørøy1983; Moldowan, Seifert & Gallegos, Reference Moldowan, Seifert and Gallegos1985; Jiang & Fowler, Reference Jiang and Fowler1986; Sinninghe Damsté et al. Reference Sinninghe Damsté, Kenig, Koopmans, Köster, Schouten, Hayes and de Leeuw1995; Killops & Killops, Reference Killops and Killops2005, p. 205), and was detected in a few samples in this study (13/390 and 13/405; Fig. 10). Stratified Orcadian lake conditions were suggested in several studies by Donovan (Reference Donovan1975), Duncan & Hamilton (Reference Duncan, Hamilton, Fleet, Kelts and Talbot1988), Parnell (Reference Parnell, Fleet, Kelts and Talbot1988), Janaway & Parnell (Reference Janaway and Parnell1989) and Irwin & Meyer (Reference Irwin and Meyer1990). The stratified lake model (Rayner, Reference Rayner1963; Donovan, Reference Donovan1975, Reference Donovan1980; Mykura, Reference Mykura1976) suggests that a well-preserved articulated fish fauna and delicate microlamination of sediments indicate accumulation below the wave base. Under hypersaline conditions the propagation of downwards wave energy through a water column is diminished by hypersalinity density stratification (Beadle, Reference Beadle1981; Serruya & Pollingher, Reference Serruya and Pollingher1983). The detection of the specific biomarker gammacerane in some samples (13/390 and 13/405; Fig. 10) confirms the stratification model and hypersaline conditions of the Orcadian lake. In addition, the abundance of tetracyclic terpane (C24 Tet) that is recognized as a biomarker indicator for a carbonate-evaporitic depositional environment has been identified in the Middle Devonian flagstone samples (13/403, 13/405 and 13/407). Sample 13/405 contained both abundant gammacerane and tetracyclic terpane (C24 Tet), implying that the Orcadian lake stratification coincides with shallow carbonate-evaporitic depositional environments.
In summary, the Orcadian Basin sedimentary rocks were probably deposited under bottom waters that were not completely anoxic but strongly depleted in molecular oxygen; sulphate levels within the water column were elevated compared to normal freshwater, but probably lower than in present-day seawater (Fig. 5; Berner & Raiswell, Reference Berner and Raiswell1983; Berner, Reference Berner1984). Consequently, reduced sulphur uptake into the sediments occurred only in the freshly deposited sediment, probably at a few decimetres to metres below the sediment–water interface (Lückge et al. Reference Lückge, Ercegovac, Strauss and Littke1999). The four analysed samples of the Orcadian Basin reflect iron-rich conditions where sulphur and reactive organic matter limit pyrite content (Fig. 5). Duncan & Hamilton (Reference Duncan, Hamilton, Fleet, Kelts and Talbot1988) suggested that the low organic carbon content with values less than 5.0% is possibly due to limited allochthonous organic input, related to poorly diversified Devonian land flora or a high rate of bacterial degradation of organic material. Bacterial degradation was not significant, as suggested by low hopane/sterane ratios which range over 0.05–0.58. Our data support the view that, except in samples 13/391 (John O'Groats), 13/395 and 13/396 (Cruaday quarry), even in mud- and siltstones land plant supply (e.g. miospores) was low. It is now well documented that the first forests appeared during Middle Devonian time; plant remains testify to a well-developed vegetation. However, the reproduction strategy of these plants was dependent on moisture, so a higher input of miospores may imply wetland conditions near the lake margin during time of high rainfall (Marshall, Reference Marshall1996; Marshall & Hewett, Reference Marshall, Hewett, Evans, Graham, Armour and Bathurst2003). The reason for the low content of terrigenous organic matter might therefore be due to drier climate intervals when wetlands were lacking and the amount of available plant biomass in the catchment area of the lake was low. As well as differences in the availability of plant detritus, taphonomic effects may control the input of miospores. As a general rule, phytoclast particle size becomes finer with increasing distance from the original source (e.g. Tyson, Reference Tyson1995, p. 231). Especially large miospores will be deposited in proximal settings, while miospores will be rare in distal sedimentation and the high amount of amorphous organic matter will conceal the few smaller miospores which reached the distal parts of the lake (Stephenson et al. Reference Stephenson, Leng, Michie and Vane2006). The palynofacies of the miospore-rich but AOM-poor sample 13/391 from John O'Groats therefore indicates a rather proximal, low-depositional-energy setting. By contrast, the miospore-poor but AOM-rich palynofacies reflects a distal and probably deeper lake facies where AOM is not oxidized and terrestrial contribution to the total kerogen is negligible.
The presence of hopanes reflects the contribution of prokaryotic membranes in bacteria and blue-green algae (Tissot & Welte, Reference Tissot and Welte1984; Moldowan, Seifert & Gallegos, Reference Moldowan, Seifert and Gallegos1985). Hopane concentrations in the range of C31 to C33 are very low, indicating that the deposition did not take place under marine shelf conditions. The homohopanes >C31 are present in extremely low concentration, suggesting that anoxic conditions did not occur during deposition but suboxic to dysoxic bottom water may have existed (Peters & Moldowan, Reference Peters and Moldowan1991; Tyson & Pearson, Reference Tyson, Pearson, Tyson and Pearson1991). The occurrence of diahopane C30 suggests contributions of bacteria to sediments containing clay under oxic or suboxic conditions. This biomarker can also reflect terrigenous sources of organic matter (Volkmann et al. Reference Volkman, Alexander, Kagi and Woodhouse1983; Philp & Gilbert, Reference Philp and Gilbert1986). However, as pointed out in Sections 4.d and 4.e, terrigenous organic matter is rare in most samples. Diahopane was observed in almost all analysed samples (DH30 in Fig. 10). High concentrations of C29 norhopane, as a result of preferential preservation in the presence of sulphur, are frequently observed in sediments with limited iron availability such as carbonates (Blanc & Connan, Reference Blanc and Connan1992).
Finally, almost all of the investigated samples revealed Pr/Ph ratio >1, which may indicate deposition in fluctuating oxic/anoxic bottom waters (Didyk et al. Reference Didyk, Simoneit, Brassell and Eglinton1978).
5.b. Type of organic matter
Lamalginite is the predominant organic matter type in the Middle Devonian flagstones in the Orcadian Basin (Fig. 7a–c). Petrographic observation indicates strong correlation between the highest Corg percentages with abundance of lamalginite, which is generally characterized by bright yellow to orange fluorescence (Fig. 7a–c; Table 1). The fluorescence of amorphous organic matter which is volumetrically dominant in most palynological kerogen preparations is dull to moderate and clearly less than the miospore fluorescence. Hence, the kerogen would be classified as 3–4 on the preservation scale of Tyson (Reference Tyson1995, p. 347), indicating oil-prone material. Microscopic observations confirm the low abundance of vitrinite macerals, that is, very low terrestrial contribution to the organic matter. Evidence for the presence of higher land plants are the miospores and the relatively high abundance of tricyclic terpanes in the range of C20–C28 (Tissot & Welte, Reference Tissot and Welte1984) whereas, on the other hand, long-chain n-alkanes are extremely scarce in comparison with short- to medium-chain n-alkanes. Solid bitumen was observed in some of the samples in great quantities (Fig. 7e), as also reported in several fracture zones within the Sandwick bed in Orkney (Parnell, Reference Parnell1985).
5.c. Petroleum potential and maturity
Source-rock generation potential essentially depends on Corg content and organic matter quality, which is a function of kerogen type and thermal maturation. Variations of Corg in samples of the Middle Devonian flagstones may be attributed to facies changes which are common in lacustrine environments (Kelts, Reference Kelts, Fleet, Kelts and Talbot1988). The modified van Krevelen diagram indicates variation in HI values suggesting heterogeneity in kerogen type (Fig. 6). The variations even for pure liptinitic kerogen are difficult to correlate with results from organic petrography due to thermal degradation of lamalginite precursors leading to a trend of increasing OI and decreasing HI values (Horsfield et al. Reference Horsfield, Curry, Bohacs, Littke, Rullkötter, Schenk, Radke, Schaefer, Carroll, Isaksen and Witte1994). HI values >300 mg HC/g Corg for the majority of the samples reflect type I or II kerogen (Fig. 6a; Table 1). High OI and low HI values in some of the samples seem to be more due to microbial degradation of initially hydrogen-rich, algal/phytoplankton-derived kerogen than the contribution of terrigenous organic matter. Nevertheless, it should be noted that algal/microbial (cyanobacteria) mats in lacustrine, alkaline environments can also have relatively low HI and high OI values at immature stages due to the poor preservation of lacustrine OM (Horsfield et al. Reference Horsfield, Curry, Bohacs, Littke, Rullkötter, Schenk, Radke, Schaefer, Carroll, Isaksen and Witte1994; Fuhrmann et al. Reference Fuhrmann, Horsfield, Lòpez, Hu and Zhang2004).
The maturity indicators, T max, VRr and SCS, show an overall immature or early mature range for the Middle Devonian flagstones of the Orcadian Basin. The darker miospore colour in sample 13/391 is probably not due to higher thermal maturation but to kerogen composition. Miospores from kerogen rich in amorphous organic matter often show paler colours than from kerogen dominated by woody material as reported from Orcadian Basin source rocks by, for example, Marshall, Brown & Hindmarsh (Reference Marshall, Brown and Hindmarsh1985) and Hillier & Marshall (Reference Hillier and Marshall1992). In addition, Marshall (Reference Marshall1998) clearly pointed out that vitrinite reflectance values from AOM-rich facies are suppressed compared to those from phytoclast-dominated kerogen. CPI and OEP values support this thermal maturity level ranging between immature to early mature, as well as Pr/nC17 and Ph/nC18 ratios (Fig. 9). Hopane isomerization ratio (22S/(22S+22R)) is probably the most widely used biomarker maturity parameter and records the relative enrichment of the more thermally stable 22S isomer. The hopane isomerization ratio ranges between 0.34 and 0.59, indicating early mature conditions for most of the Middle Devonian flagstone samples (Table 3). The Ts/Tm ratio is commonly used for maturity assessment despite its source facies dependence (Seifert & Moldowan, Reference Seifert and Moldowan1978; Rullkötter & Marzi, Reference Rullkötter and Marzi1988). During catagenesis Tm is less stable than Ts; the increasing ratio of Ts/Tm with increasing maturity is therefore controlled by earlier and more rapid thermal degradation of Tm.
Interpretation of kinetic data suggests petroleum generation starting at c. 140°C, if typical geological heating rates are assumed. Due to the immature nature of the OM in the measured sample, it is highly likely that only some minor hydrocarbon generation potential has already been realized.
In summary, the investigated Middle Devonian flagstones have only just reached the oil window and much of the petroleum generation potential is still preserved. In areas of greater burial depths, especially in areas where more recent (Cenozoic and Cretaceous) burial led to high temperatures, these source rocks will have contributed to active petroleum systems.
6. Burial, thermal and maturation history
In order to reconstruct the burial, thermal and maturation history in the on- and offshore area of the Orcadian Basin, 1D modelling was carried out for two selected locations. Assigned heat flow values are compiled in Figure 15 and burial histories for the onshore and offshore areas are shown in Figures 16 and 17, respectively. The models are consistent with the geological history described by, for example, Barker & Pawlewicz (Reference Barker, Pawlewicz, Buntebarth and Stegena1986), Trewin (Reference Trewin1989), Marshall (Reference Marshall1998), Parnell, Carey & Monson, (Reference Parnell, Carey and Monson1998), Thomson et al. (Reference Thomson, Underhill, Green, Bray and Gibson1999) and Baron et al. (Reference Baron, Parnell, Mark, Carr, Przyjalgowski and Feely2008). Measured vitrinite reflectance values (see Table 1) represent maximum temperatures achieved during burial, and were used for the calibration of the onshore model (Fig. 18). Taking into account the geological history of the Orcadian Basin and especially times of rifting, the heat flow values assigned to the 1D models range over 50–62 mW m–2 (Fig. 15; scenario 1). Downie (Reference Downie and Glennie1998) described an elevated heat flow of ≥120 mW m–2 for the Devonian–Carboniferous period, with the exact timing varying from area to area. Marshall, Brown & Hindmarsh (Reference Marshall, Brown and Hindmarsh1985), Marshall (Reference Marshall1998) and Hillier & Marshall (Reference Hillier and Marshall1992) published Devonian sediment palaeotemperatures ranging from 100 to 300–400°C for the Orcadian Basin, and Duncan & Buxton (Reference Duncan and Buxton1995) published Devonian strata temperature values of 180–200°C for the East Shetland Platform. The hypothesis of an elevated HF was tested in a second model (scenario 2). The heating was probably the result of contact metamorphism due to the emplacement of igneous intrusions. Cooling for the area of Caithness and Orkney was modelled taking into account apatite fission track data, revealing that temperatures lower than 110°C were reached over most of the region during 300–250 Ma (Downie, Reference Downie and Glennie1998). It should be noted that the low maturity values of the samples studied here do not suggest temperatures higher than 120−130°C; such high temperatures therefore seem to be restricted to localized rift zones or magmatic intrusions.
Heat flow trend applied for the onshore and offshore area representing heat flow through time for scenario 1 and scenario 2.

(a) Geological base map showing the location of the onshore model and distribution of the Middle Devonian flagstone outcrop. (b) 1D onshore model showing the evolution of burial history of the studied area through geological time. (c) Vitrinite reflectance depth trend showing a good calibration with measured values.

(a) Geological base map showing the location of the offshore model and distribution of the Middle Devonian flagstone outcrop. (b) 1D offshore model showing the evolution of burial history of the studied area through geological time.

Vitrinite reflectance depth trend showing the calibration curves for the sensitivity analysis.

During Early Cretaceous time (Valanginian), the heat flow possibly increased due to the effects of thermal stretching of the crust and corresponding inhomogeneity in deep crustal structure leading to graben formation (Evans et al. Reference Evans, Graham, Armour and Bathurst2003). Nevertheless, we decided to keep the post-Devonian heat flow history quite simple and the values in the range of typical values for continental crust (Fig. 15; see Allen & Allen, Reference Allen and Allen2005).
6.a. Onshore burial and temperature history
The onshore burial history shows a rapid burial of the Middle Devonian flagstones succession due to active extension of the Orcadian Basin (Fig. 16). During Middle Devonian time the burial depth of Middle Devonian flagstones reached c. 500 m, coupled with a temperature of 68°C. The Old Red Group was deposited during Devonian and earliest Mississippian time (Marshall & Hewett, Reference Marshall, Hewett, Evans, Graham, Armour and Bathurst2003) and was exposed to minor uplift and erosion. Deposition of Carboniferous sediments led to a burial depth of the Middle Old Red Group, which includes the investigated succession, of c. 1700 m in middle Carboniferous strata, corresponding to a palaeotemperature of c. 97°C. In our model, the palaeothickness of the Carboniferous was assigned with 1300 m (scenario 1). Even higher erosional thickness values (up to 2–3 km) can be assumed for other locations in the onshore Orcadian Basin (Thomson et al. Reference Thomson, Underhill, Green, Bray and Gibson1999).
During Permian – Late Jurassic time the Middle Old Red Group was constantly buried; changes in thermal maturity were minor (Fig. 16) because maximum temperatures were not reached. For example, rifting was active during Late Jurassic time, causing rapid subsidence and enhanced transgression of syn-rift deposits (Evans et al. Reference Evans, Graham, Armour and Bathurst2003). Also the Early to Late Cretaceous basin evolution is related to regional thermal subsidence due to Late Jurassic rifting (Evans et al. Reference Evans, Graham, Armour and Bathurst2003). During Palaeogene–Neogene time, the area was further uplifted and the Upper Old Red Group and parts of the Middle Old Red Group crop out today. As the temperature and therefore the maturity are highly dependent on the burial, the vitrinite reflectance trend for the Middle Devonian flagstones shows increased maturation (0.50% VRr) during Devonian–Carboniferous time. Highest maturation was reached at the end of Carboniferous Period (0.61% VRr; Fig. 16), remaining constant during the Mesozoic and Cenozoic eras.
In order to consider the postulated high Palaeozoic heat flow of 120 mW m–2 (Downie, Reference Downie and Glennie1998), a second model was constructed assuming 1300 m of Carboniferous thickness and the elevated heat flow. Burial history shows the same development as shown for scenario 1, but Late Palaeozoic temperature and therefore maturity are enhanced. Maximum temperatures of 121°C were achieved for the Middle Old Red Group in the Carboniferous, corresponding to VRr values of 0.7%.
However, this temperature regime is too high for the recorded vitrinite reflectance values, and a match of measured and calculated vitrinite reflectance data is not achieved (Fig. 18). Sensitivity analysis revealed a good calibration match if assuming an eroded thickness of 500 m only and a heat flow of 120 mW m–2. In this scenario, maximum temperatures of 97°C coupled to a maturity value of 0.6%VRr would be achieved (scenario 1; Fig. 19a).
Temperature development and transformation ratio (TR, %) of hydrocarbons over time for the (a) onshore and (b) offshore area. Both figures show the development for scenario 1 and scenario 2.

6.b. Offshore burial and temperature history
The Middle Old Red Group in the offshore area shows a similar pattern of rapid burial during Devonian–Carboniferous time followed by strong uplift (Fig. 17). An additional palaeo-thickness of 2 km was assigned to our offshore model following the apatite fission track analysis and vitrinite reflectance data based on calculations by Green, Duddy & Bray (Reference Green, Duddy, Bray, Buchanan and Buchanan1995) for a well in the Inner Moray Firth. However, in contrast to the onshore area, deep burial occurred during Cretaceous Period, leading to a maximum depth of 3600 m for the Middle Old Red Group during Late Cretaceous time (temperature c. 127°C). Widespread uplift led to a present-day depth of 3170 m for the Middle Devonian sedimentary rocks (c. 97°C). Corresponding to the burial and temperature history of the offshore area, an increase in vitrinite reflectance occurred during Devonian–Carboniferous time due to the deep burial. During the Permian and Triassic periods, the maturity remained constant and increased significantly during Late Jurassic time to 0.82% VRr and further during the Cretaceous and Palaeogene periods (0.96% VRr).
A second scenario was developed considering the assumed elevated heat flow during the Devonian and Carboniferous periods. A palaeo-thickness of 2 km was assumed, coupled to 120 mW m–2 during this time. This would lead to significant petroleum generation at temperatures exceeding 120°C, further increasing during the Jurassic and Cretaceous phase of deep burial (Fig. 19b).
6.c. Petroleum potential
The assignment of the measured kinetic to the onshore model, scenario 1, did not reveal any petroleum generation as sufficient temperatures (>100°C) were never reached. Considering elevated heat flow values for the second scenario revealed only a significant early petroleum generation potential during Carboniferous time (≥50%), assuming a burial depth of 2 km for the flagstones and a heat flow of 120 mW m–2. Maximum temperatures of 158°C for the flagstones were achieved using this scenario (Fig. 19a).
For the selected offshore location some hydrocarbon generation was calculated. For scenario 1 temperatures and therefore maturities increased significantly during Late Jurassic – Early Cretaceous time, reaching c. 127°C (0.82% VRr). Petroleum generation started at c. 140 Ma, increased during Cretaceous time and approached final TR values of c. 30% at present day (Fig. 19b). Assignment of published kerogen type II (marine) kinetic (Tegelaar & Noble, Reference Tegelaar and Noble1994) shows the facies and kerogen type (marine vs. lacustrine) based differences on output concerning the hydrocarbon generation. For the onshore area, transformation starts in the Carboniferous, but remains on a low level (0.25% TR). Calculating with Tegelaar & Noble (Reference Tegelaar and Noble1994) for the offshore area, even 57% TR is reached at present day (Fig. 19b).
The second scenario (high Carboniferous heat flow; 120 mW m–2) reveals for the offshore area an early (Carboniferous) petroleum generation if a palaeo-thickness of at least 2 km is assumed. At lower heat flows of 80 mW m–2, minimum values for a significant (TR > 20%) Carboniferous petroleum generation are a burial depth of 2.5 km. Applying the measured kinetic data instead of the standard data by Tegelaar & Noble (Reference Tegelaar and Noble1994) leads to lower petroleum generation, that is, only a TR of 10% as compared to 20% for values of 2.5 km palaeo-overburden and a HF of 80 mW m–2.
In summary, these models clearly indicate different petroleum generation dynamics, that is, different times of petroleum generation occurring in the on- and offshore area, depending on the time of deepest burial. Based on this consideration, it is questionable if the potential source rocks in the onshore area would be part of a complete petroleum system, or if the source rocks generated and expelled any petroleum before trap and reservoir formation there. However, in the offshore area any organic-rich Devonian sedimentary rocks should be considered as important petroleum source rocks, being possibly one of the contributors to the reservoirs of the Beatrice oil field (Marshall & Hewett, Reference Marshall, Hewett, Evans, Graham, Armour and Bathurst2003). In the onshore area, the contribution of flagstones to the petroleum system seems to depend on the temperature field, and may be partially enhanced due to magmatic intrusions (Marshall & Hewett, Reference Marshall, Hewett, Evans, Graham, Armour and Bathurst2003). As described by Downie (Reference Downie and Glennie1998), local intrusions are too small for increased heat flow everywhere in the Orcadian Basin. Scenario 1 with a moderate heat flow is therefore regarded as the probable background heat flow situation which also fits to all samples that we collected in the Orcadian Basin. In contrast, scenario 2 represents the special situation occurring in ‘hot’ areas, where high heat flows existed locally during the Carboniferous.
7. Conclusions
The Middle Devonian flagstones of the Orcadian Basin represent extremely well-preserved organic-rich deposits due to their low level of thermal maturation. They are accordingly well suited to study depositional conditions and organic matter input in ancient times using biomarker and other organic geochemical data. Clearly, the contribution of terrestrial organic matter is minor as revealed by low vitrinite percentages as well as low concentrations of long-chained n-alkanes. Aside from this, depositional conditions in this environment were highly variable, leading to heterogeneity in Corg, HI and OI values; such variability is typical in lacustrine environments, whereas marine black shales are in comparison often more homogeneous. Variability was probably enhanced by lake level fluctuations and even short-term marine ingression. Biomarker data also indicate low oxygen concentrations in bottom water during deposition, but not completely anoxic conditions. Sulphur is mainly present in pyrite due to high iron concentrations.
A variety of maturity indicators was measured in this study. The dataset includes Rock-Eval T max, vitrinite reflectance, miospore colour and various biomarker data, which all confirm an overall immature to early mature stage for the Middle Devonian flagstones of the onshore Orcadian Basin. High HI values indicate the presence of oil-prone kerogen (type I–II), which is supported by petrographic data revealing abundant alginite and by palynofacies analysis revealing predominant AOM.
Burial and temperature history modelling applying kinetic data revealed no significant petroleum generation for the onshore area, whereas significant petroleum generation can be assumed for the offshore area, where deep burial occurred during the Cretaceous. The Devonian source rocks are therefore thought to have contributed significantly to the filling of oil fields such as Beatrice field in the offshore areas; further studies would be necessary to verify this, including a 2D or 3D petroleum system modelling.
Some earlier published data tentatively suggest an early (Carboniferous) petroleum generation event and more mature source rocks in other parts of the onshore area that have to be linked to either high heat flows (due to magmatic/hydrothermal processes) or to deep burial followed by erosion. We achieved a good calibration match with a Carboniferous erosion thickness of 1300 m for the onshore area coupled to a heat flow of 60<6>mW m–2. However, as these values did not achieve high temperatures required for petroleum generation (as suggested in the earlier publications), we have calculated the minimum heat flows and burial depths that must be expected for such a Carboniferous petroleum generation from the Devonian source rocks. A heat flow of 120 mW m–2, coupled to an erosional thickness of 2000 m, would be required as a minimum for significant petroleum generation during this time.
Acknowledgements
The authors would like to thank two anonymous reviewers for constructive comments that greatly helped to improve this manuscript.



