


Introduction
Reference WeertmanWeertman (1974), while discussing the stability of the ice-sheet/ice-stream/ice-shelf system, noted that the position of the grounding line was particularly sensitive to the state of mass balance. He defined the grounding line as the place where the weight of a glacier first becomes supported by the pressure of the sea beneath it and, as a result, loses contact with the bed, i.e. the position G in Figure 1. The position of the grounding line depends on ice thickness and sea-level, and will change if these parameters are affected by climatic changes. The rapidity of these changes will be controlled by the bedrock slope and glacier surface slope. This paper treats the problem of locating the position of the grounding line accurately from field observations. This has been done for the central region of Rutford Ice Stream (Fig.2), as part of a larger study of ice-stream dynamics (Reference Stephenson and DoakeStephenson and Doake 1982).
Probable geometry (with greatly exaggerated gradients) of the grounding line in region A (Fig.3). G is the point where the glacier uncouples from the bed (grounding line) and H is where the ratio of surface elevation to ice thickness passes through the hydrostatic equilibrium value.


Description
Two methods were used to determine the position of the grounding line. By combining data from topographic levelling and radio echo-sounding of ice thickness it was possible to determine where the ratio of surface elevation to ice thickness equalled the hydrostatic equilibrium value, after making estimates of average Ice density and sea-level. Average ice density was determined by assuming an exponential variation of density with depth and extrapolating data from density profiles obtained to a depth of 10 m. Estimates of sea-level relative to the ice surface were made using data from a transverse stake scheme where the ice was assumed to be in hydrostatic equilibrium (Reference Stephenson and DoakeStephenson and Doake 1982). Where there are coincident level lines and radio echo profiles it is possible to calculate the variation of the ratio of surface elevation to ice thickness. The point where the ratio falls from significantly above the hydrostatic equilibrium value to below it is close to, but not necessarily coincident with, the grounding line, as will be shown later. This point is indicated by H in Figure 1. Figure 3 shows four lines where coincident levelling and radio echo-sounding traverses were made, together with positions where the ratio of surface elevation to ice thickness goes through the hydrostatic equilibrium value.
The second method of determining the grounding line measured the flexing of the ice stream due to sea tides and located the point of hinging. The bending was measured using tiltmeters which determined the change in surface gradient during the tidal cycle by recording the change in fluid level in one of two connected reservoirs 5 m apart (Reference Stephenson, Doake and HorsfatlStephenson and others 1979). During the 1978–79 season one meter was used at eight sites and during the 1979–80 season three meters were used. One was left near stake 21 for 43 days while the other two, deployed as an orthogonal pair, were used at a further eight sites. Positions are shown on Figure 3.
Central region of the stake scheme with stake positions marked by solid triangles. Contours of surface elevation are at 10 m intervals. Thick straight lines shows coincident topographic levelling and radio echo ice-thickness profiles with the letter H marking positions where the ratio of surface elevation to ice thickness goes through the hydrostatic equilibrium value. Tiltmeter sites are shown by circles (open: 1979, closed: 1980) with tails indicating orientation of meters. Strand cracks were observed at places indicated by short wavy lines and by the letter A.

Additional evidence for the position of the grounding line was obtained while carrying out sledge-borne radio echo profiling, when strand cracks were seen at the locations indicated in Figure 3. Their movement was monitored in the vicinity of A (Fig.3) where it was found that they opened 4- to 5 mm at low tide and closed again as the tide came in. Normally the cracks were isolated, running for several hundreds of metres in gentle wavy lines.
Results
The radio echo signal reflected from the ice-rock interface was intermittent, restricting the use of topographic level data to locate the grounding line. The method of calculating where the surface elevation to ice thickness ratio goes through the hydrostatic equilibrium value can only indicate a point on the grounding line, not its azimuth. However, strand cracks can give some indication of the grounding line azimuth, although in region A, where cracks were numerous, they crossed each other at angles approaching 90°, implying that here there were two axes of bending. Observation of strand cracks implies that the grounding line in the eastern half of the ice stream is more to the north than suggested in Reference Stephenson and DoakeStephenson and Doake (1982).
Examples of tiltmeter records are shown in Figure 4. The magnitude of change in surface gradient recorded by the tiltmeter is related to the magnitude of the tide, the stiffness of the glacier and where in the flexing zone the site was situated. The maximum tilting was recorded at site 4, 3 km downstream from where the ice stream achieved hydrostatic equilibrium. Here the amplitude of tilting was 400 μrad or a vertical peak-to-peak movement of about 0.8 m in 1 km. Figure 4 shows that close to grounding lines the tidal signal became distorted. At site 3 one arm gave a signal which has a clear form during high tide (positive gradient in Figure 4) but was damped at low tide. At the same site the orthogonal direction gave a squarer version of the tidal signal but its magnitude was smaller. Further away from the grounding line the tidal record was less distorted.
Tiltmeter records, 1980. Top record is a section from the long-term site installed near stake 21. The bottom two are from tiltmeters forming the orthogonal arms at site 3o Positive gradient corresponds to rising tide.

The tidal movement was recorded by a gravity meter at a site about 15 km downstream from the grounding line. Although the signal was superimposed on a large drift it correlated well with the flexing recorded near stake 21. The record lasted for 26 h and gave a peak-to-peak change in gravity of 1.0±0.5 mgal. Using the conversion of Reference Thiel, Crary, Haubrich and BehrendtThiel and others (1960),

the tidal amplitude was 1.9±1 m. Reference PrattPratt (1960) recorded similar amplitudes at the front of Fiichner Ice Shelf and Reference Williams and RobinsonWilliams and Robinson (1979) showed that the presence of the Ross Ice Shelf had little effect on the tidal movement so the amplitudes measured on Rutford Ice Stream seem reasonable.
Tidal Analysis
The analysis of tidal signals is extensively reviewed by Reference GodinGodin (1972). Usually, data are required for periods greater than 2 weeks and application of the filters normally used are not appropriate where the recording time is less than one week. A standard tidal analysis was carried out by the Institute of Oceanographic Sciences, Bidston, England, on the 43-day record from stake 21, which determined 35 constituents. The four main constituents are presented in Table I. Θ is the phase lag with respect to the equilibrium tide at Greenwich and H, the “amplitude”, is the change in angle of tilt.
Hain Constituents of the Ocean Tide Recorded by Tiltmeter on Rutford Ice Stream (78°33’S 82°58’W)

The analysis of records from other sites was based on Fourier series theory. The signal recorded over a time span T is part of a non-harmonic signal but can be represented over the time span as a set of harmonic components in a Fourier series taking T as the largest period. Because of the shortness of the recording periods, most of which were from three to seven days, no attempt was made to separate the tidal constituents where frequencies differed by less than about 0.3 d−1. However, Fourier series analysis lends itself well to separating different tidal bands, though only the diurnal and semi-diurnal bands are considered here. The length of the fundamental period Ts (TS<T) is selected so that it is an integral multiple of the mean period of the semidiurnal band. The Fourier series of a function F(t) can be represented as

where A0 is the average value of F(t). The coefficients Cn are found from

where ϕn is selected as the phase angle which gives the maximum value of Cn. Thus the coefficient Cn and phase angle Φn corresponding to the different tidal bands can be found for both tiltmeter records at each site. Cn will be the sum of the ‘amplitudes’ of the tidal constituents in a band treating their frequencies as equal and having a phase difference which, although a function of time, can be considered constant over the recording time at one site. The records need to be normalized if each leg at a site was recorded at a different time or for comparison between sites. This is achieved by dividing each value of Cn by the value of Cn derived from an analysis of the record from the tiltmeter at stake 21 for the corresponding period of time. For each selected frequency band the tilt amplitude for the two arms can then be combined to give the amplitude and direction of maximum bending, allowing comparisons to be made between sites. The arrows in Figure 5 summarize these results for the semi-diurnal band.
Arrows show the size and direction of tilting at each site occupied in 1980, Boxes show the position, with error, of the grounding line (thick line) estimated using the curve in Figure 6. The letters H show points on profiles where the glacier achieves hydrostatic equilibrium. The grounding line is also defined from the observations of strand cracks at places indicated in Figure 3.

Discussion
Theoretical profiles of flexing at the grounding line which assume an elastic response of ice have been modelled using beam theory (Reference RobinRobin 1958: 122–125, Reference HoldsworthHoldsworth 1969, Reference Holdsworth1977, Reference HughesHughes 1977). The vertical deflection of the glacier profile y(x) where x is the distance from the grounding line is given by

where β4 = ρw(l-v2)g/4EI and E is Young’s modulus, ν Poisson1s ratio, pw the density of sea water, g the acceleration due to gravity, 2h the thickness of the glacier, n the tidal amplitude and I is the moment of inertia equal to
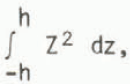
assuming a constant ice density. Reference HoldsworthHoldsworth (1977) took account of creep behaviour by replacing E in the expression for S by a parameter whose value was time-dependent. His conclusion was that floating glaciers subjected to the typical cyclical strain-rate gradients produced by tidal flexure are likely to behave in a plastic manner. Using Robin’s expression for the surface longitudinal stress σ(X),

at the grounding line of the Rutford Ice Stream, with x = 0, gives the maximum surface stress to be 9.8 × 10⁵ N m-2 if h = 0.9 × 10³ m, E = 9 × 10⁹ N m−2, ρW = 1 025 kg m −3, ν = 0.3, n = 2 m. This would correspond with an elastic surface strain of 3.0 × 10⁻⁵ produced over a period of about 3 h, that is to say an average strain-rate of 2.8 × 10⁻⁹ s−1. If a flow law of the type

= (σ/B)n is used to model the strain-rate
for secondary creep, where n and B are empirical constants valued 3 and 1.26 × 10⁸ N m−2 s1/3 respectively then a stress of × 105 N m−2 would cause a strain-rate ofx 10−9 s−1.
The similarity of these strain-rates suggests that the glacier is deforming partly through creep flow and partly by elastic straining. However, the equation for creep flow would underestimate the flow rate, which is still dominated by transient creep after 6 h (Reference HobbsHobbs 1974).
The end conditions which have been assumed in the models are a clamped beam at one end with the other end simply rising and falling without deformation. The seaward end of the Rutford Ice Stream is probably moving freely up and down on the tide although tilt-meters were not installed far enough downstream to define the limit of flexing. However, tidal flexing was recorded upslope of where the ice stream achieved hydrostatic equilibrium. The semi-diurnal components recorded at sites 1–5 projected onto the line BB on Figure 5 are plotted on Figure 6. The orientation of the line BB is chosen to be parallel with the average direction of maximum tilting. The choice of orientation will affect the horizontal scale of Figure 6 and subsequent curve fitting. A 20° error in orientation would produce a 6% error in the horizontal scale. The theoretical profile shown in Figure 6 is the differential of Equation (1). The best fit was obtained using values n = 1.3 ± 0.25 m and β = 3.5 × 10⁻⁴ ± 0.4 × 10⁻⁴ m−1. Using the elastic form of the equation for β, the value of the product El is 1.5 × 10¹⁷ N m compared with a value of 6.6 × 10¹⁸ N m using values of E and h as above. The low value of the product El is partly accounted for by replacing Young’s modulus by the time dependent modulus derived by Reference SinhaSinha (1978) to take account of creep flow. For a period of 12 h its value is 1.8 × 10⁹ N m−2. This would then imply an effective thickness reduced from 1 800 to about 900 m. The effective thickness may be explained if the bending is dominated by the most competent ice, omitting say the top and bottom 450 m. Alternatively, strand cracks may reduce the effective thickness in much the same way as crevassing (Reference Lingle, Hughes and KollmeyerLingle and others 1981).
Magnitude of semi-diurnal component of the signal at five sites projected onto the line BB in Figure 5. Calculated profile uses elastic beam solution with the deflection and gradient both equal to zero at the grounding line.

The value of n that gives the best fit indicates that the vertical movement of the ice shelf at the limit of significant deformation about 9 km from the grounding line is 2.6 ± 0.5 m peak-to-peak for the semi-diurnal component, which is of the same order as the estimate from gravity measurements.
Conclusion
The curve in Figure 6 can now be used to determine the upslope limit to flexing implied by the record from each tiltmeter. The curve will give two distances for the limit to flexing for each value of tilting. The correct distance must be interpreted using the records from neighbouring meters and the other means of determining the position of the grounding line. The positions of the upstream limit of flexing implied for each tiltmeter are shown in Figure 5.
The tilt data suggest that flexing occurs about 1 to 3 km above the point where the ice assumes hydrostatic equilibrium. The point at which the glacier will start to float will depend on bedrock geometry. Reference HoldsworthHoldsworth (1977) shows some possible forms of grounding-line geometry (in the absence of tidal motion) and Figure 1 shows the probable form of the grounding Une on the Rutford Ice Stream in the vicinity of the point marked by A on Figure 2. At the point G (Fig.1) sea pressure at the base and vertical shear stresses in the glacier combine to uncouple the glacier from its bed by overcoming its weight. Thus the upstream limit of flexing coincides with the grounding line. Further downstream, of the order of the glacier thickness, as the vertical shear-stress gradient with respect to the x direction decreases through zero, the surface elevation to Ice-thickness ratio passes through the hydrostatic equilibrium value (H on Figure 1). However, the description in simple beam theory of the hinging point being clamped may be too idealized, and different end conditions may apply (e.g. a pivot or a free end). In addition some vertical movement may occur upstream of the grounding line for different bedrock geometries (e.g. a step). Migration of the grounding line throughout the tidal cycle would change the tidal record of a tiltmeter by rectifying the tidal signal in the region of migration. This effect would be small where gradients were high. On the Rutford Ice Stream, along the profile BB in Figure 5 the surface gradient is about 10−2. If the bedrock gradient is approximately the same, a tidal amplitude of 3 m would produce a zone of migration 300 m wide.
More data are required to confirm the form of the profile in Figure 6, particularly at each end. If the form of an elastic solution is found to be correct, its dependence on creep terms needs further study but here is the basis of a powerful field technique for detecting and monitoring grounding lines.
This work has greatly benefited from my discussions with Or C S M Doake and Professor J F Nye. I wish to thank the staff of the British Antarctic Survey st Cambridge, England, and Rothera, Antarctica, for their assistance with field work in 1979 and 1980.



