Since the pioneering work of Duverger (Reference Duverger1954), economists and political scientists have built up a substantial body of work explaining how electoral systems determine aggregate political outcomes. Theoretical work has posited a number of mechanisms linking electoral rules to individual-level behavior and then to the number of parties in a country, mainly via changing strategic coordination incentives of voters and elites (Cox Reference Cox1997; Cox Reference Cox2015). We also have an extensive set of empirical studies that aim to test these propositions at an aggregate level, for example by looking at the number of parties that receive votes in a national election (for example, Carey and Hix Reference Carey and Hix2011; Lijphart Reference Lijphart1999; Taagepera and Shugart Reference Taagepera and Shugart1989). But clearly identifying the effects of the electoral system on aggregate voting patterns is fraught with endogeneity challenges (Rodden Reference Rodden, Lichbach and Zuckerman2009a). Cross-country comparisons, between countries with different electoral systems, can identify some general regularities and correlations. But, because so many factors vary between countries in addition to the electoral rules, such as changes in the number and sizes of parties, these patterns cannot be interpreted causally. Responding to this constraint, laboratory studies have tried to isolate the causal effect of electoral rules on voting behavior and strategic coordination (for example, Hix, Hortala-Vallve and Riambau-Armet Reference Hix, Hortala-Vallve and Riambau-Armet2017; St-Vincent, Blais and Pilet Reference St-Vincent, Blais and Pilet2016).
Between the aggregate-level observational studies and the micro-level experimental studies there is new body of research that looks at real-world election outcomes at a low level of aggregation. This new research aims to get closer to identifying the causal mechanisms at work when electoral systems change than is usually possible with national-level data, while claiming a higher level of external validity than can usually be inferred from laboratory experiments. For example, Fujiwara (Reference Fujiwara2011) and Bordignon, Nannicini and Tabellini (Reference Bordignon, Nannicini and Tabellini2016) exploit regression discontinuity designs in the assignment of single-ballot and dual-ballot plurality systems in the context of Brazilian and Italian municipal elections, respectively. Fujiwara (Reference Fujiwara2011) finds that a change from single-ballot plurality rule to dual ballot reduced the vote share of the top two candidates, to the benefit of the third-placed candidate, which is consistent with strategic voting. Bordignon, Nannicini and Tabellini (Reference Bordignon, Nannicini and Tabellini2016), by contrast, find no evidence of strategic voting, but strong responses by political elites (strategic entry). Pons and Tricaud (Reference Pons and Tricaud2018) similarly exploit the discontinuity generated by the qualification rule for the second round of French elections. They find that the presence of a third candidate in the second round disproportionately harms the candidate ideologically closest to this candidate, suggesting that voters tend to vote expressively rather than strategically.
This letter builds on this new generation of research, by studying how a major electoral system reform affected strategic coordination: the introduction of proportional representation (PR) in Norway in 1919. We use a new panel data set of stable subnational geographic units, which allows us to measure parties’ vote shares at a low level of aggregation: in the pre-reform single-member districts (SMDs) (under the initial majoritarian system), and in the same geographic units within the larger multi-member districts (MMDs) (under the new proportional system) (Cox, Fiva and Smith Reference Cox, Fiva and Smith2016). We use data for multiple elections before and after the PR reform to investigate whether secular trends threaten the validity of our research design.
Electoral reform in Norway is a case of a more general phenomenon, as a large number of countries in Europe moved from SMD to PR electoral systems in the first two decades of the twentieth century. In addition, the particular political environment in Norway at that time means that it is a very good case for seeking to isolate the effects of electoral reform. The franchise had been extended some years before 1919: full suffrage was extended to all men in 1898 and all women in 1913. Also, even before the adoption of PR, Norway had a stable multiparty system: the parties that existed before the reform all existed afterwards. Cox, Fiva and Smith (Reference Cox, Fiva and Smith2016) use the 1919 Norwegian reform to study voter mobilization under different electoral rules. In line with theories of elite mobilization, they find a substantial contraction effect in the distribution of voter turnout rates following the adoption of PR. We study how the PR reform affected strategic entry, voter coordination and the fragmentation of the party system.
Duverger (Reference Duverger1954, 252) and others have pointed out that the adoption of PR in Norway led to an increase in the number of parties. Indeed, we show that the introduction of PR led to a step-change increase in the effective number of parties of about one; mainly due to the strategic entry of a new party (The Farmers Party, formally established in 1920). This change in the number of parties happened immediately after the election, rather than developing over several elections. This finding challenges the conventional view that the effects of electoral system reforms take a long time to play out (Renwick Reference Renwick, Pekkanen, Herron and Shugart2018).
In our main analysis, we identify how the electoral system reform shaped voting behavior using election outcomes in the same geographic units in all elections between 1909 and 1927. We build a research design to isolate how the reform affects strategic coordination between existing parties. Following the standard theoretical understanding of strategic coordination, we expect the lower incentive to vote strategically under PR to lead to more votes for parties that were not competitive in 1918. We find precisely this dynamic, particularly for the Conservatives and Liberals, where voters changed how they coordinated between these two parties.
Electoral context
After the dissolution of the union with Sweden (1905), elections to the Norwegian Parliament (Storting) were decided by a two-round runoff system. In the first round, a candidate was elected if he received an absolute majority of votes cast in the district. If no candidate received an absolute majority in the first round, a second round was held within a few weeks. In the second round, candidates could enter even if they had not run in the first round.
The first formal political parties were established two decades before the dissolution with Sweden: the Liberals (Venstre) and Conservatives (Høyre) in 1884, and the Labor Party (Arbeiderpartiet) in 1887. However, up until the 1909 election, the party system was in a state of flux (Helland and Saglie Reference Helland and Saglie2003). From the 1909 election onwards, three party ‘blocs’ dominated: the Labor Party; the Liberals and Labor Democrats (Arbeiderdemokratene; est. 1906); and the Conservatives and Progressive Liberals (Frisinnede Venstre; est. 1909). Various other minor parties and organizations also fielded candidates in the runoff period, including the Norwegian Agrarian Association (Norsk Landmandsforbund; later Norges Bondelag; est. 1896).
In the first decades of the twentieth century, the Storting agenda was dominated by discussions concerning the primary industry, military budgets, educational reforms and infrastructure expansions (especially by rail) (Høyland and Søyland Reference Høyland and Søyland2019). Class antagonisms were acute in this period and the labor movement was hostile to bourgeois society (Helland and Saglie Reference Helland and Saglie2003).
With the expansion of the franchise, support for the Labor Party substantially increased. Appendix Figure A.1 shows the vote shares and seat shares for the three dominant and a residual ‘other’ category over the 1909–1927 period. The two-round runoff system led to a systematic under-representation of the Labor Party. This sitatuation mostly benefitted the Liberals, who formed a single-party government from 1913 to 1920.
The Liberal Party mainly represented rural interests against the interests of the urban Conservative establishment. The Liberals were also social reformers, though, introducing early welfare state reforms when in government, which extended their appeal to lower-income rural voters after universal suffrage. Nonetheless, the Liberals shared strategic interests with the Conservatives, in a common ‘bourgeois bloc’ against the growing support for Labor among the industrial working class (Valen and Rokkan Reference Valen, Rokkan and Rose1974).
In July 1917, parliament appointed a commission to consider changes in the electoral system. This commission presented its reform proposals in April 1919. Finally, in November 1919, MPs voted on five alternative reform proposals. A system of closed-list PR in MMDs obtained the necessary two-thirds majority (Cox, Fiva and Smith Reference Cox, Fiva and Smith2019). The new electoral system, effective from the 1921 election, grouped old SMDs into twenty-nine MMDs with a magnitude of 3–8 seats. The total number of seats in the Storting increased from 126 to 150. The seat allocation method chosen was the D'Hondt formula, which tends to favor larger parties in smaller-magnitude districts.
The conventional wisdom holds that the adoption of PR in many European democracies in the early 1900s came about as a strategic effort by bourgeois parties to preserve political power (Boix Reference Boix1999; Rokkan Reference Rokkan1970).Footnote 1 However, there are many cases in which PR reforms ‘did not help old elites to maximize their seat shares’ (Calvo Reference Calvo2009, 256). In the case of Norway, the Liberals dominated in parliament under the runoff system, but received only about a quarter of the seats after the adoption of PR. Rodden (Reference Rodden2009b, 2) points out that the Rokkan-Boix argument ‘has always had an uncomfortable relationship with certain facts. Above all, as a bulwark against the left, proportional representation can only be viewed as a colossal failure’.
Leemann and Mares (Reference Leemann and Mares2014) provide a reformulation of the Rokkan-Boix theory: they argue that PR is introduced when legislators face strong district-level competition and when their parties expect to gain seats from a change of the electoral law. Using data from Germany, they find support for this revised hypothesis. In the case of Norway, Cox, Fiva and Smith (Reference Cox, Fiva and Smith2019) similarly find that the district-level electoral threat facing individual legislators explains roll-call votes concerning PR adoption. They also emphasize how PR affected party leaders' control over nominations, thereby enabling them to discipline their followers and build more cohesive parties, and find empirically that party leaders were more likely to vote in favor of PR adoption than rank-and-file members.Footnote 2
After the introduction of PR, the Norwegian Agrarian Association decided to form the Farmers Party (Bondepartiet; later Senterpartiet) at the June 1920 national congress of the association – only six months after the electoral reform bill had passed through parliament.Footnote 3 In 1918, the association fielded candidates in approximately 20 per cent of the single-member districts and won three seats.Footnote 4 In the 1921 election, after the introduction of PR and the formal establishment of the Farmers Party, they presented lists of candidates in about 80 per cent of the multi-member districts and won seventeen seats.
There was also a change within the Labor bloc. Following the 1917 Russian Revolution and the establishment of the Communist International in 1919, the Labor bloc in Norway split between supporters of communist revolution and supporters of a parliamentary road to socialism. Initially, the Norwegian Labor Party (DNA) joined the Communist International, which led to the formation of the Social Democratic Labor Party (NSA) in 1921, as a breakaway on the right of the party.Footnote 5 These changes within the Labor bloc were driven more by external events than electoral reform in Norway. Nonetheless, without the electoral reform, it is unlikely that the NSA and DNA would have both stood candidates throughout the country.
Political fragmentation before and after reform
Following Cox, Fiva and Smith (Reference Cox, Fiva and Smith2016), we construct a balanced panel data set of ninety-one ‘SMDs’ covering the elections between 1909 and 1927, with a total of 637 observations.Footnote 6 Based on this data, Appendix Figure A.2 documents a step-change increase in the effective number of parties (ENoP) following the electoral reform, suggesting that the fragmentation of the party system was immediate in Norway in the 1921 election.
In Appendix Table A.2 we analyze how the ENoP changed with the introduction of PR when adding (district-level) controls for the Farmers Party, the Social Democratic Labor Party and the Communist Party. The lack of any clear relationship between PR and ENoP when flexibly controlling for party entry via fixed effects (Column 5 in Appendix Table A.2) suggests that voters were unresponsive to the new electoral rules. Yet, we consider the estimates reported in Appendix Table A.2 to be lower bounds on the extent to which PR affected voter behavior. These are lower bounds because not only do parties act strategically to decide whether to form overall, they also target their resources strategically by deciding to stand in districts where they have the highest opportunity of winning seats. We therefore proceed with a sharper empirical test in the next section.
Strategic coordination between existing blocs
To isolate strategic switching between existing parties we restrict the panel data set to ‘SMDs’ in which the three dominant blocs participated in all election years; forty-two out of ninety-one SMDs fulfill this criterion.Footnote 7 This essentially limits the sample to SMDs in which all party blocs ran every year before the reform.Footnote 8 Restricting the sample in this way allows us to isolate shifts in the distribution of votes between these party blocs, while holding the number of blocs participating constant.
In this analysis, we are interested in how the electoral system reform affected the relative vote shares of the three main party blocs. For example, if voters coordinated between the Liberals and Conservatives before the reform, we should expect Liberal votes to go down in places where they were stronger than the Conservatives and up where they were weaker than the Conservatives. To identify these effects we define the pre-reform advantage of party i over party j to be (VS i − VS j)/(VS i + VS j), where VS denotes party vote shares. Because of what we know about the political positions of the three main party blocs – where the Conservatives are on the right, Labor are on the left, and the Liberals are between the other two blocs but much closer to the Conservatives – we expect the electoral system reform to have a bigger effect on vote trading between the Liberal and Conservative blocs than between the Liberal and Labor blocs, and limited vote trading between the Labor and Conservative blocs.
As discussed, the ‘bourgeois’ parties (the Conservatives and Liberals) shared common interests against the rising electoral support for Labor. Before PR, these two blocs had incentives to coordinate to defeat Labor candidates. As a result, in districts where the Liberals were not competitive, Liberal voters should strategically have supported Conservatives, and vice versa. The introduction of PR, which lowered the electoral thresholds, reduced these coordination incentives. As a result, Liberal voters who had previously voted Conservative could now support the Liberals, while Conservative voters who had previously supported the Liberals could now support the Conservatives, without these choices affecting the overall electoral fortunes of these two parties relative to Labor.
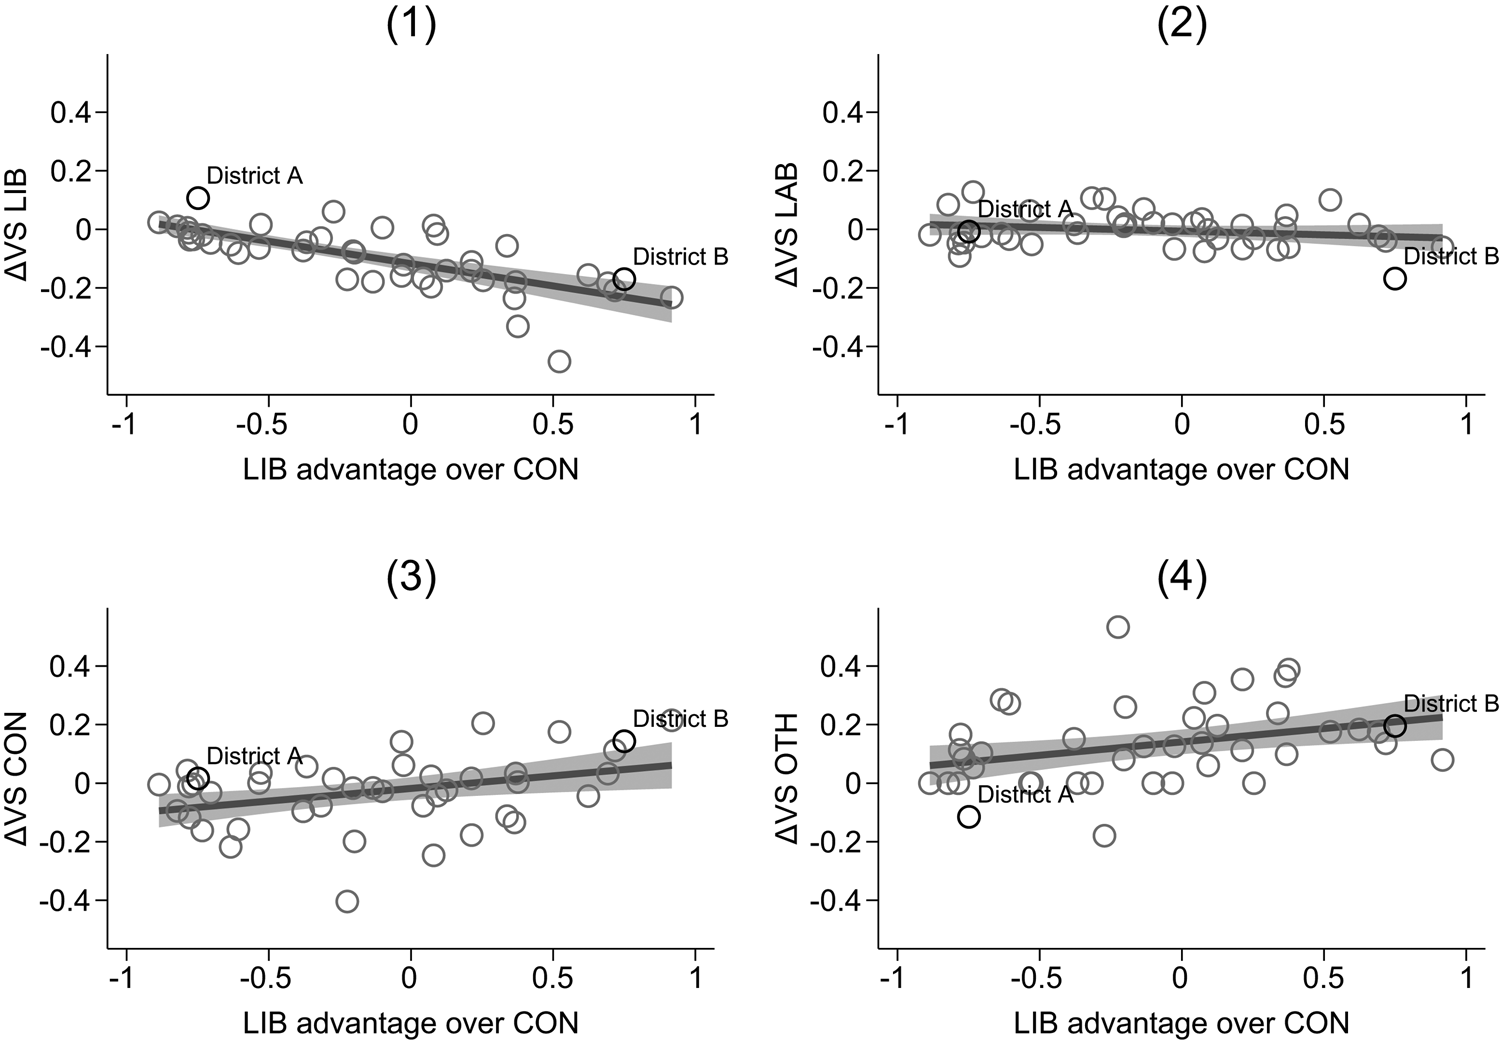
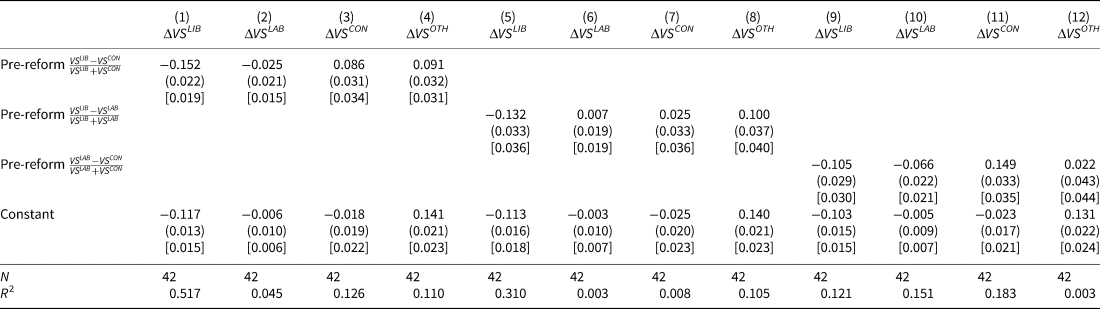
This is exactly what Specifications 1 and 3 from Table 1 show. We illustrate this key result in Panels 1 and 3 of Figure 1. Overall, the vote share of the Liberals fell between 1918 and 1921, as some of their voters switched to the Farmers Party, which had decided to stand candidates in most districts. The Farmers and the Liberal Party were now both competing for rural interests. However, in districts where the Conservatives were well ahead of the Liberals in 1918, such as in District A, the Liberal vote rose in 1921 (relative to the average), while in districts where the Liberals were well ahead of Conservatives in 1918, such as in District B, the Liberal vote fell in 1921.Footnote 9
Vote-trading between blocs between 1918 and 1921
Note: the scatterplots and fitted lines correspond to Specifications 1, 2, 3 and 4 of Table 1. The y-axes measure the percentage point change in vote share for the four different blocs between 1918 and 1921. The x-axes measure the Liberal advantage over the Conservatives in 1918. In the pre-reform period we use first-round vote shares. The sample is restricted to SMDs in which the three dominating blocs are participating in all election years. Shaded areas represent 95 per cent confidence intervals based on robust standard errors. We highlight two example districts: Nordland city district (District A) and Nordland county 2nd district (District B).

Vote-trading between blocs between 1918 and 1921

Note: the dependent variables are percentage-point change in the vote share from 1918 to 1921 for the bloc given in the header. The sample is restricted to SMDs in which the three dominating blocs are participating in all election years (n = 42). In the pre-reform period we use first-round vote shares. Heteroscedasticity-robust standard errors in parentheses. Cluster-robust standard errors based on the post-reform district level in brackets (eighteen clusters).
Column 1 of Table 1 shows that 52 per cent of the variation in ΔVS LIB is explained by variation in the pre-reform Liberal advantage. A one-standard-deviation increase in the pre-reform Liberal advantage over the Conservatives (0.51) is associated with an eight-percentage-point reduction in the Liberal vote share. Such a fall in the Liberal vote share appears to have benefited the Conservatives and the Farmers Party in about equal proportions (Columns 3 and 4), while leaving Labor vote shares roughly unaltered (Column 2).
In Columns 5–8 of Table 1 we analyze how the Liberal advantage over Labor correlates with vote share changes pre- and post-reform. Again, we see that a large Liberal advantage is associated with a fall in the Liberal vote share, but it seems that these votes were captured by the newly established Farmers Party, and not the Labor bloc.
In Columns 9–12 of Table 1 we analyze how the Labor advantage over Conservatives correlates with vote share changes pre- and post-reform. Here, the results shows that Labor tended to lose votes the stronger their (pre-reform) advantage over the Conservatives was (Column 10), while the opposite is true for the Conservatives (Column 11). Puzzlingly, we find that the Liberals tended to lose out when Labor had an advantage over the Conservatives (Column 9). This unexpected correlation may be driven by the fact that in districts where Labor had an advantage over the Conservatives, then typically a similar advantage existed for the Liberals over the Conservatives.
Strategic entry cannot drive our findings in Table 1 since our sample is restricted to cases where the relevant blocs participated in all election years. What about other elite-level explanations? For example, one could imagine that after the introduction of PR, parties might start to nominate better candidates in districts in which they were previously uncompetitive, and this might be driving voters’ decisions to switch parties (see also Becher Reference Becher2016).Footnote 10 To address this concern, we use candidate-level occupation data from the Fiva and Smith (Reference Fiva and Smith2017) dataset. Appendix Figure A.6 shows how the share of white-collar workers, blue-collar workers, farmers and a residual other category evolved over the 1909–1927 period by party bloc. For the Labor bloc, there is some indication that the introduction of PR led to an increase in the share of blue-collar candidates. For the Liberal and Conservative blocs the share of candidates from the four occupational groups are stable over the sample period. Still, this could mask across-district heterogeneity in the composition of candidates that potentially changes with the PR reform. We therefore include a set of controls at the district-bloc level to our regression framework. Appendix Table A.3 provides the results. Even though the R 2 increases substantially in some specifications, the coefficients of interest do not change much, suggesting that elite-level adjustments are not driving the findings in Table 1.Footnote 11
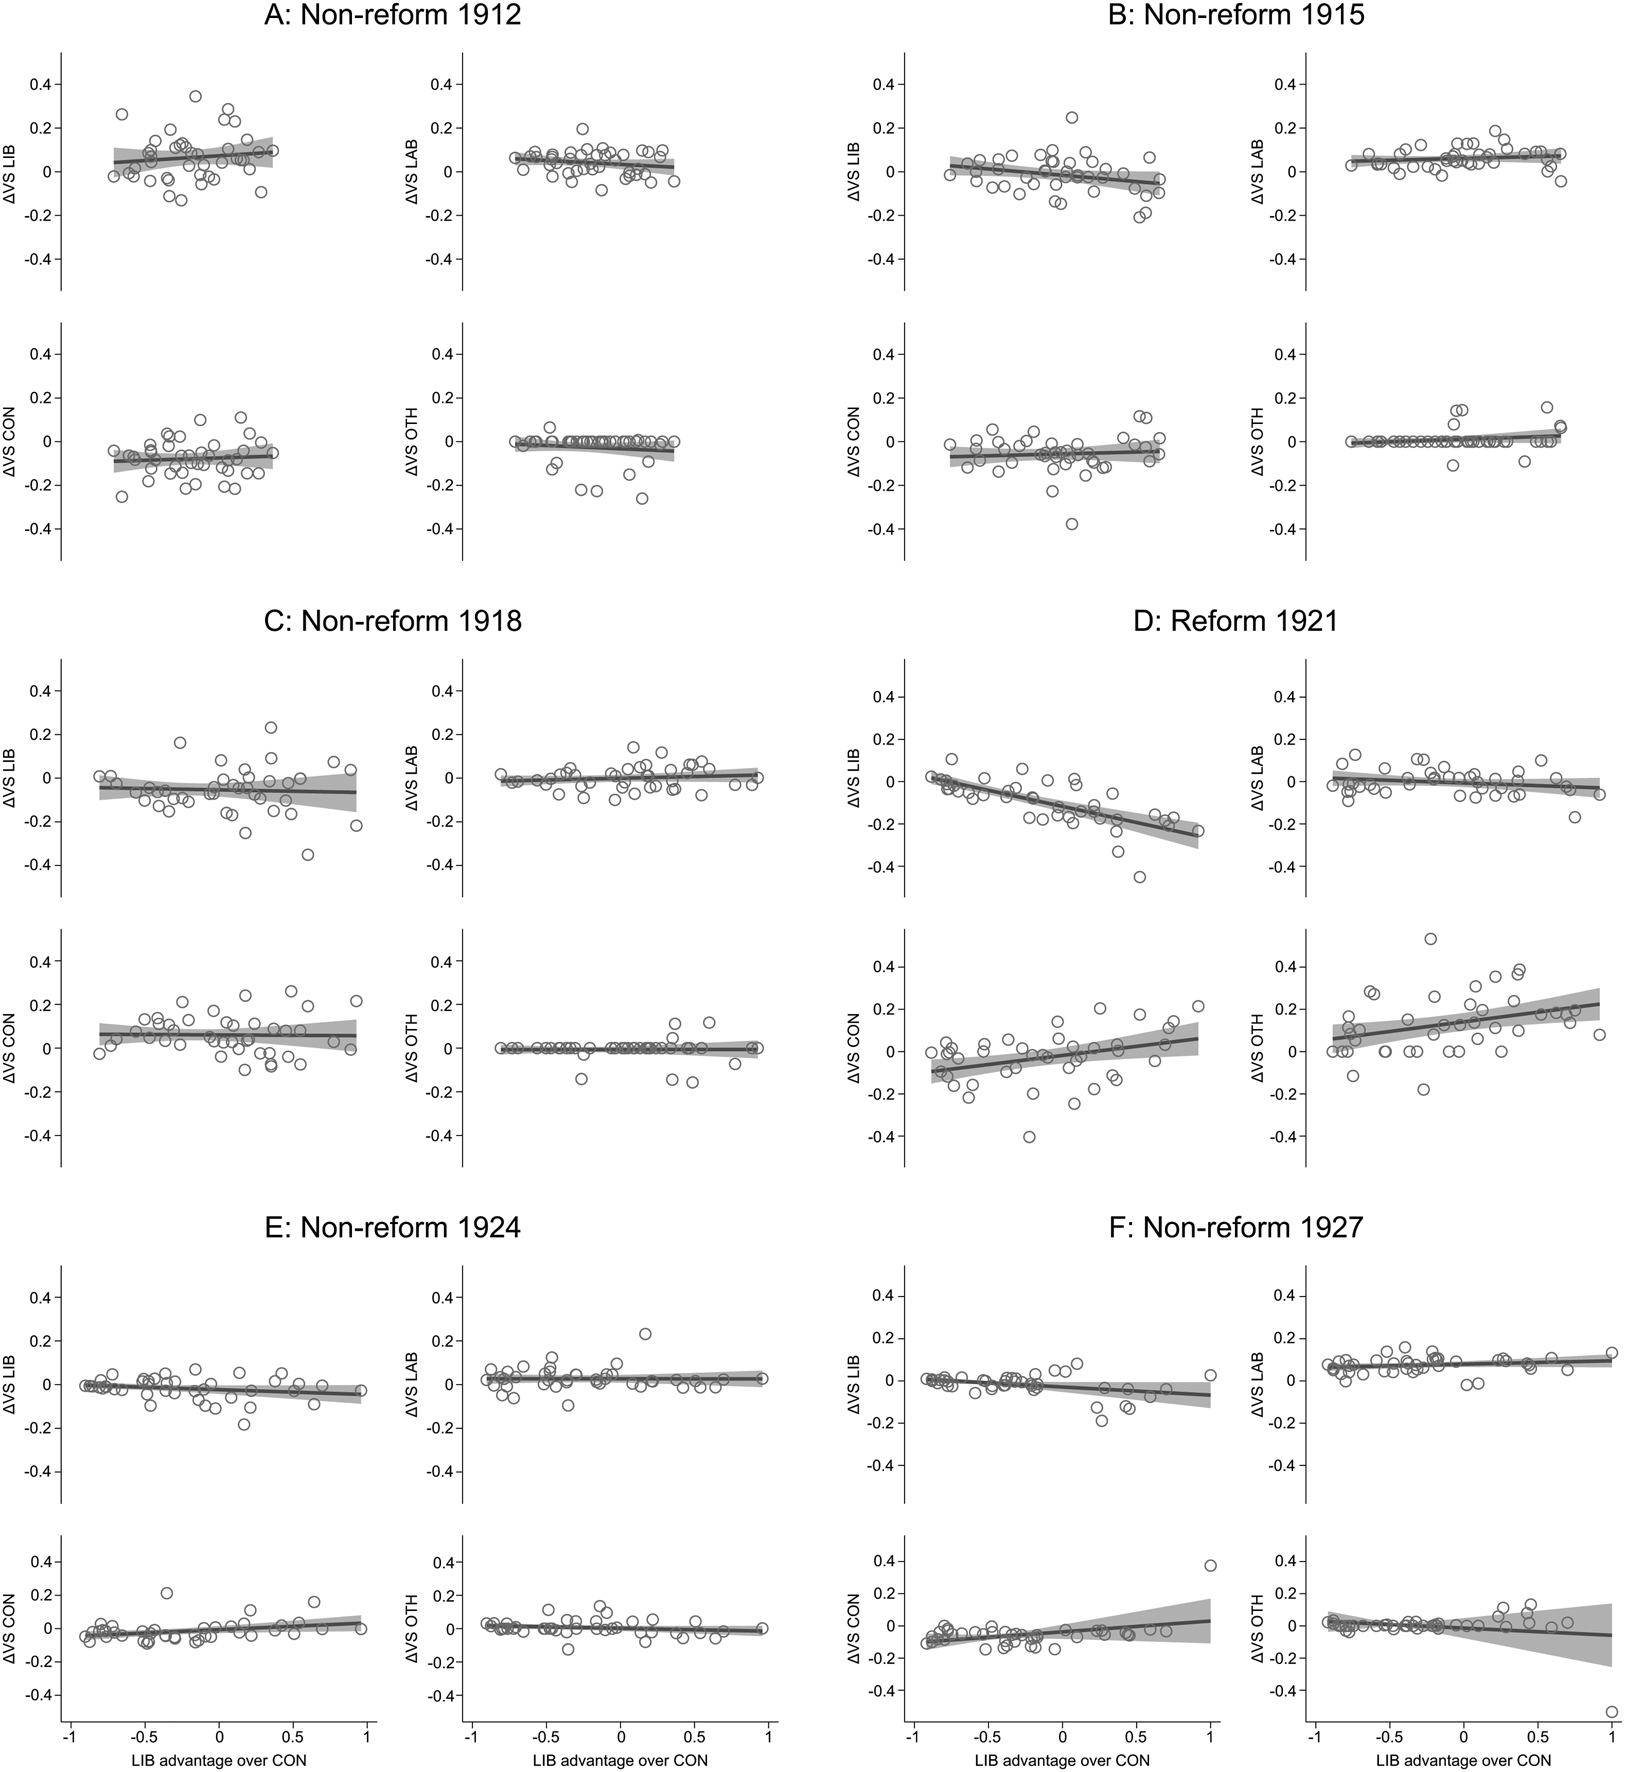
As a placebo test, we look at vote share changes as a function of the (lagged) Liberal advantage over Conservatives in non-reform years. Figure 2 shows these results (Panel A, B, C, E and F) along with the actual reform analysis (Panel D). We observe that the reform year stands out when compared to the non-reform years. In non-reform years there is no clear systematic pattern between the (lagged) Liberal advantage over Conservatives and the vote shares of these blocs.Footnote 12
Vote-trading in reform and non-reform years
Note: the scatterplots and fitted lines correspond to Specifications 1, 2, 3 and 4 of Table 1. The y-axes measure the percentage point change in vote share from year t – 3 to year t for the bloc given in the title of the sub-panel. The x-axes measure the Liberal advantage over the Conservatives in year t – 3. In the pre-reform period we use first-round vote shares. The sample is restricted to SMDs in which the three dominating blocs are participating in all election years. Shaded areas represent 95 per cent confidence intervals based on robust standard errors.

Conclusion
Existing theories suggest that moving from a majoritarian to a proportional electoral system should affect how voters and parties strategically coordinate. Whereas under a majoritarian system some voters have incentives to vote for their second- or third-most preferred party to prevent an even less-preferred party from winning a seat, under PR these same voters should now be able to vote for their most-preferred party if they expect it to be competitive in a district where the party was not previously competitive.
We find exactly this effect in Norway between 1918 and 1921. The introduction of PR led to an immediate increase in the ENoP, measured at the pre-reform SMD level, of approximately one. This shift was mainly due to the Farmers Party deciding to stand candidates in more districts, knowing that it would have a better chance of winning seats under PR than under the previous two-round system. Nevertheless, controlling for the number of parties standing before and after the reform, we also identified vote switching between the three main party blocs. In particular, the introduction of PR reduced the incentives for Conservative and Liberal supporters to coordinate to ‘keep Labor out’. This change in strategic incentives led to a reduction in support for the Conservatives in districts where they were ahead of the Liberals before the reform, and a reduction in support for the Liberals in districts where they were ahead of the Conservatives – although overall the Conservatives benefitted more from the reform than the Liberals. What is perhaps surprising is how quickly this coordination took place, as we only observe these changes between 1918 and 1921.
Our findings raise some interesting questions for future research on the transition to PR in the early twentieth century, such as whether the speed of voter adaptation is unique to the Norwegian case or is generalizable to other cases, or whether Conservatives or Liberals benefitted more from the new strategic environment. On the one hand, the structure of the party system in Norway prior to suffrage extension and the introduction of PR and the level of economic development was similar to many Northern European countries, which suggests that the results might be generalizable to other cases. On the other hand, the speed of this adaptation to the new strategic context might be unique to the Norwegian case, or at least specific to Scandinavian countries, where Conservatives and Liberals were traditionally more divided along urban rural lines than along class lines, which might have made voter coordination easier.
Supplementary material
Data replication sets are available at https://doi.org/10.7910/DVN/AX0ADR and online appendices at: https://doi.org/10.1017/S0007123419000747.
Acknowledgements
We are grateful to Gary Cox, Ben Geys, Leif Helland, Bjørn Høyland, Dan Smith, Heather Stoll, and seminar participants at LSE, Stanford University, the Carlos III University of Madrid, the Hebrew University of Jerusalem, and the University of Oslo for helpful comments and suggestions.