




No CrossRef data available.
NONPARAMETRIC ESTIMATION OF HOMOGENEOUS FUNCTIONS
Published online by Cambridge University Press: 06 June 2003
Abstract
Consider the regression  , where
 and the exact functional form of f is unknown, although we do know that f is homogeneous of known degree r. Using a local linear approach, we examine two ways of nonparametrically estimating f: (i) a “direct” approach and (ii) a “projection based” approach. We show that depending upon the nature of the conditional variance
 , one approach may be asymptotically better than the other. Results of a small simulation experiment are presented to support our findings.We thank Don Andrews and an anonymous referee for comments that greatly improved this paper. The first author thanks Professor Wolfgang Härdle for hospitality at the Institute of Statistics and Econometrics, Humboldt University, Berlin, where part of this research was carried out. Financial support to the first author from Sonderforschungsbereich 373 (“Quantifikation und Simulation Ökonomischer Prozesse”) and the NSF via grants SES-0111917 and SES-0214081 is also gratefully acknowledged.
Information
- Type
- Research Article
- Information
- Copyright
- © 2003 Cambridge University Press
1. INTRODUCTION
An important problem in microeconometrics is the estimation of shape restricted functions. To obtain good estimates without worrying about any potential misspecification problems, imposing valid shape restrictions on nonparametric estimators of these functional forms seems like a good idea. Beginning with the pioneering paper of Hildreth (1954), much work has been done in this area. See, for example, Gallant (1981), Yatchew (1988), Härdle (1989, Ch. 8), Ryu (1993), Matzkin (1994), Ruud (1997), and Yatchew and Bos (1997). Readers unfamiliar with nonparametric estimation techniques relevant to econometrics are referred to Bierens (1985), Härdle (1989), Härdle and Linton (1994), Yatchew (1998), and Pagan and Ullah (1999).
In this paper we restrict ourselves to estimating a conditional mean function f that happens to be homogeneous of known degree r. Recall that

is said to be homogeneous of degree

for all

such that

. Such functional forms are frequently encountered in microeconomic theory. For instance, the profit (resp. cost) function for a profit maximizing (resp. cost minimizing) competitive firm is homogeneous of degree one in prices. Similarly, the Marshallian demand functions for a utility maximizing agent are homogeneous of degree zero in prices and income. In production theory, attention is often restricted to production functions that are homogeneous of degree one, that is, that exhibit constant returns to scale. See, for instance, the classic paper by Arrow, Chenery, Minhas, and Solow (1961). Labor economists often assume that the matching function, which relates the number of jobs formed during a certain period of time to the number of vacancies available during that period and some other variables, is linearly homogeneous. See, for example, Petrongolo and Pissarides (2001) and the references therein.
Although many functional forms familiar to economists may satisfy other shape restrictions besides homogeneity, for now we focus upon homogeneity alone. One reason for doing so is that when compared with some other shape properties such as concavity or monotonicity, homogeneity is a particularly tractable property to analyze. Loosely speaking, this is because the set of all homogeneous functions (embedded in some larger space such as the set of all twice continuously differentiable functions) is a linear space. This linearity simplifies analysis in many situations. On the other hand, the set of all concave or monotone functions is not a linear space but a convex subset of the ambient space. Typically, this makes dealing with concave or monotone functions more difficult. Therefore, focusing on homogeneity alone may often lead to a simplification of econometric analysis. Furthermore, as a practical matter, imposing concavity and monotonicity restrictions on function estimates seems to be a hard though not an impossible task. In contrast, imposing homogeneity in nonparametric estimates is quite easy and may lead to substantial improvement of estimates in finite samples.
In the parametric case it is well known how to impose a homogeneity restriction. Basically, the idea is to restrict the parameter space. For example, in a log-linear Cobb–Douglas regression model with two covariates, homogeneity is imposed by requiring that the coefficients on the two factors sum to one. Even in the flexible functional form literature, homogeneity is imposed by restricting the parameter space. For instance, Gallant (1981) imposes constant returns to scale by making some parameters in a Fourier flexible form expansion sum to unity. Slightly differently, Ryu (1993) shows how to impose linear homogeneity by a polar coordinate transformation.
In the fully nonparametric case perhaps the simplest way of imposing homogeneity is to use a “direct” approach. In this approach we pick one variable as the numeraire and use it to normalize all variables. Estimation is then carried out using the normalized variables. For instance, Ruud (1997, p. 171) follows this approach in imposing homogeneity on his shape restricted estimator. From our conversations with many colleagues, we get the impression that most economists immediately think of this approach when asked to nonparametrically estimate a homogeneous conditional expectation. Because we are so used to working with ratios of variables such as relative prices, which are homogeneous of degree zero by construction, the choice of the direct approach is perhaps not very surprising.
But there is another way of nonparametrically estimating homogeneous conditional means. We call this the “projection based” approach for reasons that will be clarified later on. In this paper we show how to implement the projection based and direct approaches using local linear estimators and compare the asymptotic properties of the estimators obtained. Their analytical simplicity and ease of use should make the proposed estimators a useful addition to the tool kit of the applied econometrician.
The paper is organized as follows. Section 2 lists the maintained assumptions, and Section 3 describes the procedure for estimating homogeneous functions using the direct and projection based approaches. In Section 4 we compare the asymptotic performance of the direct and projection based estimators and show how the error term conditional variance determines which estimator is better. Section 5 describes the results of a small simulation experiment, and in Section 6 we discuss some additional efficiency related issues. Section 7 concludes. All proofs are confined to the Appendixes.
The following notation is used throughout this paper. We treat all vectors as column vectors and (most of the time) denote them explicitly by using a tilde. In particular,

, and

. Here

is a compact subset of

such that xs (the last component of

) is positive and bounded away from zero. The map

is the homogeneous of degree zero transformation

is the image of

under H0. We use

to denote a point that is fixed in

denotes its image under H0. Because the map

is one to one and continuous on

, it is straightforward to verify that

. The expression

is the set of all real valued functions on

that have continuous partial derivatives up to order k. We say that

and f, including all its partial derivatives up to order k, can be extended continuously to

. Finally,

is the set of all square integrable functions on

that are integrable with respect to the probability distribution on

, and

is the set of all functions in

that are also homogeneous of degree r. The symbol [cire ] indicates “approximate equality,” that is, equality modulo an additive but asymptotically negligible term. Unless stated otherwise, all limits are taken as the sample size n → ∞.
2. THE SETUP
Consider the nonparametric regression

.
Assumption 2.1. The following assumptions are maintained.
(i) The data

are independent and identically distributed (i.i.d.) random variables in

.
(ii) The functional form of

is unknown, but we do know r.
(iii) The conditional pdf of

is twice continuously differentiable at

.
(iv)

, the pdf of

, is twice continuously differentiable at

and

.
(v) For some γ > 0, the map

is bounded and continuous at

.
The restrictions on

, namely, that

is compact and that the last coordinate of

is positive and bounded away from zero, ensure that the conditional expectations in Lemmas 3.1 and 3.2 in Section 3 exist for all

. This allows us to handle any degree of homogeneity. The assumption that we know r is quite weak as economic theory frequently predicts the degree of homogeneity.
1Some well known examples are described earlier in Section 1.

is compact, (ii) implies that f is also an element of

. (iii) implies that

are twice continuously differentiable at

. This is used in the proof of Lemma B.1 in Appendix B. We use (iv) to ensure that the remainder terms in the Taylor expansions employed in Appendix A are well behaved. (iv) can be made more palatable if we interpret it to mean that we should carry out estimation and inference in regions where the density is bounded away from zero.
2Hengartner and Linton (1996) show that though nonparametric estimators of conditional mean functions remain asymptotically normal at points where the density of the conditioning variable is zero, their rate of convergence slows down and the constants associated with the limiting distribution change.
3. ESTIMATION HEURISTICS
Because f is homogeneous of degree r, we can write

The problem we investigate in this paper can be stated quite simply: should we estimate

using the first representation or the second? We refer to the estimator of

based on the first representation as a “projection based” estimator, whereas the estimator based on the second formulation is called a “direct” estimator. It may not be very obvious at this point how we can estimate

using the first representation, but as we shall soon show, it is quite easy to do so. Although algebraically equivalent, the two formulations will in general lead to estimators with different statistical properties because division by xsr alters the stochastic properties of the error term ε. In fact, and this should not surprise the reader, the statistical performance of the estimators depends upon the conditional variance

. In particular, we show that if

is homogeneous of degree zero (which includes homoskedasticity as a special case) then the projection based estimator is asymptotically better than the direct estimator, whereas if

is homogeneous of degree 2r ≠ 0 then the latter dominates the former.
Notice that if r = 0, that is, if we are estimating a homogeneous function of degree zero (e.g., a demand function), the two approaches will yield identical results. Furthermore, if s = 1 the problem is uninteresting because homogeneous functions are known up to scale in the one-dimensional case (because when s = 1, homogeneity of f implies that f (x) = xrf (1)). To avoid these trivial cases, from now on we assume that r ≠ 0 and s > 1.
Our estimation strategy is to approximate sample analogs of optimization problems that identify

using the two representations in (1). At the population level we can use the first representation to write

, where βp is identified as

Because

is a homogeneous function of degree r for all

, we can characterize

as the orthogonal projection of y onto

using the usual L2 inner product

. In particular, we can use Lemma B.2 in Tripathi (2000) to show that this projection can be explicitly calculated as

. This explains the term projection based in describing an estimate obtained by using the first representation in (1). Similarly, a population level specification of

using the second representation can be written as

, where we identify βd as

Observe that we can also characterize

as the orthogonal projection of y onto

using the “weighted” inner product

. But because this projection is not orthogonal with respect to the usual L2 inner product, we prefer to describe

as the “direct” population level specification of

.
The preceding discussion shows that to estimate f, it suffices to estimate βp and βd. Because a finite amount of data can at best allow us to estimate the value taken by a function at a certain point, we consider estimating the value of f at

. In particular, let us now see how we can estimate

.
So let β be a function in

that is sufficiently smooth. Think of β as being a generic symbol for βp or βd. Taylor expanding

around

and neglecting all higher order remainder terms, we can write

The unknown coefficients

can be estimated by doing least squares on sample analogs of (2) and (3) provided we can maintain the quality of the linear approximation in (4). This can be achieved by employing the usual device of local weighting to ensure that when estimating

, the

closer to

are given more weight than those observations that are farther away from

. Following this approach,

and

can be estimated as

where

.
Here

is the projection based (resp. direct) local linear estimator of

. Similarly,

is the projection based (resp. direct) local linear estimator of its gradient

. The kernel

(defined on

and the bandwidth an used previously satisfy the following conditions.
Assumption 3.1.

is a continuous density with support [−1,1] and is symmetric around zero. We also define

.
Assumption 3.2. The bandwidth an is a sequence of positive numbers such that an → 0, nans−1 → ∞, and nans+3 → λ ∈ [0,∞).
The asymptotic behavior of

is given by the following results.
LEMMA 3.1. Let Assumptions 2.1, 3.1, and 3.2 hold. Then3
Here

denotes a s × 1 vector of zeros.

LEMMA 3.2. Let Assumptions 2.1, 3.1, and 3.2 hold. Then

where bias1 and bias2 are defined in Lemma 3.1, and

We use

to denote the projection based and direct local linear estimates of

. Notice that

are homogeneous of degree r by construction; that is, we have obtained homogeneity constrained nonparametric estimators of f. Another nice feature of using the local linear approach is that both

and its partial derivatives can be obtained simultaneously. This comes in handy when one wants to calculate marginal effects or elasticities. Furthermore, solving these optimization problems is straightforward because they can be expressed in a weighted least squares framework. See the proof of Lemma 3.1 in Appendix A for details.
Local linear estimators of conditional mean functions, without any homogeneity restrictions, have been extensively studied. See, for instance, Fan (1992), Ruppert and Wand (1994), Gozalo and Linton (2000), and the references therein. If instead of a first-order approximation in (4) we had taken an mth-order Taylor expansion of

around

, where m > 1, we would have obtained mth-order local polynomial estimators of βp and βd. In our case such higher order approximations are unnecessary because a linear approximation suffices to compare the asymptotic mse of

. Of course, we could also have obtained locally constant (better known as Nadaraya–Watson) estimators of

by considering the “zeroth”-order approximation

in (4). In fact, it is easy to show that the projection based and direct Nadaraya–Watson estimators of

are given by

The reason we prefer working with local linear estimators, rather than the locally constant estimators, is that the asymptotic bias terms for the former are simpler (and thus much easier) to handle analytically. In particular, as shown in Lemmas 3.1 and 3.2, they do not have any terms involving the first derivatives of

:

Hence when local linear estimators are used, comparing the asymptotic mse of

reduces to comparing their asymptotic variances. In contrast, in Appendix B it is shown that for the Nadaraya–Watson estimators of

,

Although in Appendix B we also show that

and

, the squared bias of

cannot be ranked. Therefore, if we use Nadaraya–Watson estimators we cannot analytically compare the projection based estimator with the direct estimator in terms of asymptotic mse.
Finally, let

denote the usual unrestricted local linear estimator of

in the regression model

, that is,

where

is an appropriate kernel on

and the bandwidth bn is a sequence of positive numbers such that bn → 0 and nbns → ∞. Note that when f is homogeneous of degree r,

will converge at a slower rate to f than

. Imposing homogeneity on estimators of f reduces the dimension of the regressor space by one and leads to estimators with improved rates of convergence. In the simulations we will compare the finite sample behavior of

with

.
4. COMPARING


Following Lemmas 3.1 and 3.2, it is easy to see that the asymptotic variances of

are

To simplify the form of these variances, observe that the transformation

is one to one and apply iterated expectations. This yields

where

is the conditional variance function. It does not seem possible (at least to us) to compare the two variances if

is completely unknown. However, we can obtain some useful insights about the asymptotic variance of

satisfies the following assumption.
Assumption 4.1. Assume that either
(i)

for some unknown ψ; that is, the error terms are conditionally heteroskedastic such that

is homogeneous of degree zero in the covariates, or
(ii)

for some unknown ψ; that is, the error terms are conditionally heteroskedastic such that

is homogeneous of degree r ≠ 0 in the covariates.
Notice that Assumption 4.1(i) is automatically satisfied if the error term is homoskedastic. As an example of a model where homoskedasticity of ε is compatible with linear homogeneity of f, consider the following simple setup.
Example 4.1.
Let y be the observed profit, f the unobserved profit function of a competitive firm, and

the vector of observed output and factor prices. Assuming that the prices are measured without error but there is measurement error in the observed profit, we can write

. Because f is a profit function it is homogeneous of degree one, and as ε is treated as pure measurement error we can assume that it is homoskedastic.
Although homoskedasticity of additive errors is often a convenient statistical assumption, it is sometimes hard to justify from a structural point of view. In many cases, Assumption 4.1(ii) may be more plausible. As an example of a situation where both

are homogeneous of degree one, consider the following model, which is motivated by the discussion in McFadden (1984, p. 1406).
Example 4.2.
Let

be the vector of observed output and factor prices and

the unobserved profit function of a competitive firm. The term u denotes a firm specific random parameter that is distributed independently of

. It is unobserved by the researcher but is known to the firm itself. For instance, u could represent variables that are unobserved by the economist but are used by the firm when making production decisions. Because f* is a profit function, we assume that for each u ∈ U the map

is linearly homogeneous, monotone, and convex in the prices. Let

denote the maximum observable profit. Then using the fact that u is independent of

, we can write

where

and

Note that

has all the properties of a profit function. In particular, it is homogeneous of degree one. Moreover, we can also verify that

and that

is homogeneous of degree one.
Now it is easy to see that

Hence the expressions for the asymptotic variances simplify to

Because by the Cauchy–Schwarz inequality

we get that

under Assumption 4.1(i), and

under Assumption 4.1(ii). As the asymptotic bias for the two estimators is identical, we have

under Assumption 4.1(i) and

under Assumption 4.1(ii). Therefore, as expected there is no general ranking for the estimators in terms of asymptotic mse. Hence the choice of which estimator to use is not obvious but depends upon the nature of the heteroskedasticity of the error term.
5. SIMULATION
A small simulation experiment was performed to study the finite sample properties of the proposed estimators. Code was written in GAUSS, and we restricted our attention to the case s = 2. A number n of observations on y were generated from y = f (x1,x2) + σ(x1,x2)ε, where

and ε was chosen independently of (x1,x2). A Gaussian kernel was used to obtain

. For the first two estimators the bandwidth used was cn−1/5, whereas for

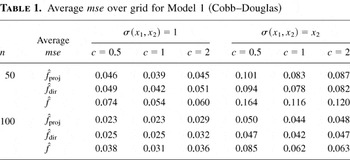
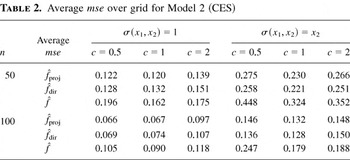
the bandwidth used was cn−1/6. Three different choices of c were considered: c ∈ {0.5,1,2}. As seen in Tables 1 and 2, the results do not seem to be very sensitive to the choice of bandwidth. Two particular specifications for f and ε were selected:

The terms f1 and f2 represent a Cobb–Douglas and constant elasticity of substitution (CES) specification, respectively. Note that both f1 and f2 are homogeneous of degree one. The model parameters were chosen so that var{f (x1,x2)}/var{y}, which can be thought of as a measure of the S/(S + N) ratio, for each model is around 0.8. Two simple forms for σ(x1,x2) were chosen to satisfy Assumption 4.1: σ(x1,x2) = 1, which satisfies 4.1(i), and σ(x1,x2) = x2, which satisfies 4.1(ii). Each function was estimated at a 10 × 10 uniform grid in [1,2] × [1,2] and the mse calculated at each grid point in 1,000 replications.
Average mse over grid for Model 1 (Cobb–Douglas)

Average mse over grid for Model 2 (CES)

Recall that our asymptotic results are about the pointwise behavior of the mse. But because the reader may find point by point comparison of mse on the 10 × 10 grid a tedious task, we present the average (over 100 grid points) mse in Tables 1 and 2.
As seen in the tables, the average mse is ranked according to our asymptotic results. Moreover, except in one case
4For Model 2 when n = 100 and c = 2. However, a decomposition of the average mse for this case revealed that although the average variance for

was smaller than the average variance of

, the average squared bias for the former was bigger than the average squared bias for the latter. Therefore, although the ranking with respect to the variances is preserved according to our theory, the average bias differs for the two models. Hence, in this case the higher average bias of

caused the ranking to change.

dominates, although there does not seem to be a dramatic difference between

in terms of average mse. When the conditional variance of ε is homogeneous of degree one,

has the smallest average mse although once again the difference between

is not very substantial. However, in each case the homogeneity constrained estimators clearly outperform

, the unrestricted local linear estimator of f. Therefore, when f is indeed homogeneous, using a homogeneity constrained estimator seems sensible. Of course, the reader must keep in mind the usual caveat about any simulation results, namely, that they are limited in nature and may vary if the underlying model parameters are changed.
6. DISCUSSION
In this section we address two efficiency related issues. First, recall that we can rank

in terms of the asymptotic mse if we have some information about the homogeneity of

. Hence an obvious question is: in the absence of such information about

, can we do better by (say) looking at a linear combination of the two? The second issue is more subtle and concerns the role of the numeraire xs (the last component of

) in the definition of

. Statistically, choosing a particular element of

as the numeraire matters. For example, Lemmas 3.1 and 3.2 show how the asymptotic bias and variance of

depend upon xs. Assuming that we have more than one candidate for the numeraire, each particular choice leads to a different estimator (projection based or direct) for

. Hence another interesting question is: how can we optimally combine these estimators to obtain an estimator that is invariant to numeraire choice?
To answer these questions, it helps to reformulate the estimation problem described in Section 3 in more general terms. So let

be a nonnegative function and consider the following weighted local least squares problem:

Letting

, it is apparent that the preceding optimization problem leads to a family of local linear estimators for

that are indexed by δ. In particular, for

we obtain the projection based estimator

whereas

yields the direct estimator

.
Following the arguments in Appendix A leading up to (A.7), it can be easily shown that

is asymptotically linear,
5To see this, replace

in the proof of Lemma 3.1 by

.

This representation is quite useful. For example, using the influence function of

in (7), a straightforward application of the central limit theorem reveals that

Expression (8) shows that the asymptotic variance of

depends upon the weight δ but the asymptotic bias does not. To get some intuition behind the former result, note that δ and

act on different arguments in the weighted local least squares problem. In particular, δ operates on

whereas

operates on

. The latter fact ensures that all expectations in the asymptotic variance of

are conditional on

. Hence as

is not predictable by

, the weighting function

survives in the limit. Clearly, this will not happen if

and δ have the same arguments. In particular, solving

which is the δ-weighted version of (5), will yield local linear estimators of

whose asymptotic bias and variance are independent of δ.
6Jones (1993) obtains a similar result for the asymptotic variance of a δ-weighted Nadaraya–Watson (i.e., locally constant) estimator. However, his results also show that the asymptotic bias of the weighted Nadaraya–Watson estimator does depend upon δ. As we have just shown, this does not hold for local linear estimators.
Let us determine the optimal δ that minimizes the asymptotic variance of

. Observe that because

by the Cauchy–Schwarz inequality, we have

Now if we choose

, where c can be any arbitrary positive constant, then (8) reveals that

Thus by (9) and (10), it follows that the optimal weight function is given by

. Furthermore, on comparing (6) with (9), we can see that

is asymptotically efficient under Assumption 4.1(i) whereas

is asymptotically efficient under Assumption 4.1(ii). Therefore,

automatically incorporates the optimal weighting scheme when

is homogeneous of degree r = 0 (resp. r ≠ 0). Hence it suffices to restrict attention to the projection based estimator when

is homogeneous of degree zero. Similarly, there is no loss of generality in only looking at the direct estimator when

is homogeneous of degree r ≠ 0. This suggests that if we have no prior information about the homogeneity of

, the best way to proceed may be to first estimate the conditional variance function and then do the weighted local linear regression described earlier.
Another way of improving on

is to consider an optimal linear combination of the two. So let

such that α1 + α2 = 1. Then

denotes a linear combination of

that is consistent for

. It remains to determine the optimal

for which the asymptotic mse of

is minimized. To do so, we need the joint distribution of

. Using (7) and the Cramér–Wold device, it is easy to show that

where

Because the asymptotic bias of

does not depend upon

, minimizing its asymptotic mse reduces to minimizing

. It is straightforward to verify that for any symmetric positive definite matrix Pp×p,

where

denotes a conformable vector of ones. Hence using (11),

Therefore, the optimal linear combination of

is

In general,

(which is also homogeneous of degree r) puts nonzero mass on

. However, if

is homogeneous of degree zero, then vpd = vp and the entire mass is put on the projection estimator. Similarly, if

is homogeneous of degree r ≠ 0, then vpd = vd and all mass is put on the direct estimator. In practice,

can be implemented by using a preliminary estimator of V.
7The optimal

in (12) depends upon the evaluation point

. This dependence can be eliminated by minimizing

, the integrated version of

. Hence the optimal linear combination that minimizes integrated asymptotic mse is given by

Numerical integration can be used to construct the feasible weights.
Finally, we construct estimators that are invariant to numeraire choice. So let

is positive and bounded away from zero}, that is,

denotes the set of all valid numeraire indices.

As in (7), we can show that

Notice that the choice of numeraire (in this case the ith component of

influences the asymptotic bias in addition to the asymptotic variance of

.
Now let

be a collection of weight functions. For convenience, assume that

has cardinality T and let

denote T × 1 vectors whose ith components (for

) are given by

, and

, respectively. We also let W be a T × T diagonal matrix such that its ith diagonal element is given by

, where

.
Using (13) and the Cramér–Wold device along with the fact that nans+3 → λ, we can show that

.
8Because

are evaluated at different points when i ≠ l, the asymptotic covariance between

is zero for i ≠ l. Hence the asymptotic variance-covariance matrix W is diagonal.

be a T × 1 vector such that its components sum to one, that is,

. Then

denotes a consistent estimator of

that is invariant to numeraire choice. Therefore, the invariant estimator that minimizes asymptotic mse is given by

, where
9Notice that

depends upon

. The optimal

that minimizes integrated asymptotic mse (and hence does not depend upon

is given by

.

Here

yields the optimal projection based invariant estimator on setting

for all

. Similarly, the optimal direct invariant estimator is obtained by setting

. Feasible versions can be implemented by using preliminary estimators of

and W. One final point: the diagonal nature of W suggests that asymptotic variance can also be reduced by constructing an estimator based on more than one numeraire. However, because the asymptotic bias

depends upon numeraire choice, such an estimator is not guaranteed to show any improvement in terms of asymptotic mse.
7. CONCLUSION
In this paper we nonparametrically estimate a homogeneous of degree r conditional mean function (f) using local linear estimators. We compare a “projection based” estimator with a more conventional “direct” estimator. Based on our asymptotic results, we recommend the following guidelines when estimating f in practice.
(i) When f is homogeneous of degree r, use a homogeneity constrained estimator as opposed to some unrestricted nonparametric estimator of f. The dimension reduction due to homogeneity allows the constrained estimators to possess faster rates of convergence than the unrestricted estimator.
(ii) Use the projection based approach if

is homogeneous of degree zero. This includes the case when ε is homoskedastic.
(iii) Use the direct approach if

is homogeneous of degree r ≠ 0.
Results of a small simulation experiment support these recommendations although there does not seem to be a big difference in the average mse for the two approaches in (ii) and (iii), at least for the models used in our simulation.
If no prior information is available about the conditional variance function, the best way to proceed may be to first estimate the conditional variance function and then do a weighted local linear regression. In any case, a good empirical practice is to report estimates of f using the projection based, direct, and also the unrestricted local linear estimator of f. A large discrepancy between the reported results may indicate that the homogeneity restriction on f is perhaps misspecified. Based on the degree of divergence a formal test of this misspecification can be constructed following the approach of Härdle and Mammen (1993), although we do not pursue this issue in the current paper.
Finally, the reader should bear in mind that in this paper we have limited our investigations to the case when f is homogeneous of degree r. But as mentioned earlier, in microeconomic theory homogeneity of functional forms is often accompanied by other shape restrictions such as monotonicity and concavity (or convexity). An interesting topic for future research is to find new ways of nonparametrically imposing these additional shape restrictions on functional forms and determine the statistical properties of such shape restricted estimators.
APPENDIX A: TECHNICAL DETAILS— LOCAL LINEAR ESTIMATORS
Proof of Lemma 3.1. (The referee has pointed out that Lemmas 3.1 and 3.2 are special cases of Theorem 2 in Gozalo and Linton (2000). However, as some readers may find it instructive to see a direct proof, we provide one.) Throughout this proof let Q = diags×s [1,an,…,an] and

. Furthermore, we also define

and

. Using this notation, it is straightforward to see that

is the solution to the following weighted least squares problem:

As is well known, the solution to this problem is given by

Let us write

. Straightforward calculations show that we can write S as the partitioned matrix

,

Similarly, we write

. But because

, we can express

, where

Hence letting

, we have that

Let us first look at

. For all

in an an-neighborhood of

, Taylor expand

around

to get

But this implies that

reduces to

Because it is easy to verify that

where Is−1 denotes the (s − 1) × (s − 1) identity matrix, we get that

Let us further simplify the right-hand side of this equation. To do so, first use a law of large numbers to show that

Next, using (A.3), (A.4), and a little matrix manipulation,

Thus letting

, (A.2) reduces to

Now we show that

is asymptotically normal. A straightforward application of the Lindeberg–Lyapunov central limit theorem for triangular arrays and the Cramér–Wold device reveals that under Assumption 2.1(v)

Thus by (A.1), (A.3), (A.6), and Slutsky,

Finally, premultiplying both sides of (A.5) by

and using the fact that the sequence nans+3 is bounded, we have

Therefore, it follows that

But this is the desired result. █
Proof of Lemma 3.2. In the proof of Lemma 3.1, replace xs,jr by 1, yj by yj /xs,jr, and εj by εj /xs,jr. █
APPENDIX B: TECHNICAL DETAILS— KERNEL ESTIMATORS
The following results are essentially an exercise in using the delta method. For examples on the use of the delta method or linearization techniques in nonparametric regression, see Schuster (1972) and Härdle (1989).
LEMMA B.1.

.
Proof of Lemma B.1. Observe that we can write

, where

Then by a Taylor expansion (Assumptions 2.1(iii) and (iv) ensure that the remainder terms in this Taylor expansion are well behaved; we avoid introducing any explicit remainder terms in this analysis as they do not affect the outcome of the paper),

Therefore,

Recall that

lies in the interior of

and that the maps

are twice continuously differentiable at

. By the usual change of variables, we can show that for large enough n

Therefore, substituting these results in equation (B.1) and using the fact that

, a little algebra shows that

LEMMA B.2

.
Proof of Lemma B.2. Similar to the proof of Lemma B.1.
LEMMA B.3.

Proof of Lemma B.3. By a Taylor expansion,

But as

are twice continuously differentiable at

, a change of variables yields that

for large enough n. Because it is easy to see that for any η

the expressions for the bias of

reduce to

Some algebra, and the fact that

, now leads to the desired result. █
LEMMA B.4.

Proof of Lemma B.4. Similar to the proof of Lemma B.3.
References
REFERENCES
Arrow, K.,
H. Chenery,
B. Minhas, &
R. Solow
(1961)
Capital-labor substitution and economic efficiency.
Review of Economics and Statistics
43,
225–250.Google Scholar
Bierens, H.J.
(1985)
Kernel estimators of regression functions. In
W.A. Barnett,
J. Powell, &
G. Tauchen (eds.),
Nonparametric and Semiparametric Methods in Econometrics and
Statistics: Proceedings of the Fifth International Symposium in
Economic Theory and Econometrics, pp.
99–144.
Cambridge, UK:
Cambridge University Press.
Fan, J.
(1992)
Design adaptive nonparametric regression.
Journal of the American Statistical Association
87,
998–1004.Google Scholar
Gallant, A.R.
(1981)
On the bias in flexible functional forms and an essentially
unbiased form: The Fourier flexible form.
Journal of Econometrics
15,
211–246.Google Scholar
Gozalo, P. &
O. Linton
(2000)
Local nonlinear least squares: Using parametric information in
nonparametric regression.
Journal of Econometrics
99,
63–106.Google Scholar
Härdle, W.
(1989)
Applied Nonparametric Regression.
New York:
Cambridge University Press.
Härdle, W. &
O. Linton
(1994)
Applied nonparametric methods. In
R. Engle &
D. McFadden (eds.),
Handbook of Econometrics,
vol. IV, pp.
2295–2339.
Amsterdam:
Elsevier Science B.V.
Härdle, W. &
E. Mammen
(1993)
Comparing nonparametric versus parametric regression fits.
Annals of Statistics
21,
1926–1947.Google Scholar
Hengartner, N.W. &
O.B. Linton
(1996)
Nonparametric regression estimation at design poles and zeros.
Canadian Journal of Statistics
24,
583–591.Google Scholar
Hildreth, C.
(1954)
Point estimates of ordinates of concave functions.
Journal of the American Statistical Association
49,
598–619.Google Scholar
Jones, M.
(1993)
Do not weight for heteroscedasticity in nonparametric regression.
Australian Journal of Statistics
35,
89–92.Google Scholar
Matzkin, R.
(1994)
Restrictions of economic theory in nonparametric methods. In
R. Engle &
D. McFadden (eds.),
Handbook of Econometrics,
vol. IV, pp.
2524–2558.
Elsevier Science B.V.
McFadden, D.L.
(1984)
Econometric analysis of qualitative response models. In
Z. Griliches &
M. Intriligator (eds.),
Handbook of Econometrics,
vol. II, pp.
1396–1457.
Amsterdam:
Elsevier Science B.V.
Pagan, A. &
A. Ullah
(1999)
Nonparametric Econometrics.
New York:
Cambridge University Press.
Petrongolo, B. &
C.A. Pissarides
(2001)
Looking into the black box: A survey of the matching function.
Journal of Economic Literature
39,
390–431.Google Scholar
Ruppert, D. &
M. Wand
(1994)
Multivariate locally weighted least squares regression.
Annals of Statistics
22,
1346–1370.Google Scholar
Ruud, P.A.
(1997)
Restricted least squares subject to monotonicity and concavity
constraints. In
D.M. Kreps &
K.F. Wallis (eds.),
Advances in Economics and Econometrics: Theory and Applications,
Proceedings of the Seventh World Congress,
vol. 3, pp.
166–187.
Cambridge, UK:
Cambridge University Press.
Ryu, H.K.
(1993)
Maximum entropy estimation of density and regression functions.
Journal of Econometrics
56,
397–440.Google Scholar
Schuster, E.F.
(1972)
Joint asymptotic distribution of the estimated regression function
at a finite number of distinct points.
Annals of Mathematical Statistics
43,
84–88.Google Scholar
Tripathi, G.
(2000)
Local semiparametric efficiency bounds under shape restrictions.
Econometric Theory
16,
729–739.Google Scholar
Yatchew, A.
(1988)
Some tests of nonparametric regression models. In
W. Barnett,
E. Berndt, &
H. White (eds.),
Dynamic Econometric Modelling: Proceedings of the Third
International Symposium in Economic Theory and Econometrics, pp.
121–135.
Cambridge, UK:
Cambridge University Press.
Yatchew, A.
(1998)
Nonparametric regression techniques in economics.
Journal of Economic Literature
36,
669–721.Google Scholar
Yatchew, A. &
L. Bos
(1997)
Nonparametric least squares regression and testing in economic
models.
Journal of Quantitative Economics
13,
81–31.Google Scholar
Average mse over grid for Model 1 (Cobb–Douglas)
Average mse over grid for Model 2 (CES)
 You have
Access
- 10
- Cited by