Introduction
One of the key genetic questions about the magmas that produce carbonatites is their original enrichment in alkalis. This has been a subject of scientific debate for more than 30 years (Kapustin, Reference Kapustin Yu1983; Keller, Reference Keller and Bell1989; Gittins, Reference Gittins and Bell1989; Le Bas, Reference Le Bas and Bell1989, Reference Le Bas2008; Dawson, Reference Dawson2008; Guzmics et al., Reference Guzmics, Mitchell, Szabó, Berkesi, Milke and Abart2011, Reference Guzmics, Zajacz, Mitchell, Szabó and Wälle2015, Reference Guzmics, Berkesi, Bodnar, Fall, Bali, Milke, Vetlényi and Szabó2019; Keller and Zaitsev, Reference Keller and Zaitsev2012; Zaitsev et al., Reference Zaitsev, Wenzel, Vennemann and Markl2013; Elliott et al., Reference Elliott, Wall, Chakhmouradian, Siegfried, Dahlgren, Weatherley, Finch, Marks, Dowman and Deady2018). The occurrence of alkali carbonates and alkali-bearing silicates in primary (magmatic) carbonatites provides insight into the role of alkalis in the petrological evolution of these rocks.
Many carbonatites show evidence of extensive hydrothermal reworking and the Lofdal carbonatites are not an exception. During recent years, most interest has been focused on the xenotime-bearing Lofdal carbonatite dykes and fenites as an unusual potential source for heavy rare earth elements (Wall et al., Reference Wall, Niku-Paalova, Storey, Müller and Jeffries2008; Namibia Rare Earths Inc. Reports, 2011−2014; Swinden and Siegfried, Reference Swinden and Siegfried2012; Williams-Jones et al., Reference Williams-Jones, Wollenberg, Bodeving, Simandl and Neetz2015; Bodeving et al., Reference Bodeving, Williams-Jones and Swinde2017). At Lofdal, there is limited information about the largest carbonatite intrusion, the Main Intrusion because it is homogeneous, has a lower rare earth element (REE) content and is characterised by a typical pattern of enrichment in light REE (LREE = La−Nd) compared to carbonatite dykes and Lofdal Area 4, which are enriched in heavy REE (Swinden and Siegfried, Reference Swinden and Siegfried2012; Namibia Rare Earth Inc's report, 2012). In this contribution, we focus on the Main Intrusion to describe and interpret this carbonatite and its REE mineralogy.
The primary rare earth mineral in the calcite carbonatite intrusion is burbankite, a mineral of petrogenetic significance. This typically forms in a magmatic environment or close to the magmatic–hydrothermal transition – carbohydrothermal stage (Zaitsev et al., Reference Zaitsev, Yakovenchuk, Chao, Gault, Subbotin, Pakhomovsky Ya and Bogdanova1996, Reference Zaitsev, Wall and Le Bas1998), although is readily altered, typically leaving pseudomorphs. Burbankite and/or its pseudomorphs have been reported from a number of other carbonatites worldwide (Borodin and Kapustin, Reference Borodin and Kapustin Yu1962; Zdorik, Reference Zdorik1966; Wall and Mariano, Reference Wall, Mariano, Jones, Wall and Williams1996; Zaitsev et al., Reference Zaitsev, Bell, Wall and Le Bas1997, Reference Zaitsev, Wall and Le Bas1998, Reference Zaitsev, Demény, Sindern and Wall2002; Subbotin et al., Reference Subbotin, Voloshin, Pakhomovsky Ya and Bakhchisaraitsev A1999; Wall and Zaitsev, Reference Wall, Zaitsev, Wall and Zaitsev2004; Moore et al., Reference Moore, Chakhmouradian, Mariano and Sidhu2015; Chakhmouradian et al., Reference Chakhmouradian, Cooper, Reguir and Moore2017). Here we report new data on burbankite paragenesis, composition and Raman spectroscopy from the Main Intrusion and one calcite carbonatite dyke at Lofdal.
Materials and methods
Whole-rock geochemistry
Whole-rock geochemical analyses were obtained for six samples to characterise the bulk composition of the calcite carbonatites of the Main Intrusion, the Emanya plug and the coarse-grained calcite carbonatite dyke. The analyses were undertaken at the Federal Institute for Geosciences and Natural Resorces (Bundesanstaldt für Gowissenschaften und Rohstoffe – BGR), Hannover, Germany, analytical laboratory and performed by X-ray fluorescence analysis and inductively coupled plasma mass spectrometry (ICP-MS) techniques. Major- and trace-element concentrations were measured by wavelength-dispersive X-ray fluorescence analysis (WDX) on powdered bulk samples using a Panalytical Axios spectrometer (Panalytical, Almelo, Netherlands). Sample preparation included mixing a pulverised sample with lithium metaborate (Spectroflux, Flux 162 No. 100A, Alfa Aesar) as flux material and melting the mixture into glass beads. The loss on ignition (LOI) was analysed by heating 1 g of sample to 1030°C for 10 minutes. For ICP-MS analysis, ~100 mg of powdered sample was dissolved with 0.5 ml HNO3 plus 2 ml HF. After dissolution, the solutions were evaporated to dryness, then dissolved in HNO3 and aliquots corresponding to 4 mg of sample prepared for ICP-MS measurement. Element concentrations were determined using an Agilent 7500ce instrument equipped with an autosampler (for details, see Estrada et al., Reference Estrada, Henjes-Kunst, Burgath, Roland, Schäfer, Khain and Remizov2012).
Microanalytical methods
Six polished thin sections from Lofdal alkaline carbonatite complex carbonatites were investigated by scanning electron microscope (SEM). Microanalysis on the thin sections was performed using a ZEISS SIGMA 300VP SEM, equipped with a back-scattered electron (BSE) detector and two Bruker XFlash 6|30 energy-dispersive X-ray spectroscopy (EDS) detectors, with 129 eV energy resolution and the ZEISS Mineralogic automated quantitative mineralogy software platform located at BGR, Hannover, Germany. Within each thin section, several areas of interest were selected and imaged to provide a high-resolution mosaic of stitched BSE images. Additionally a quantitative mineralogical analysis was carried out on this region of interest, using Mineralogic software, creating a mineral map with a defined step size as well as a list with parameters for grains in the sample. The acceleration voltage of the primary electron beam was set to 25 kV, to ensure X-ray excitation for all relevant elements (e.g. REE, Sr, Ba). The 120 μm aperture was used to obtain a high input count rate for the EDS detectors, dwell time was 0.01 s, with 10 μm mapping step size and 90x magnification, the montage image consists of 293 single fields. The EDS software is fully integrated with the Mineralogic software. A detailed description of the Mineralogic method is given in Graham and Keulen (Reference Graham and Keulen2019) and Keulen et al. (Reference Keulen, Malkki and Graham2020).
Raman spectroscopy
The investigation of burbankite, carbocernaite, cordylite and ancylite was performed using a Renishaw inVia Qontor confocal micro-Raman system equipped with a Leica DM 2700 microscope with an N plan 100× objective lens with 0.85 numerical aperture, which was used to focus the laser beam and collect scattered radiation from the sample. A continuous wave HeNe laser with a wavelength of 633 nm was used as the excitation source. Unpolarised spectra were recorded by a Renishaw Centrus 1873H8 detector with a charge coupled device (CCD) array of 1040 × 256 pixels using an 1800 lines/mm grating. The spectral resolutions was estimated to be better than 1 cm–1. The instrument was calibrated by automatic alignment procedures of the software WiRE including laser spot correction, CCD area, and slit alignments. The correctness of the calibration was verified with 520.5 cm–1 band of an unprocessed (111) mirror-polished Si standard. All spectra were acquired with an integration time of 20 s and a laser power of 20 mW. Raw spectra were processed by the WiRE software. Thereby, background was subtracted and spikes caused by cosmic ray events were filtered out. The spectral range of the measurements was truncated to an area from 0 to 1300 cm–1, which is relevant to carbonate spectra. The benefit of the spectral reduction is an improved curve fit procedure that avoids high fluorescence spectra from epoxy resin towards higher wavenumbers. Position, intensity and full width at half maximum of the Raman bands were determined using the curve fit function of the software.
SEM with integrated Raman system
The various carbonates and sulfates are indistinguishable when viewed in reflected light mode with the Raman instrument (see description above). To identify the individual constituents of burbankite pseudomorphs, a new technique of combining SEM and BSE imaging with Raman spectroscopy was used. An area of interest was chosen within a BSE image and then specific points within that area were analysed by Raman spectroscopy. The Raman spectra were acquired with a correlative confocal Raman and scanning electron microscope (Sigma 300 RISE) equipped with a piezo scan stage (Wille et al., Reference Wille, Hollricher and Schmidt2018; Schmidt et al., Reference Schmidt, Fitzek, Nachtnebel, Mayrhofer, Schroettner and Zankel2019). The excitation light source was a linear polarised (0°) coherent compass sapphire laser with 532 nm wavelength (WITec, Ulm, Germany) focused through a 100× (NA = 0.75) vacuum objective (Carl Zeiss, Jena, Germany). The laser beam was focused onto the sample surface and generated a Raman signal with spatial resolution of ~ 1 μm. The Raman-scattering signal was collected by the same objective, and detected by an UHTS 300 spectrograph equipped with a diffraction grating of 1200 grooves/mm. The spectral resolution of the instrument is 1 cm–1. The spectrometer was calibrated using a synthetic Si standard. All spectra were acquired with an integration time of 20 s and a laser power of 20 mW. The control FIVE (WITec) acquisition software was used to set experimental parameters for hyperspectral image acquisition and for spectral processing.
Reference spectra of well-characterised samples of burbankite, carbocernaite, parisite, bastnäsite and cordylite from the BGR mineral collection were acquired with the same instrument and stored in the Raman spectra database. Sodium in REE carbonates such as burbankite, carbocernaite, ancylite and cordylite, is challenging to analyse accurately by WDS analysis. EDS is better for analysing sodium, though with this technique it is not trivial to make precise analyses of the minor components (Chakhmouradian et al., Reference Chakhmouradian, Cooper, Reguir and Moore2017). Therefore we checked every grain analysed with the electron microprobe by laser-Raman so that any contaminated compositions can be excluded. The SEM with integrated Raman technique was used as an additional ‘express-method’ for mineral identification.
Electron probe microanalysis (EPMA)
Prior to EPMA, back-scattered electron imaging was used to check the homogeneity of the crystals and locate suitable areas for analysis. The composition of selected minerals was determined on carbon-coated polished thin sections by wavelength-dispersive X-ray spectrometry using CAMECA SX-100 and JEOL JXA-8530F electron microprobes at BGR, Hannover, Germany. The operational settings including acceleration voltage, probe current and other specific parameters (spectral lines, detector crystals, standards and peak counting times) are summarised in the Supplementary material. Relatively low accelerating voltages and probe currents were applied in order to reduce the crystal damage under the electron beam. Additionally, the electron beam was defocused to 10 μm in order to minimise crystal damage and volatility of Na, K and F. Therefore, these elements were quantified prior to the rest of the elements to minimise the effect of volatility. A much larger beam diameter is suggested for REE carbonates, e.g. 20 μm for burbankite (A.N. Zaitsev, personal communication), however this was not realistic in our case because of the small size of the minerals analysed. All elements were calibrated against natural minerals, synthetic materials and pure metals as primary standards (see Supplementary material). Peak interferences were identified on standards measured as unknowns and correction factors were obtained for empirical interference corrections. Detection limits for each element are given for each mineral phase in the respective table of analytical results.
Regardless of all these precautions, uncertainties cannot be avoided during EPMA of carbonates resulting from the inability to measure CO2, the relatively small beam diameter, volatility of alkalis, and high interference corrections (c.f. Zaitsev, Reference Zaitsev, Wall and Le Bas1998; Chakhmouradian and Dahlgren, Reference Chakhmouradian and Dahlgren2021). A detailed description of probe settings can be found in the Supplementary material (see below).
Geology of Lofdal carbonatites
The Lofdal alkaline-carbonatite complex is located 20°21′00″S and 14°45′20″E on the Bergville and Lofdal farms northwest of Khorixas in Damaraland, in the Kunene Region of the Republic of Namibia (Fig. 1). It consists of a swarm of dykes, mainly calcite carbonatite, together with dolomite and ankerite carbonatite dykes and two plugs of calcite carbonatite known as ‘Main’ and ‘Emanya’ carbonatite intrusions. The complex also has many phonolite dykes, plugs of nepheline syenite and syenite and rare mafic rocks. These all intrude into the Huab Metamorphic Complex basement within a NE–SW shear zone over 30 km long. The Lofdal alkaline-carbonatite complex is Neoproterozoic, with a radiometric age of 765 Ma (Wall et al., Reference Wall, Niku-Paalova, Storey, Müller and Jeffries2008; Do Cabo, Reference Do Cabo2014), which is pre-orogenic and related to an intra-continental rift environment (Miller, Reference Miller and Miller2008). Geological and geochemistry reviews of the Lofdal alkaline-carbonatite complex can be found in the literature (Wall et al., Reference Wall, Niku-Paalova, Storey, Müller and Jeffries2008; Do Cabo, Reference Do Cabo2014, Namibia Rare Earths Inc. reports, Bodeving et al., Reference Bodeving, Williams-Jones and Swinde2017).
(a) Simplified geological map of the Lofdal area after unpublished maps of Namibia Rare Earths (Pty) Ltd. and Do Cabo (Reference Do Cabo2014). Insert shows location of the Lofdal Intrusive Suite. (b) Simplified geological map of the Main Intrusion after unpublished maps of Namibia Rare Earths (Pty) Ltd. and DoCabo (2014).

The largest carbonatite intrusion in the Lofdal complex is the calcite carbonatite Main Intrusion (Fig. 1b). This occupies ~4 km2, trends NNW–SSE and intrudes nepheline syenite, forming patches of coarse-grained white calcite carbonatite. Syenitic rocks and coarse polymictic breccias are associated closely with the calcite carbonatite plug. In places the nepheline syenite and carbonatite contacts are sharp with an observed zone of alteration up to tens of metres into the syenites. The other sizable intrusion is the Emanya calcite carbonatite, and although this has been analysed here for comparison of whole-rock composition, the appearance of Emanya, which consists of a dark brown fine-grained mixture of iron oxides with calcite, is an extensively altered, oxidised carbonatite in contrast with the Main Intrusion. Its mineralogy is distinct and neither burbankite nor its pseudomorphs have been found to occur. Hence, these rocks are not described in detail here.
The majority of the phonolite and carbonatite dykes range from a few centimetres to 30 m in width and extend up to 15 km along strike. They crosscut, interfinger, run in parallel with one another, and in places thin out completely, and/or cross-cut other intrusions, mainly the syenites, granites and earlier phonolites. Some dykes are composite, with multiple intrusions of earlier granitic pegmatite, phonolite and carbonatite. In contrast to the coarse-grained white calcite carbonatite dyke investigated, most of the Lofdal carbonatite dykes appear with shades of brown, banding and evidence of sub-solidus alteration. Some of them are so extensively altered that they have been interpreted as hydrothermal veins rather than dykes (Williams-Jones et al., Reference Williams-Jones, Wollenberg, Bodeving, Simandl and Neetz2015). The dyke sample analysed here (Nam-269) is distinct from the xenotime-bearing dykes of Area 4 and consists of white calcite and is more like the Main Intrusion calcite carbonatite. It is situated close to the Main Intrusion (Fig. 1b). Do Cabo (Reference Do Cabo2014) named these kind of dykes, the ‘zero’ dykes because of their affinity to the Main Intrusion.
Geochemistry of Lofdal calcite carbonatites
Two samples from the Main сalcite carbonatite plug, namely sample 08-58, 326 and sample 269 from the ‘zero’ dyke of unaltered calcite carbonatite were analysed for major and trace elements (Table 1). For comparison we also include our geochemical data on the Emanya carbonatite plug (sample 881R, 881G, 949) and on the dykes of Area 4 (samples 927 and 189).
Representative whole-rock major- and trace-element compositions of calcite carbonatites from the Lofdal.

*Detection limit, for example < 2 indicates measurement was below detection limit (d.l.) of 2 ppm.
The carbonatites of the Main Intrusion are classified as calcite carbonatite (CaO/(CaO + MnO + FeO + MgO) ≈0.99 on average). Their FeO content ranges from 1.3 to 9.5 wt.% and their MgO content averages 0.3 wt.%. Significant variation in FeO, Na2O, SiO2 and P2O5, Ba, Sr and Nb (Table 1) results from the variable modal contents of magnetite, aegirine–augite, apatite, phlogopite, pyrochlore and REE-Sr-Ba-carbonates which is, at least in part, due to magmatic flow segregation. The chondrite-normalised REE distribution patterns of the Main Intrusion, Emanya plug and ‘zero’ dyke (Fig. 2a) are characterised by strong LREE enrichment and absence of Eu anomaly. For comparison we provide also patterns for carbonatite dykes of Area 4 which show elevated levels of heavy lanthanides (Fig. 2a).
(a) Chondrite-normalised REE distribution patterns of carbonatites from the Main and Emanya Intrusions. (b–d) Primitive mantle-normalised trace-element distribution patterns of (b) the Main Intrusion carbonatite and ‘zero’ carbonatite dyke; (c) Emanya plug; (d) Carbonatite dykes of Area 4. The primitive mantle values are from Sun and McDonough (1989).

Compared to the alkaline silicate rocks at Lofdal (figure 3 in Bodeving et al., Reference Bodeving, Williams-Jones and Swinde2017, p.389), the carbonatites are depleted in Ta, Pb, Zr and Hf and enriched in Sr and the light REE (Fig. 2b–d). A distinctive geochemical characteristic of the Main Intrusion calcite carbonatites is the relatively low (for Lofdal) average ΣREE concentration 0.1 wt.% (Table 1), and low LREE/HREE ratios of (La/Yb)n of 22–32 compared to all carbonatites worldwide (Woolley and Kempe, Reference Wooley, Kempe and Bell1989). This carbonatite also has the lowest concentrations of other trace elements compared with the other Lofdal carbonatite groups, particularly the high-field-strength elements: Th, U, Nb, Hf and Zr (Fig. 2b–d) and in Do Cabo, (Reference Do Cabo2014). The SrO content ranges between 1.1 to 1.8 wt.%, which represents the highest values at Lofdal.
One of the calcite carbonatite bodies in the dyke swarm (269 – ‘zero’ dyke) exhibits a geochemical pattern very similar to that of the carbonatite of the Main Intrusion (Table 1, Fig. 2a,b). The ΣREE concentration of 0.8 wt.% (Table 1) is slightly higher compared to the Main Intrusion although the (La/Yb)n ratio of 20 is similar to that of the Main Intrusion. The ‘zero’ dyke has higher Ba, Th, Nb, Y, Zn, Zr and Sr concentrations than the Main Intrusion carbonatite.
The Emanya calcite carbonatite is richer in LREE compared with the Main Intrusion carbonatite (Table 1, Fig. 2), although this still has LREE average, minimum and maximum contents within the global values for calcite carbonatite (Woolley and Kempe, Reference Wooley, Kempe and Bell1989). The (La/Yb)n ratios range from 5 to 67. The normalised REE distribution patterns between Tb to Lu exhibit a slightly positive slope compared to those of the Main Intrusion. The different character of the REE distribution is possibly a consequencet of the extensive sub-solidus alteration of the Emanya carbonatite. Emanya has the lowest whole-rock Th contents at Lofdal, between 19 and 80 ppm (av. 50 ppm). The Nb concentration is variable, ranging between 38 and 185 ppm, compared with a Lofdal average value of 112 ppm Nb (Do Cabo, Reference Do Cabo2014).
The xenotime-bearing dykes of Area 4 (samples 189 and 927) are represented by intensively sheared and altered carbonatites with high iron contents and levels of oxidation. These rocks are enriched in the middle REE and high REE (MREE and HREE, respectively), and the dyke REE distribution patterns are characterised by high HREE/LREE ratios (Fig. 2a). The most important characteristic of the rocks is their extremely low LREE concentrations, which are lower than the concentrations in the Main Intrusion although similar to Emanya carbonatites.
In contrast, the concentrations of MREE and HREE exceed the averages for carbonatites, as seen in xenotime-bearing dykes elsewhere at Lofdal (Wall et al., Reference Wall, Niku-Paalova, Storey, Müller and Jeffries2008). The xenotime-bearing dykes have the highest contents of Hf, Th, U and Zr at Lofdal.
Burbankite paragenesis
The burbankite group consists of six mineral species with the general formula А 3В 3(СО3)5 where А = Na > Ca, REE3+, □ (vacancy); B = Sr, Ca, Ba, REE3+, Na giving: burbankite (Na,Ca,□)3 (Sr,REE,Ba,Ca)3(СО3)5, khanneshite (Na,Ca)3(Ba,Sr,REE,Ca)3(СО3)5, calcioburbankite (Na,Ca,REE)3(Ca,REE,Sr)3(СО3)5, remondite-(Ce) Na3(Ce,Ca,Na,Sr)3(СО3)5, remondite-(La) Na3(La,Ce,Ca)3(СО3)5 and petersenite-(Ce) (Na,Ca)4(Ce,La,Sr)2(СО3)5. Burbankite is the most common mineral; other members of the group are rare.
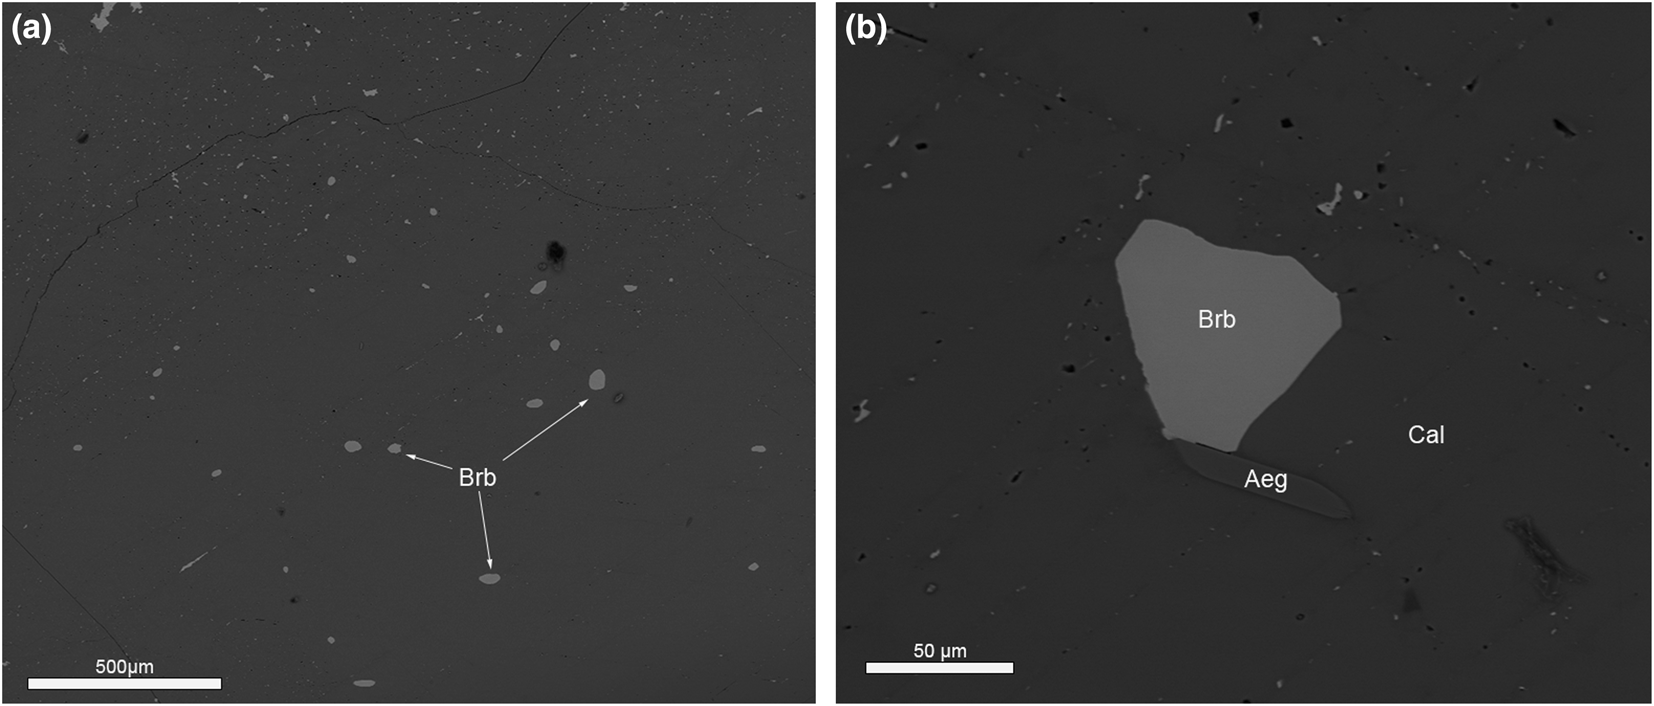
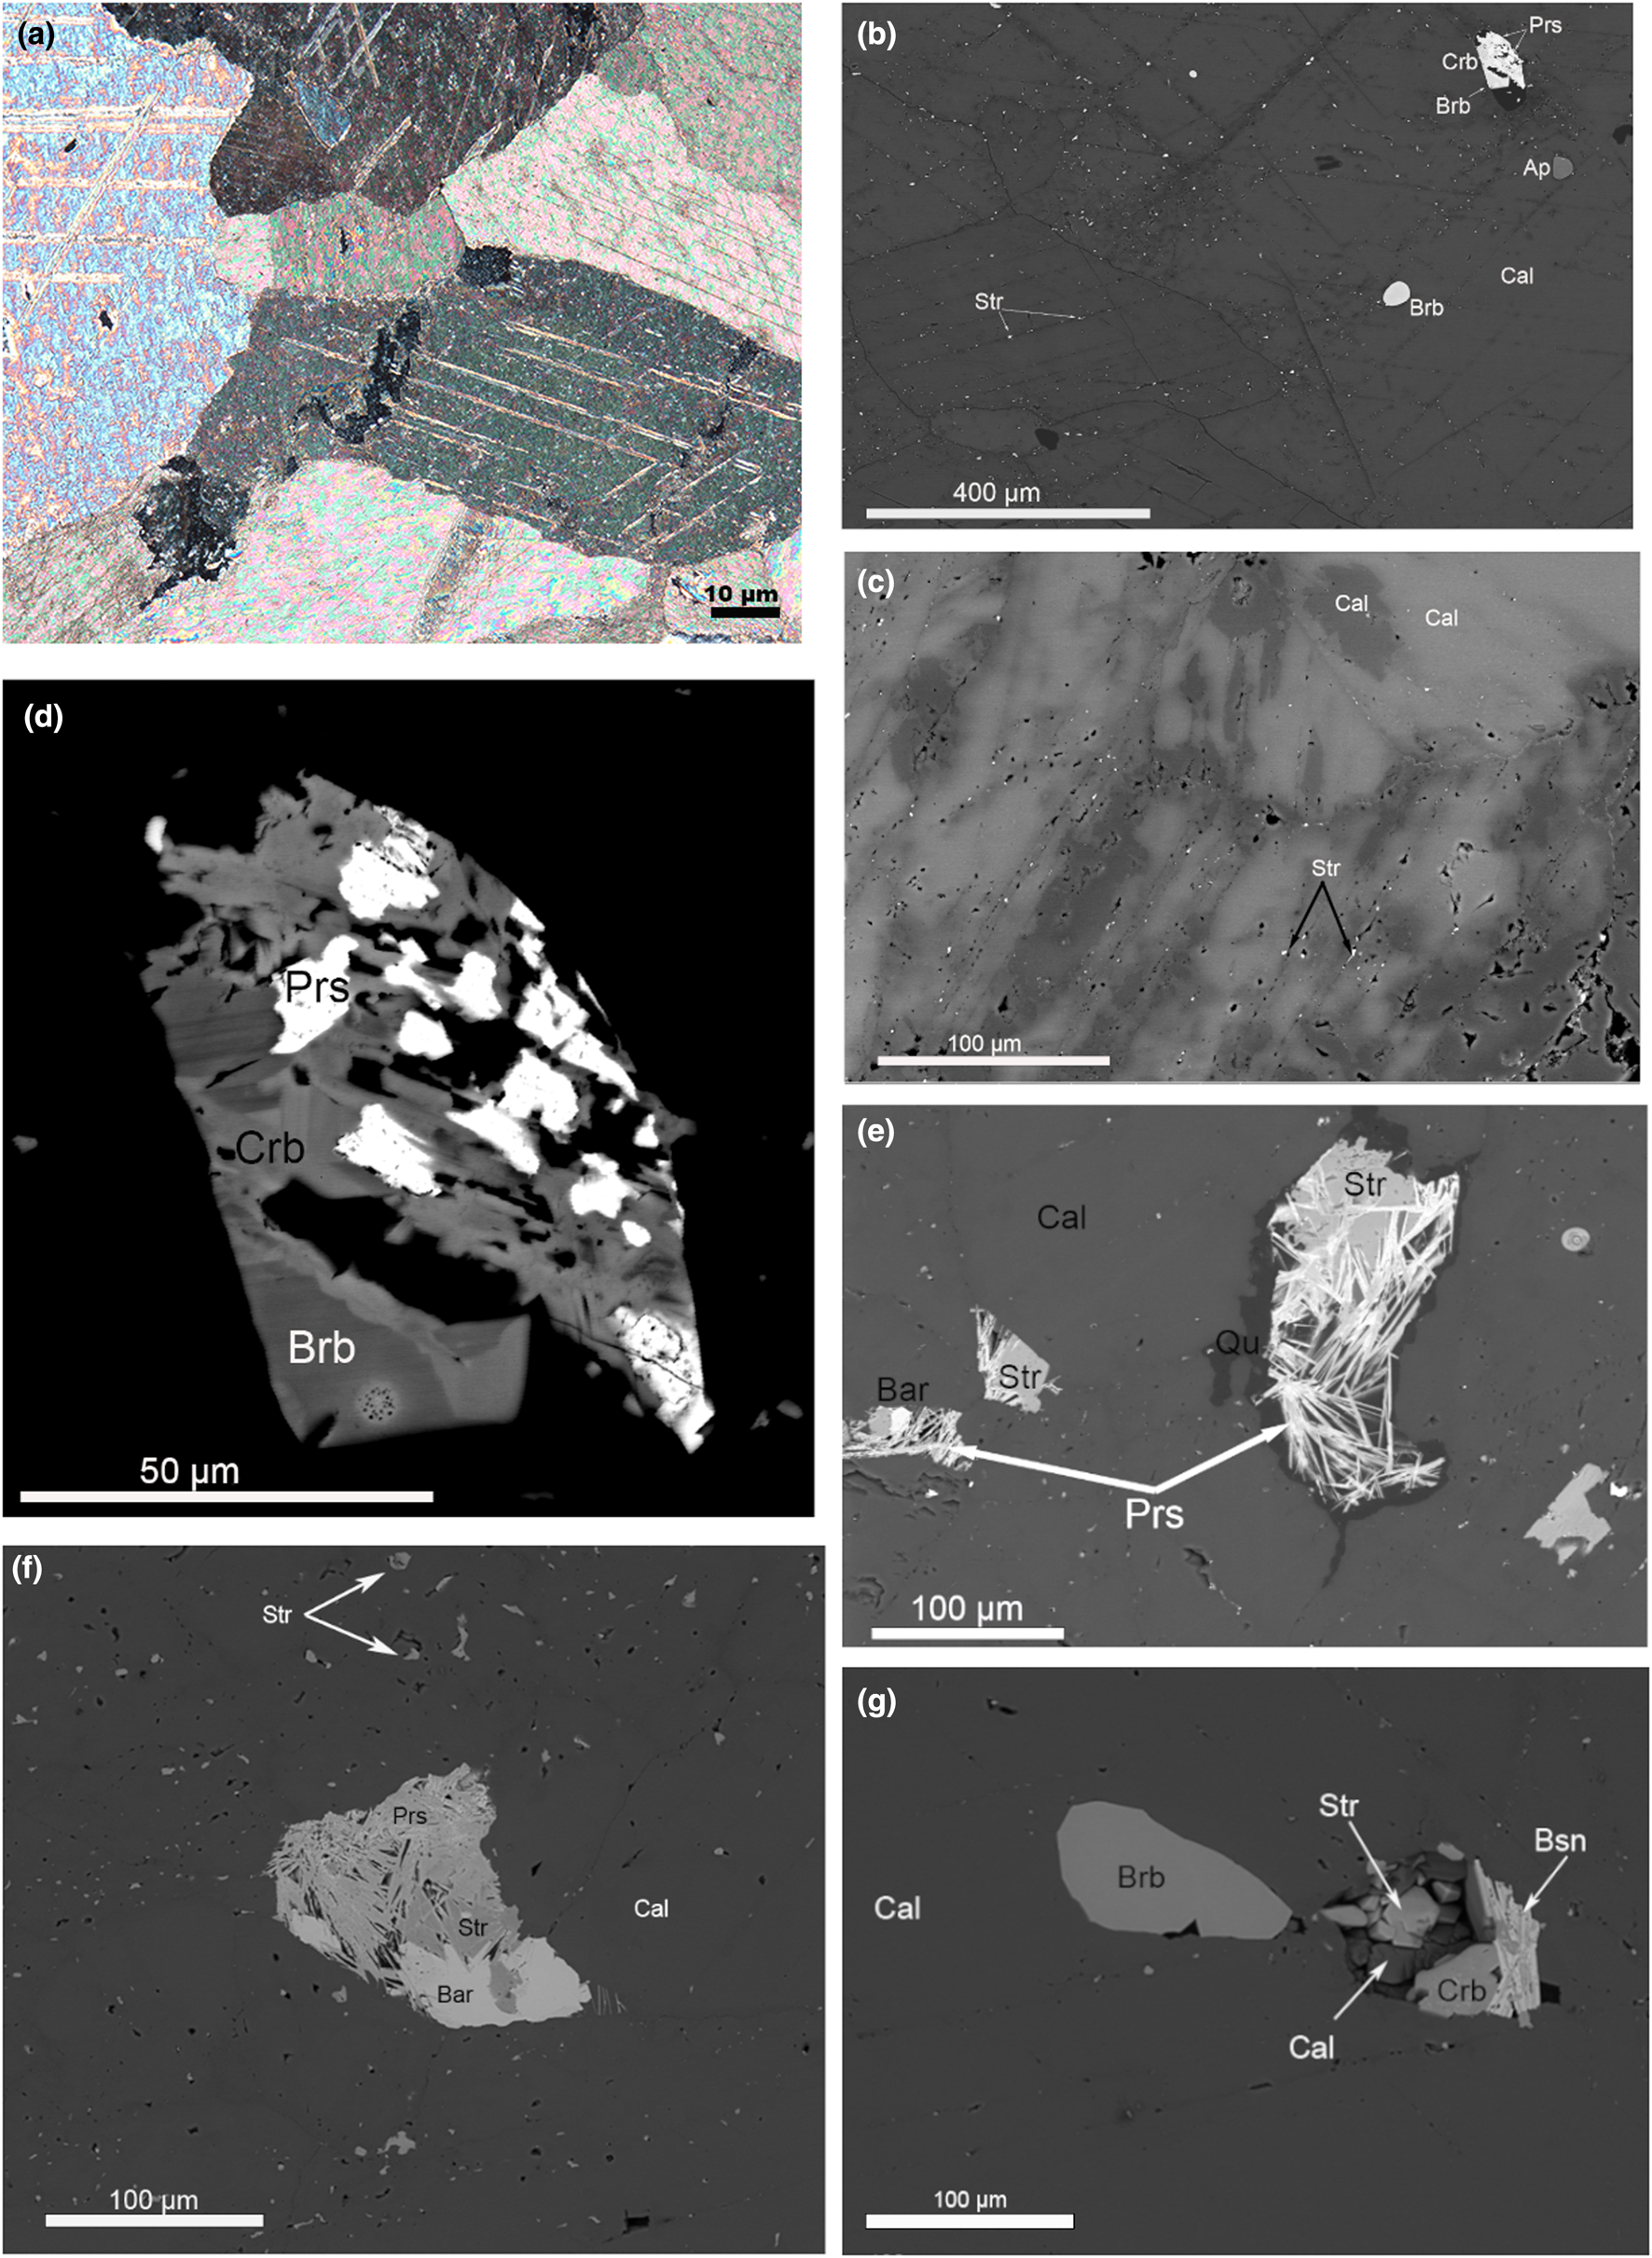
Burbankite was observed in all six samples of the Main Intrusion calcite carbonatite and the ‘zero’ calcite carbonatite dyke at Lofdal alkaline-carbonatite complex. In the Main Intrusion it occurs as small ovoid inclusions (Fig. 3a) or small hexagonal crystals (Fig. 3b) in the core of primary calcite crystals. The burbankite inclusions in coarse-grained primary calcite carbonatite vary from 10 to 100 μm in size (Fig. 3a,b). The calcite crystals (grain size 0.1–0.5 mm) are characterised by polysynthetic twins (Fig. 4a), sharp grain boundaries with no resorption traces and are enriched in Sr (0.8–2.1 wt.% SrO – Table 2). The proportion of burbankite in calcite carbonatite of the Main Intrusion varies from sample to sample from 0.5 to 1 volume percent according to results of automated mineralogical analysis (see Microanalytical methods).
(a) Ovoid primary burbankite (Brb) inclusion in calcite. (b) Hexagonal crystal of burbankite in primary calcite (Cal). Aeg – aegirine. BSE images.

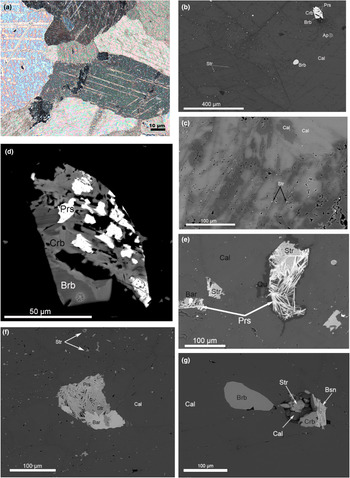
(a) Calcite polysynthetic twins, sharp grain boundaries. Photograph in cross-polarised transmitted light. (b) Strontianite inclusions along cleavage planes of calcite. Dark areas along the cleavage planes are depleted in Sr (Table 2). BSE image. (c) Sr-bearing calcite (bright areas) replaced by Sr-poor calcite along the grain boundaries and cleavage planes (Table 2). BSE image. (d) Burbankite crystal resorbed and replaced by carbocernaite and bastnäsite. BSE image. (e) Dissolution cavity filled with strontianite, baryte, parisite and quartz – full pseudomorph after burbankite. BSE image. (f) Dissolution cavity filled with strontianite, baryte and parisite – full pseudomorph after burbankite. BSE image. (g) Slightly resorbed burbankite crystal and dissolution cavities filled with association of minerals: strontianite, calcite, carbocernaite and bastnäsite. BSE image. Abbreviations: Ap – apatite; Bar –baryte; Brb – burbankite; Bsn – bastnäsite; Cal – calcite; Crb –carbocernaite; Prs – parisite; Qu – quartz; Str – strontianite.
Representative compositions (WDS data) for main rock-forming carbonates in Lofdal calcite carbonatites*.
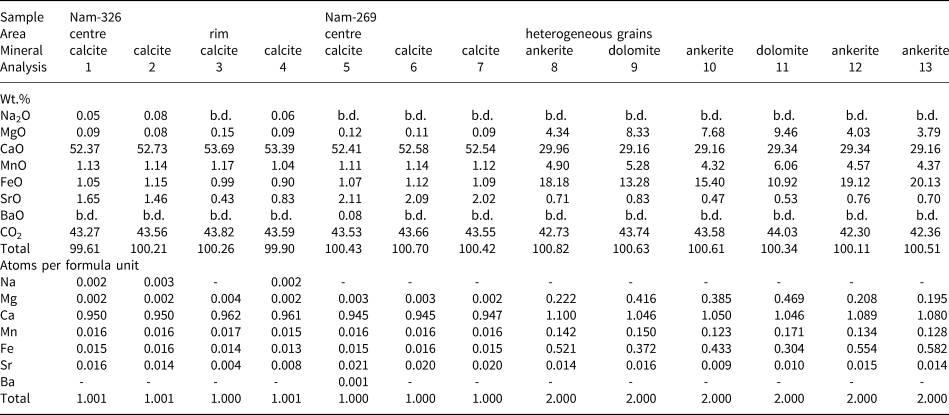
*Sample numbers: Nam-326 – Main Intrusion; Nam-269 – calcite carbonatite ‘zero’ dyke. The minerals were analysed by wavelength-dispersive X-ray spectrometry using JEOL JXA-8530F electron microprobe ( settings in Supplementary material). All Fe expressed as FeO. CO2 was calculated by stoichiometry, b.d. – below detection limit detection limits [ppm]: Na = 329, Mg = 366, Ca = 414, Mn = 638, Fe = 706, Sr = 512, Ba = 558. The proportion of cations was calculated on the basis of 1 (CO3)2– group for calcite and 2 (CO3)2– for dolomite–ankerite.
Locally, some areas of primary calcite have undergone fluid interaction resulting in resorption of the calcite grain boundaries and formation of numerous tiny strontianite inclusions in the outer parts of the calcite crystals, along the grain boundaries and cleavage planes (Fig. 4b). Similar strontianite inclusions, dispersed throughout the peripheral parts of calcite crystals and along cleavage planes, were observed in calcite carbonatite at Fen, Norway (Chakhmouradian and Dahlgren, Reference Chakhmouradian and Dahlgren2021), and interpreted as a product of calcite interaction with fluids (Chakhmouradian et al., Reference Chakhmouradian, Reguir and Zaitsev2016). The composition of calcite at Lofdal changes from high-Sr (bright areas under BSE) in the central parts to low Sr (dark areas under BSE) along the grain boundaries and cleavage planes (Fig. 4c, Table 2). In this mineral association, alteration of burbankite was observed (Fig. 4d) with the crystals being resorbed and replaced by carbocernaite and bastnäsite. Small dissolution cavities and veinlets in calcite carbonatite are commonly filled with an association of the following minerals: strontianite; calcite; carbocernaite; bastnäsite; parisite; baryte; celestine; and rarely with ancylite and monazite (Fig. 4f,g). Cavities are typically filled with quartz (Fig. 4e). The identification of these minerals was made using Raman spectroscopy, EDS and WDS analysis (Tables 3, 4, 5).
Representative compositions (WDS data) for burbankite in Lofdal calcite carbonatites*.

*Sample numbers: Nam-326, Nam-08-98 – Main Intrusion; Nam-269 – ‘zero’ dyke. CO2 was calculated by stoichiometry. Burbankite samples were analysed by wavelength-dispersive X-ray spectrometry using a CAMECA SX-100 electron microprobe (probe settings in Supplementary material). b.d. – below detection, mean detection limits [ppm]: Na = 653, Sr = 369, Ca = 235, La = 619, Ce = 798, Pr = 648, Ba = 437, Nd = 869, Th = 607 and F = 196. Fe, Y, Sm, Gd, U and S were sought, though not detected in any of the grains.
Representative compositions (WDS data) for carbocernaite in Lofdal calcite carbonatites*.

*All Fe expressed as FeO. CO2 was calculated by stoichiometry. Carbocernaite samples were analysed by wavelength-dispersive X-ray spectrometry using a JEOL JXA-8530F electron microprobe (probe settings in Supplementary material). b.d. – below detection limit, mean detection limts [ppm]: Na = 475, Ca = 441, Fe = 868, Sr = 638, Fe = 660, Ba = 781, La = 2309, Ce = 1949, Nd = 1505, Sm = 1246 and F = 987. The proportion of cations are calculated on the basis of 2 (CO3)2– groups.
Representative compositions (WDS data) for cordylite-(Ce) in Lofdal calcite carbonatites*.

*All Fe expressed as FeO. CO2 was calculated by stoichiometry. The cordylite samples were analysed by wavelength-dispersive X-ray spectrometry using a JEOL JXA-8530F electron microprobe (probe settings in Supplementary material). b.d. – below detection limit, mean detection limts [ppm]: Na = 301, Ca = 227, Fe = 829, Sr = 228, Y = 350, Ba = 507, La = 1167, Ce = 1124, Nd = 1219, Sm = 1018, Gd = 761, Th = 527, U = 429, F = 574 and S = 430. The proportion of cations are calculated on the basis of 4 (CO3)2– groups.
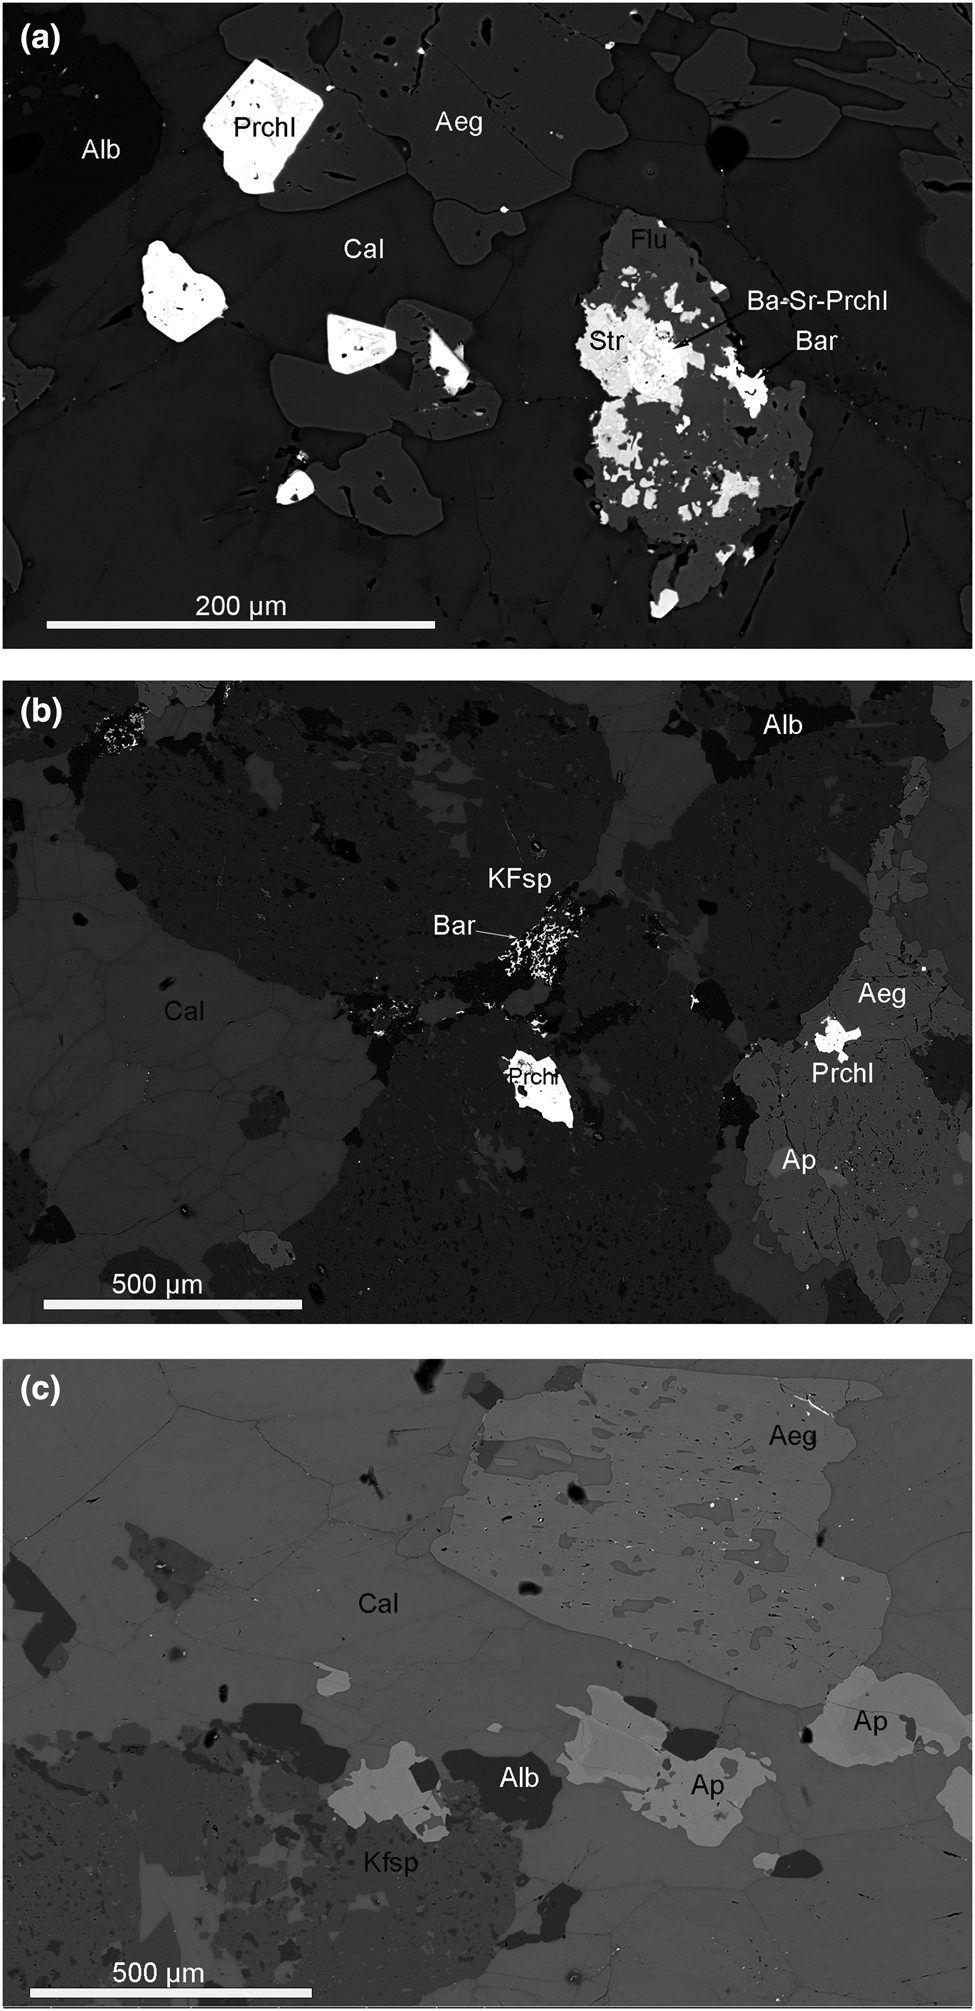
Calcite carbonatite of the Main Intrusion close to the contact zone with nepheline syenites is enriched in aegirine–augite, K-feldspar, fluorapatite, albite and fluorite (Fig. 5). Along grain boundaries and cleavage planes the calcite in this association has undergone some chemical alteration and has lost Sr (Table 2, an. 3, 4). Aegirine–augite and K-feldspar occur as poikilitic crystals with numerous calcite inclusions, typically intergrown with pyrochlore and zircon. Sr-Ba-bearing pyrochlore is intergrown with strontianite, fluorite and baryte. Fine-grained baryte aggregates are observed interstitial to albite grains (Fig. 5). These textural observations can be used to suggest that the interaction of calcite carbonatite and nepheline syenite results in fluid alteration of the primary calcite and possibly released elements such as Sr, Ba, REE and Fe to form the secondary phases: strontianite, REE-fluorcarbonates, Ba-Sr-bearing pyrochlore, baryte and celestine.
(a) Aegirine–augite (Aeg), albite (Alb) and fluorite (Flu) in calcite carbonatite close to the contact with nepheline syenite. Alteration of calcite (Cal) along grain boundaries and cleavage planes. Aegirine–augite contains pyrochlore (Prchl) inclusions. Ba-Sr-bearing Pyrochlore (Ba-Sr-Prchl) intergrowths with strontianite (Str), fluorite and baryte (Bar) in late subsolidus association. BSE image. (b) Poikilitic inclusions of calcite in aegirine–augite and K-feldspar (KFsp) crystals. Aegirine–augite and K-feldspar contain pyrochlore and apatite (Ap) inclusions. Fine-grained baryte aggregates interstitial between albite grains. BSE image. (c) Poikilitic crystals of aegirine–augite, K-feldspar with calcite inclusions in association with zoned fluorapatite and albite in calcite carbonatite. BSE image.
In the calcite carbonatite ‘zero’ dyke (sample 269), burbankite always occurs as resorbed relicts (50–100 μm in size) in the central part of polymineralic pseudomorphs (Fig. 6a–c). The pseudomorphs after burbankite in the dyke are complex. We have established several distinct assemblages of secondary minerals within pseudomorphs: (1) carbocernaite + strontianite + ancylite-(Ce) + baryte + barytocalcite + cordylite-(Ce); (2) ancylite-(Ce) + celestine + cordylite-(Ce); (3) ancylite-(Ce) + strontianite + baryte; (4) parisite-(Ce) + strontianite + baryte; and (5) parisite-(Ce) + celestine (Fig. 6a–c). All stages of burbankite alteration have been observed – from slightly resorbed burbankite crystals, replaced by carbocernaite (Fig. 4d) to thin rims of ancylite + strontianite mixture that penetrated into burbankite crystals (Fig. 6a) to full hexagonal pseudomorphs with a cavernous structure (Fig. 6b–c).
(a) Hexagonal polymineralic pseudomorphs after burbankite. Resorbed relict of burbankite (Brb) replaced by ancylite (Anc) and strontianite (Str). The pseudomorphs are associated with calcite (Cal), magnetite (Mgt), fluorite, phlogopite (Phl), fluorapatite (Ap), ankerite (Ank). BSE image. (b) Complex polymineralic pseudomorphs after burbankite (Brb): the last one is replaced by carbocernaite (Crbc), strontianite (Str), ancylite (Anc) and overgrown with cordylite (Crd). BSE image. (c) Full pseudomorph after burbankite: celestine (Cell), ancylite (Anc), bastnäsite (Bsn), cordylite (Cord). BSE images.

The pseudomorphs after burbankite in the ‘zero’ carbonatite dyke are observed in the following paragenesis: calcite; magnetite with ilmenite exsolutions; fluorite; phlogopite; fluorapatite; dolomite–ankerite. A banded texture is clearly observed in this carbonatite type (Fig. 7a). In areas close to the pseudomorphs, the rock-forming calcite has been altered, and has irregular patches of low-Sr secondary calcite replacing primary high-Sr calcite (as on Fig. 4c) together with dolomite–ankerite crystals (Fig. 7b). Such banded textures suggest fluid alteration of primary calcite carbonatite. This fluid according to the new mineral assemblage in the bands, was rich in F–, K+, Mg2+, PO43–, Ba2+ and SO42–. A simplified paragenetic sequence for Lofdal calcite carbonatites is shown on Fig. 8.
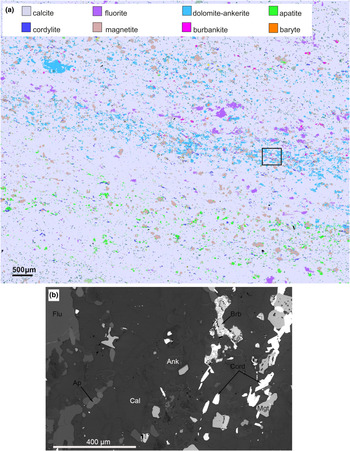
(a) Modal mineralogy of calcite carbonatite with pseudomorphs after burbankite (sample Nam-269). For colour-codes see the legend. Note the banded texture of the carbonatite and the association of dolomite–ankerite and fluorite with pseudomorphs after burbankite. Mineral-distribution map from BSE-EDS using Mineralogic (Zeiss). The black frame indicates the area in (b), shown in BSE. The area shows the appearance of ankerite (Ank) crystals close to pseudomorphs after burbankite (Brb). Mgt – magnetite, Flu – fluorite, Ap – apatite, Cal – calcite, Cord – cordylite.

Simplified paragenetic sequence of the Lofdal calcite carbonatite.

Burbankite composition
All microprobe analyses of burbankite were recalculated on the basis of 5 (CO3)2– groups. Generally, the microprobe analysis produced good stoichiometric compositions for burbankite, with no deficiency in the A site (Wall and Zaitsev, Reference Wall, Zaitsev, Wall and Zaitsev2004). Effenberger et al. (Reference Effenberger, Kluger, Paulus and Wolfel1985), Belovitskaya et al. (Reference Belovitskaya Yu, Pekov and Kabalov Yu2000) and Belovitskaya and Pekov (Reference Belovitskaya Yu and Pekov2004) suggest that there is an A-site cation deficiency, though this is also exactly the effect produced by Na migration during EPMA, to which burbankite is particularly sensitive. However, by comparing our results with published data, we can conclude that our microprobe analyses do not suffer from the effect of Na migration.
Burbankite compositions containing 0.7–1.5 atoms per formula unit (apfu) Sr and 0.4–1.0 apfu Ba in the B site together with 0.0–1.0 apfu Ca and 0.5–0.8 apfu REE are typical for carbonatite complexes (Belovitskaya and Pekov, Reference Belovitskaya Yu and Pekov2004). Most of the Lofdal burbankite corresponds to burbankite sensu stricto (Table 3). There is one clear compositional trend; burbankite from the pseudomorphs is more enriched in Ba compared to burbankite from primary inclusions in calcite (Fig. 9a, Table 3). The maximum Ba content is 11.48 wt.% BaO (0.495 apfu) from pseudomorphs and the minimum content is 1.99 wt.% BaO (0.100 apfu) from inclusions. Other elements show minor variations within Lofdal burbankite (Fig. 9b,c), however no obvious compositional trend between inclusions and pseudomorphs can be observed. Comparison of the Lofdal burbankite compositions with burbankite from other localities (Fig. 9) shows that all of the Lofdal compositions are intermediate within the field of published data available for burbankite from carbonatites (Subbotin et al., Reference Subbotin, Voloshin, Pakhomovsky Ya and Bakhchisaraitsev A1999, Wall and Zaitsev, Reference Wall, Zaitsev, Wall and Zaitsev2004, Chakhmouradian and Dahlgren, Reference Chakhmouradian and Dahlgren2021).
Compositional variation of Lofdal burbankite inclusions (red circles) and relicts of burbankite from the pseudomorphs (blue circles) compared to available published data (green circles) for burbankite from carbonatites (Subbotin et al., Reference Subbotin, Voloshin, Pakhomovsky Ya and Bakhchisaraitsev A1999, Wall and Zaitsev, Reference Wall, Zaitsev, Wall and Zaitsev2004, Chakhmouradian and Dahlgren, Reference Chakhmouradian and Dahlgren2021 and the authors unpublished data on burbankite from Cerro-Sapo, Bolivia).

Carbocernaite replaces burbankite in dissolution cavities, veinlets and in pseudomorphs and is characterised by a homogeneous composition (Table 4), similar to the compositions reported for this mineral worldwide (Wall et al., Reference Wall, Le Bas and Srivastava1993; Zaitsev et al., Reference Zaitsev, Wall and Le Bas1998; Wall and Zaitsev, Reference Wall, Zaitsev, Wall and Zaitsev2004; Chakhmouradian et al., Reference Chakhmouradian, Cooper, Reguir and Moore2017).
The composition of cordylite is shown in Table 5. Ba-REE-fluorocarbonates are rare in carbonatites and WDS analyses for cordylite have been reported from just a few localities: Khibiny, Kola Peninsula, Russia; Wicheeda, British Columbia; Palabora, South Africa; and Montviel, Abitibi, Canada (Zaitsev et al., Reference Zaitsev, Wall and Le Bas1998; Dalsin et al., Reference Dalsin, Groat, Creighton and Evams2015; Nadeau et al., Reference Nadeau, Cayer, Pelletier, Stevenson and Jébrak2015; Giebel et al., Reference Giebel, Gauert, Marks, Costin and Markl2017). Cordylite from Lofdal is characterised by similar variations in composition to cordylite from these four localities and corresponds to cordylite-(Ce). In dolomite carbonatite of Biraya, East Siberia La-dominated cordylite appears as a rock-forming mineral (Mills et al., Reference Mills, Kartashov, Kampf, Konev, Koneva and Raudsepp2012).
Raman spectroscopy
The minerals visible on BSE images (Fig. 6b) were investigated using Raman spectroscopy. Raman micro-spectroscopy can be used for identification of carbonates with a spatial resolution of ~1 μm (Herman et al., Reference Herman, Bogdan, Sommer and Simpson1987), hence the components of the polymineralic pseudomorphs (Fig. 6a–c) could be distinguished successfully even though they have a small grain size (Fig. 10b). Burbankite, carbocernaite, strontianite, ancylite, cordylite, baryte and barytocalcite were identified by comparison with spectra of well-characterised mineral reference materials from the BGR mineral collection and published Raman spectra (Fig. 10a–c).
(a) Representative Raman spectra of burbankite inclusions and relics in pseudomorphs from Lofdal and reference material from Khibiny, Kola Peninsula. (b) Representative Raman spectra of burbankite, ancylite-(Ce), cordylite-(Ce) and carbocernaite from the pseudomorphs after burbankite, Lofdal, Namibia, (c) Representative Raman spectra of carbocernaite from the pseudomorphs after burbankite, Lofdal, Namibia. The intensity difference of the triple peak at ~1080 is probably caused by variation of composition (Table 4, an. 6, 8). All Raman spectra were measured with a 633 nm laser.

Raman micro-spectroscopy is also especially helpful to differentiate between burbankite and carbocernaite (Moore et al., Reference Moore, Chakhmouradian, Mariano and Sidhu2015; Chakhmouradian et al., Reference Chakhmouradian, Cooper, Reguir and Moore2017; Chakhmouradian and Dahlgren, Reference Chakhmouradian and Dahlgren2021). Burbankite inclusions from primary calcite carbonatite of the Main Intrusion, resorbed grains and relicts of burbankite from the pseudomorphs as well as all replacement phases after burbankite were examined by Raman spectroscopy using the same instrumental parameters (see above). All Raman measurements of the Lofdal burbankite samples and comparison with reference REE carbonates from the authors’ own and BGR collections show that the ovoid inclusions, hexagonal crystals and relicts of precursor mineral in the hexagonal pseudomorphs are identical to well-characterised burbankite from Khibiny, Kola Peninsula, Russia (Fig. 10a). All six samples of Lofdal burbankite measured with a 633 nm laser produced Raman spectra with several consistent features: an intensive symmetric C–O stretching mode – the peak at 1080 cm–1, weak out-of-plane and in-plane C–O bending signals at 860–875 and 695–714, respectively, and weak asymmetric C–O bending and lattice mode between 150 and 280 cm–1. The same peaks were also observed in burbankite from Khibiny (our unpublished data) and from Fen, Norway (Chakhmouradian and Dahlgren, Reference Chakhmouradian and Dahlgren2021). Carbocernaite and burbankitehave similar compositions but can be distinguished easily by their Raman spectra using the split peak between ~1070 and 1100 cm–1 in the carbocernaite spectrum. This carbocernaite feature was first reported from Bear Lodge carbonatites, Wyoming, USA (Chakhmouradian et al., Reference Chakhmouradian, Cooper, Reguir and Moore2017). We have compared the carbocernaite Raman spectra from Lofdal with the spectra of the Bear Lodge specimen. The split peak at ~1071, 1087 and 1097 cm–1 is present in both spectra. The different intensities of the two sides of the split peak are probably related to the variable compositions of carbocernaite at Lofdal (Table 4, an. 6, 8 and Fig. 10c).
Discussion
Burbankite-group minerals occur in different types of rocks: carbonatites; alkali-carbonate-bearing hydrothermal veins; and in natrolite–microcline or pectolite–natrolite-feldspar veinlets in nepheline syenites and melteigite–urtite (Zaitsev et al., Reference Zaitsev, Wall and Le Bas1998; Subbotin et al., Reference Subbotin, Voloshin, Pakhomovsky Ya and Bakhchisaraitsev A1999; Wall and Zaitsev, Reference Wall, Zaitsev, Wall and Zaitsev2004; Yakovenchuk et al., Reference Yakovenchuk, Ivanyuk G, Pakhomovsky Ya, Menshikov Yu and Wall2005; Moore et al., Reference Moore, Chakhmouradian, Mariano and Sidhu2015; Chakhmouradian et. al., 2017). In carbonatites the burbankite-group minerals are usually early phases formed at high-temperatures, whereas in nepheline syenites they are formed during hydrothermal stages at low temperatures, representing different CO2 regimes (Belovitskaya and Pekov, Reference Belovitskaya Yu and Pekov2004).
In carbonatite complexes, three burbankite-group minerals, burbankite, calcioburbankite and khanneshite have been reported. Both burbankite and calcioburbankite have been reported in early calcite carbonatites as well as in late hydrothermal–metasomatic dolomite–calcite carbonatites (Subbotin et al., Reference Subbotin, Voloshin, Pakhomovsky Ya and Bakhchisaraitsev A1999).
Khanneshite has been reported from the Afrikanda complex, Kola Peninsula, Russia (Zaitsev and Chakhmouradian, Reference Zaitsev and Chakhmouradian2002); the Khanneshin carbonatite, southern Afghanistan (Tucker et al., Reference Tuckler, Belkin, Schultz, Peters, Horton, Buttlemann and Scott2012); and Khibiny carbonatites, Kola Peninsula (Pekov et al., Reference Pekov, Chukanov and Belovitskaya Yu1998). Primary burbankite has been described in a few carbonatite complexes worldwide (Zaitsev et al., Reference Zaitsev, Bell, Wall and Le Bas1997, Reference Zaitsev, Wall and Le Bas1998, Reference Zaitsev, Demény, Sindern and Wall2002; Wall et al., Reference Wall, Zaitsev and Mariano2001; Chakmouradian et al., Reference Chakhmouradian, Reguir and Zaitsev2016; Chakhmouradian and Dahlgren, Reference Chakhmouradian and Dahlgren2021). Burbankite together with other Na-bearing carbonates was reported as primary inclusions in rock-forming minerals (magnetite and apatite) in carbonatites from Afrikanda and Sallanlatvi in the Kola Peninsula (Zaitsev and Chakhmouradian, Reference Zaitsev and Chakhmouradian2002; Zaitsev et al., Reference Zaitsev, Sitnikova, Subbotin, Fernández-Suárez, Jeffries, Wall and Zaitsev2004). Examples of fresh burbankite and polymineralic pseudomorphs were described by Zaisev et al. (Reference Zaitsev, Demény, Sindern and Wall2002) who provided isotopic evidence that burbankite crystallised from a primary, alkali-rich carbonatite melt. Blebs in rock-forming carbonate have been reported by Wall (Reference Wall and Vladykin2004) and Chakhmouradian and Dahlgren (Reference Chakhmouradian and Dahlgren2021).
Bühn et al. (Reference Bühn, Rankin, Radtke, Haller and Knöchel1999) detected burbankite in fluid inclusions within quartzite related to the Kalkfeld carbonatite complex, Namibia. They proposed that this burbankite had crystallised directly from an alkali-rich carbonatite melt before alkalis were lost during wall-rock fenitisation. Dowman et al. (Reference Dowman, Wall, Treloar and Rankin2017) found burbankite in fluid inclusions in quartz from fenite around the Chilwa Island carbonatite, Malawi and interpreted this as evidence of REE fluid mobility in the fenitising solutions.
Anenburg et al. (Reference Anenburg, Mavrogenes, Frigo and Wall2020) found that burbankite-group minerals crystallised at the transition between igneous carbonate and fluid in experiments with Na and REE-bearing carbonatite compositions. This timing of burbankite formation is consistent with many observations, although these experiments did not produce blebs or crystals of burbankite in calcite. Possible explanations are that the crystallisaton of the calcite carbonatite was a closed system trapping the burbankite, or that with different conditions, such as lower water content but still high sodium, burbankite will crystallise earlier during the magmatic stage.
The interpreted paragenetic sequence for the Lofdal calcite carbonatites in Fig. 8 demonstrates the role of burbankite, high-Sr calcite, magnetite, ilmenite, apatite, pyrochlore, aegirine, K-feldspar and zircon as early magmatic phases. In the transition from magmatic to carbohydrothermal activity burbankite is replaced by carbocernaite and parisite (Fig. 4d). The degree of alteration ranges from a partial replacement to complete pseudomorphs with no relict fragments of burbankite (Fig. 4e,f). Carbocernaite relict grains also occur in peripheral parts of the pseudomorphs (Fig. 6b). The transition environment is interpreted similarly to the magmatic–hydrothermal transition observed in granite systems (e.g. Audétat et al., Reference Audétat, Gunther and Heinrich2000, Halter and Webster, Reference Halter and Webster2004). Strontianite, low-Sr calcite, phlogopite, rutile, barytocalcite, pyrite and monazite continued to crystallise in the transitional environment. Burbankite may be destabilised when fluids exsolve from the magma and the most soluble components, notably Na, are dissolved away. These fluids react with previously crystallised material, producing pseudomorphs (Wall, Reference Wall and Vladykin2004). Thus at the carbohydrothermal stage, burbankite was replaced by bastnäsite, parisite, ancylite, strontianite, celestine, baryte and cordylite with the appearance of abundant dolomite–ankerite, phlogopite, fluorite and rare quartz.
Pseudomorphs after burbankite, similar to those in Khibiny carbonatites, have been reported from several carbonatite localities: Gornoe Ozero in East Siberia (Zdorik, Reference Zdorik1966); Vuorijarvi, Kola Peninsula (Kapustin, Reference Kapustin Yu1980; Subbotin et al., Reference Subbotin, Voloshin, Pakhomovsky Ya and Bakhchisaraitsev A1999, Wall and Zaitsev, Reference Wall, Zaitsev, Wall and Zaitsev2004); and Bear Lodge (Moore et al., Reference Moore, Chakhmouradian, Mariano and Sidhu2015; Chakhmouradian et al., Reference Chakhmouradian, Cooper, Reguir and Moore2017). In these localities the evidence for the late-stage subsolidus origin of ancylite and synchysite after burbankite are the complete hexagonal pseudomorphs and abundant relict grains of burbankite in mineral intergrowths. Similar pseudomorphs, interpreted as produced by a volume-for-volume replacement mechanism (Zaitsev et al., Reference Zaitsev, Wall and Le Bas1998, Zaitsev et al., Reference Zaitsev, Demény, Sindern and Wall2002) are found at Lofdal. We agree with Wall and Mariano (Reference Wall, Mariano, Jones, Wall and Williams1996), Zaitsev et al. (Reference Zaitsev, Wall and Le Bas1998) and Wall et al. (Reference Wall, Zaitsev and Mariano2001) that replacement of burbankite and the formation of hexagonal pseudomorphs with a cavernous structure involves a late-stage reaction between water-bearing fluids and burbankite. Such hexagonal LREE-Sr-Ba-rich pseudomorphs were observed in several carbonatite localities though commonly without relict fragments of a precursor mineral; for example at Kangankunde, Malawi and Sallanlatvi, Kola Peninsula (Wall and Mariano, Reference Wall, Mariano, Jones, Wall and Williams1996; Zaitsev et al., Reference Zaitsev, Sitnikova, Subbotin, Fernández-Suárez, Jeffries, Wall and Zaitsev2004). The absence of a precursor mineral in the pseudomorphs probably can be explained by the susceptibility of burbankite to hydrothermal alteration such that the burbankite was altered completely to the new LREE-Sr-Ba-mineral association as a result of re-working of primary carbonatite with the hydrothermal fluid (Wall and Mariano, Reference Wall, Mariano, Jones, Wall and Williams1996). In Sallanlatvi, burbankite was found in fluid inclusions within magnetite in calcite carbonatites (Zaitsev et al., Reference Zaitsev, Sitnikova, Subbotin, Fernández-Suárez, Jeffries, Wall and Zaitsev2004).
The observed textures of Lofdal calcite carbonatites from the Main Intrusion (Fig. 3, 4) are interpreted as igneous textures (Chakmouradian et al., Reference Chakhmouradian, Reguir and Zaitsev2016). Burbankite inclusions in the calcite carbonatite are abundant and make up to 0.5 vol.% of the modal mineralogy of the rock. The distribution of burbankite ovoid inclusions and hexagonal crystals in the calcite matrix is not controlled crystallographically, nor confined to cleavage planes or fractures. The surrounding calcite is enriched in Sr (up to 2.11 wt.% SrO, Table 2) and there is no evidence of calcite or burbankite recrystallisation in this type of rock. All these compositional and textural features of Lofdal calcite carbonatites argue that burbankite has been formed syngenetically with its host carbonate at the early stage of carbonatite evolution. The early crystallisation of burbankite provides evidence that the carbonatitic magma was enriched in Na, Sr, Ba and LREE.
The isotopic characteristics of calcite carbonatite of the Lofdal Main Intrusion indicate that the source of the carbonatitic magma was in Enriched Mantle I reservoir (Bell and Blenkinsop, Reference Bell and Blenkinsop1987; Bell and Tilton, Reference Bell and Tilton2001). The initial 87Sr/86Sr ratio of calcite carbonatite is 0.70274 and the initial 143Nd/144Nd ratio is 0.512227 with εNdt of 2.4 (whole-rock data for sample 08-58 – calcite carbonatite with burbankite inclusions – from Do Cabo et al., Reference Do Cabo, Wall, Sitnikova, Ellmies, Henjes-Kunst, Gerdes and Downes2011). Carbon and oxygen isotopic compositions of the same sample: (δ13CV-PDB = –5.72‰, δ18OV-SMOW = 5.58‰) plot in the primary carbonate field proposed by Keller and Zaitsev (Reference Keller and Zaitsev2006) and thus support our interpretation.
Carbonatites are more likely than silicate rocks to be susceptible to subsolidus alteration and, hence, few of these rocks retain their magmatic characteristics (Chakhmouradian et al., Reference Chakhmouradian, Reguir and Zaitsev2016, p. 337). The carbonatites of the Lofdal Main Intrusion are no exception to this observation as at least some areas of the carbonatites have undergone this style of alteration. We have observed local replacement textures of primary calcite carbonatites (e.g. sample 326, 269). Calcite in the peripheral parts of the crystals and along cleavage planes is characterised by lower Sr contents and appearance of numerous tiny strontianite grains along fluid passageways – cleavage planes or fractures, and along grain boundaries (Fig. 4b). The common presence of the REE hydrocarbonate–ancylite–sulfates (baryte and celestine), in this paragenesis are clear indications of fluid involvement (Cooper et al., Reference Cooper, Collin, Palin and Sprat2015).
Significant variations in Sr or REE between burbankite inclusions and burbankite from the pseudomorphs were not detected. The fact that burbankite from the pseudomorphs is more enriched in Ba compared to burbankite from primary inclusions in calcite (Fig. 9a, Table 3) contradicts the observation for burbankite in Bear Lodge (Moore et al., Reference Moore, Chakhmouradian, Mariano and Sidhu2015, p.514) where the early burbankite is more enriched in Ba than the late variety.
It is known that burbankite is not a stable mineral. With decreasing alkalinity it becomes unstable and at hydrothermal conditions it is easily replaced by a whole series of secondary minerals, such as alkali-free carbonates of REE, Sr, Ba and Ca (Belovitskaya and Pekov, Reference Belovitskaya Yu and Pekov2004 and references therein). This is consistent with our observations: alteration of the primary burbankite into secondary carbocernaite, appearance of hexagonal pseudomorphs with different mineral composition: ancylite, strontianite, baryte, celestine, parisite and numerous dissolution cavities with similar mineral assemblages ± quartz. All these observed alterations indicate changes in the alkalinity regime of the evolved carbo-hydrothermal fluid due to the loss of Na, probably to fenite aureoles. There are abundant albitites in Area 4 at the contact of carbonatite dykes and alkaline rocks at Lofdal (Williams-Jones et al., Reference Williams-Jones, Wollenberg, Bodeving, Simandl and Neetz2015). As a result, we observe replacement of burbankite with the new REE-Sr-Ba-bearing mineral assemblage. In fenitisation, the fluids released from the cooling magma migrate through the crystallised surrounding rocks, causing intense metasomatic reactions, hydrothermal alteration, mobilisation of rare earth and high-field-strength elements and formation of secondary mineral assemblages at the expense of the original minerals (Broom-Fendley et al., Reference Broom-Fendley, Brady, Wall, Gunn and Dawes2017; Zaitsev et al., Reference Zaitsev, Demény, Sindern and Wall2002). Thus, the growth of the new REE-Sr-Ba-bearing mineral assemblage probably resulted from the breakdown of magmatic minerals calcite and burbankite, releasing REE, Sr and Ba. Oxidation of primary minor pyrite present in calcite carbonatite by the hydrothermal fluid probably enabled crystallisation of Sr- and Ba-sulfates at the end of the process, as was also assumed for the Okorusu carbonatite complex (Cangelosi et al., Reference Cangelosi, Broom-Fendley, Banks, Morgan and Yardley2020). A transition from secondary marcasite after pyrite to baryte in the Bear Lodge carbonatite was also discussed by Chakhmouradian et al. (Reference Chakhmouradian, Cooper, Reguir and Moore2017).
The appearance of abundant fluorite in association with pseudomorphs after burbankite is indicative that F probably played an important role in the decomposition of REE minerals. The role of fluorine has been demonstrated in many carbonatite complexes (Simonneti and Bell, Reference Simmonetti and Bell1995; Bühn et al., Reference Bühn, Schneider, Dulski and Rankin2003; Xu et al., Reference Xu, Taylor, Kynicky, Chakhmouradian, Song and Wang2011) although recent experimental studies of hydrothermal systems (Williams-Jones et al., Reference Williams-Jones, Migdisov and Samson2012; Migdisov et al., Reference Migdisov, Williams-Jones, Brugger and Caporusci2016) have suggested that, although fluorine is the strongest REE-binding ligand, the presence of fluorine in hydrothermal solutions, rather than facilitating REE transport causes precipitation of F-bearing REE carbonate or phosphate minerals (Migdisov and Williams-Jones, Reference Migdisov and Williams-Jones2008; Migdisov et al., Reference Migdisov, Williams-Jones and Wagner2009; Reference Migdisov, Williams-Jones, Brugger and Caporusci2016; Williams-Jones et al., Reference Williams-Jones, Migdisov and Samson2012). If the REE are transported as sulfate complexes, precipitation of sulfates, e.g. baryte, will induce precipitation of REE minerals. This statement correlates with our observation in Lofdal calcite carbonatites of the Main Intrusion that abundant baryte and celestine appear at the last stages of REE-mineral crystallisation, in dissolution cavities, veinlets and in pseudomorphs after burbankite.
Conclusions
Although the Lofdal alkaline carbonatite complex is best known for its xenotime content and HREE enrichment, there is also more typical occurrence of LREE-enriched calcite carbonatite, with abundant early forming burbankite blebs, occurring as hexagonal crystals and their subsequent pseudomorphs. These carbonatites do not contain xenotime. The early crystallisation of burbankite indicates that the carbonatitic magma was enriched in Na, Sr, Ba, and LREE. The isotope geochemistry of the calcite carbonatite is consistent with a mantle origin of the rock.
The primary minerals in the Main Intrusion calcite carbonatite, and especially nearby dykes. were partly-overprinted by hydrothermal fluids enriched in F–, SO42– and CO32–. This alteration redistributed REE, Na, Sr and Ba to form a new mineral assemblage. Varying degrees of burbankite alteration have been observed, culminating in complete pseudomorphs in the dyke, which consist of carbocernaite, ancylite, bastnäsite, strontianite, celestine, parisite, cordylite and baryte. The fluid reworking of the carbonatites probably released Na into contact fenite aureoles.
The occurrence of abundant fluorite in association with pseudomorphs after burbankite suggests that fluorine probably plays an important role in the breakdown of REE complexes and subsequent precipitation of the REE mineral assemblage.
There is no direct relationship between the xenotime, including the deposit in Area 4, at Lofdal and the burbankite in the calcite carbonatites of the Main Intrusion, however the xenotime-bearing deposit in Area 4 is associated with albitite, and together with the abundant burbankite blebs in the magmatic calcite carbonatite, this indicates the sodium-rich nature of the Lofdal system overall, which may have promoted REE mobility.
Acknowledgements
We are grateful to the Namibia Geological Survey and Rainer Ellmies for their help with organising access to the Lofdal area and supporting us in the field. The manuscript was improved by the contributions of two anonymous referees and guest editors A.R. Chakhmouradian and A.N. Zaitsev. We are grateful to R.H. Mitchell for editorial handling. A.N. Zaitsev is thanked for providing a burbankite reference sample from Khibiny. We thank BGR colleagues D. Henry for sample preparation, F. Korte and H. Lorenz for geochemical analysis, F. Henjes-Kunst and P. Königer for the isotopic study, C. Whörl for his help with microprobe analysis, A. Marx and K.Berkh for their help with Raman spectroscopy analysis.
Supplementary material
To view supplementary material for this article, please visit https://doi.org/10.1180/mgm.2021.56