I. INTRODUCTION
Magnesium alloys have received a lot of attention in recent years due to their applications in automobile, aerospace, electronic devices, and nuclear industries.Reference Mordike and Ebert1–Reference Yang, Lui, Chen and Hung3 However, the use of magnesium sheet in automobile is still limited and requires more investigations so that commercial magnesium sheet, competing with commercial sheets of heavier metals like aluminum and steel, can be manufactured at low cost. The limited ductility and poor formability of magnesium and its alloys, particularly at lower temperatures (<250 °C), are due to their hexagonal closed packed (hcp) structure.Reference Agnew, Senn and Horton4,Reference Tang, Huang, Li and Peng5 The deformation at low temperature takes place mainly on {0001} basal planes along the 〈11-20〉 direction, as a result of which a strong basal texture is formed. During this process, the basal planes are oriented toward the sheet surface with their c-axis perpendicular to the metal flow direction.Reference Sadeghi and Pekguleryuz6,Reference Agnew, Yoo and Tome7 Under these conditions, the deformation along the c-axis via basal slip becomes very difficult and can be accommodated by only two 〈a〉 nonbasal independent slip systems, however, according to von Mises criteria, five independent slip systems are required for general plasticity.Reference Mordike and Ebert1
The formability of the Mg alloy sheets can be improved by altering their basal texture, i.e., inclination of basal pole and reduction of basal texture intensity.Reference Huang, Suzuki, Watazu, Shigematsu and Saito8–Reference Iwanaga, Tashiro, Okamoto and Shimizu10 In the last decade, various efforts have been made to get rid of basal texture so that high quality sheet products at a low and competitive price may be manufactured. These include: (i) the development of new wrought magnesium alloys which are less susceptible to basal texture,Reference Huang, Suzuki, Watazu, Shigematsu and Saito11–Reference Standford and Barnett13 (ii) the improvements in sheet production technology to alter the basal texture by the activation of nonbasal slip systems,Reference Barnett, Standford, Cizek, Beer, Xuebin and Keshavarz14 and (iii) the modifications in already existing wrought alloys by the addition of different alloying elements.Reference Watanabe, Mukai, Mabuchi and Higashi15,Reference Watanabe, Tsutsui, Mukai, Kohzu, Tanabe and Higashi16 It has been reported that the elements which refine the grain size of the magnesium alloys also weaken the basal texture. Most of these elements have large atomic radii, e.g., Ca, Sr, Y, rare earth (RE) elements (La, Ce, Gd), etc. It has been reported that the grain size plays influential role in enhancing the relative contributions of different slip systems, smaller the grain size a generally weaker texture is expected.Reference Hirsch and Al-Samman17 Different mechanisms are involved to weaken the basal texture by the addition of various alloying elements, e.g., the addition of Sr is reported to weaken the basal texture through the mechanism of particle stimulated nucleation (PSN).Reference Masoumi and Pekguleryuz18 Though high formability is usually associated with very low strain rates and high temperatures yet it is always recommended to apply large amounts of deformation at high strain rates and low temperatures to speed up the forming process at low cost. Therefore, an optimum combination of temperature and strain rate is required to achieve an adequate formability in a given sheet material.
In the present study, a novel Mg–3Al–1Zn alloy containing 0.5% of nonRE elements (Ag–In master alloy) was synthesized and characterized using various microscopic techniques. Additionally, a heavy cumulative reduction of 33% at a warm rolling temperature of 300 °C was carried out. The effect of single and multipass reductions (2 and 8 passes) on microstructure, texture evolution, and hardness was investigated systematically. The other novel feature of this study is that instead of using traditional grain refiners (Mn or Zr), the same alloying addition also served as a grain refiner.
II. EXPERIMENTAL
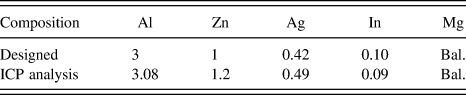
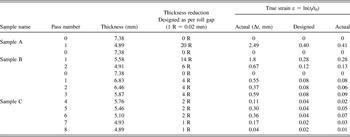
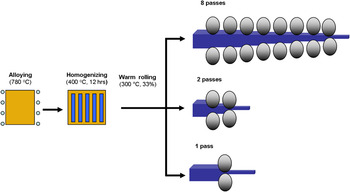
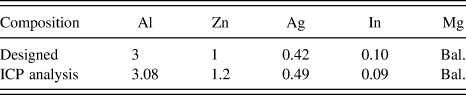
The base alloy with a nominal chemistry of Mg–3 wt% Al–1 wt% Zn was prepared first from high purity Mg (99.99%), Al (99.99%), and Zn (99.99%). The charge was melted in an iron crucible using an electrical resistance furnace. When the charge was fully melted, 0.5 wt% of master alloy Ag–In (85Ag–15In, wt%) was added into the Mg–Al–Zn alloy. After stabilization at 780 °C (1053 K) for about 5 min, the melt was poured into a copper mold with a dimension of 80 × 75 × 8 mm3. The cast ingot was demolded after cooling in Ar atmosphere. All melting/casting processes were performed under a dynamic flow of argon gas (99.999% pure) to maintain a low humidity (<10% RH) in the glove box. Subsequently, a homogenization heat treatment at 400 °C (673 K) for 12 h in Ar atmosphere was carried out. Chemical analysis of the as-homogenized samples was performed using Thermofisher 6000 inductively coupled plasma (ICP) equipment (Table I). The samples of alloy with a thickness of 7.38 mm were utilized for warm rolling experiments. Warm rolling of homogenized samples was performed at 300 °C (573 K) using Joliot two high rolling mills with a roll diameter and roll length of 124 and 150 mm, respectively. Rolling speed was kept fixed at 27 rev. min−1 throughout the experiment. Prior to the start of rolling, all samples were preheated for 2 h at (350 °C) 623 K in Ar atmosphere. Three samples namely A, B, and C were reduced to a thickness of approximately 4.89 mm in one, two, and eight rolling passes at 300 °C (573 K) according to the rolling schedule provided in Table II. Intermediate heating at 300 °C (573 K) for 4 min was carried out between individual passes for sample B and sample C. The complete rolling process is summarized in a schematic diagram (Fig. 1). The specimens for microscopic examination were ground by using SiC papers from 1500 grits down to 4000 grits. Polishing was carried out using 0.05 μm alumina and ethanol solution. The polished specimens were etched for 1–5 s using an etchant composed of acetic acid 10 mL, acetic picral 4.25 g, distilled water 10 mL, and ethanol 70 mL. Subsequently, optical microscopy (OM) and scanning electron microscopy (SEM) of the samples were performed in the rolling plane. The grain size was determined by the line intercept method according to ASTM standard E112-10. The macrotexture was determined by a Schulz reflection method with Cu Kα radiation using a Rigaku D/max-2500 diffractometer (Kemsing, Sevenoaks, Kent, UK). Incomplete experimental pole figures of (0002), (10-10), and (10-11) planes were constructed for α angles from 15 to 85° in the sheet plane containing rolling direction (RD) and transverse direction (TD). After making data correction for the background and intensity, the orientation distribution function (ODF) was calculated using (0002), (10-10), and (10-11) pole figures to recalculate the complete pole figures of each sample using mtex software. Finally, microhardness measurements were made using a microVickers apparatus with an indenting load of 1.96 N and a dwell time of 10 s. Hardness test was performed in accordance with ASTM test standard E384-08.
Chemical composition of the alloys (wt%).
The single pass and multipass rolling schedules.

Schematic illustration of the thermo-mechanical treatment.

III. RESULTS AND DISCUSSION
A. Rolling schedule
All rolling experiments were designed for a total true strain of 0.40. For multiple roll experiments (both 2 and 8 passes), a high strain was chosen for initial passes followed by lower value of strains in the subsequent passes. The roll gap of the mill was manually adjustable, and one full revolution (R) of rolls produced a true strain of ε = 0.02. The data in Table II showed that the actual true strain for samples A and B complied well with the designed values. However, some minor variation of true strain was observed for sample C during steps 4–6. This behavior may be attributed to the manual adjustment of roll gaps.
B. Microstructural study
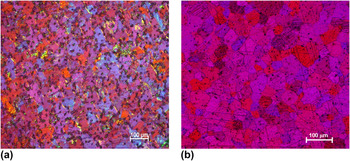
The as-cast and homogenized microstructure of the alloy is shown in Figs. 2(a) and 2(b). The as-cast alloy revealed grains with an average size of ∼32 µm along with significant volume fraction of the second phase particles. Quite interestingly, a larger volume fraction of these particles were observed at the grain boundaries with relatively few in grain interiors. The results of energy dispersive x-ray spectroscopy (EDX) analysis indicate that these second phases are the binary Mg17Al12, which is a typical feature of Al–Mg–Zn alloys.Reference Marya, Hector, Verma and Tong19 Most of the second phase particles were dissolved in the matrix when the alloy was homogenized at 400 °C (673 K) for 12 h, as shown in Fig. 2(b). After homogenization, it was observed that the majority of the grains were equiaxed with a mean size of ∼37 μm. Only a very small change in the grain size after homogenization hints that the Ag–In alloy addition might have helped in retardation of grain growth.
Optical micrographs of the (a) as-cast and (b) homogenized alloy.

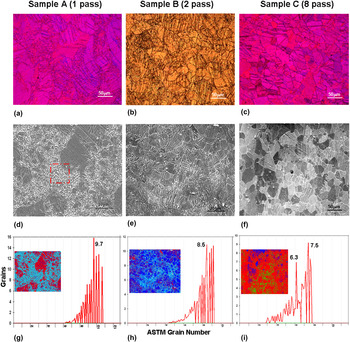
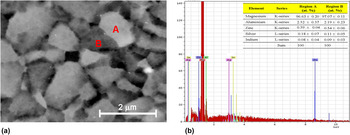
Figures 3(a)–3(c) provide the optical microstructures for the alloy, after 33% rolling reduction carried out at 300 °C, in 1, 2, and 8 passes, respectively. The corresponding SEM micrographs are provided in Figs. 3(d)–3(f) while ASTM grain size analysis results are provided in Figs. 3(g) and 3(h). The optical and SEM micrographs of sample A, that was rolled in 1 pass [Figs. 3(a) and 3(d)], showed a predominant bimodal microstructure consisting of two populations of grains: (i) fine, dynamic recrystallized grains (DRXed grains) (necklaces grains) and (ii) coarsened grains. This observation is in agreement with the literature.Reference Watanabe, Mukai, Mabuchi and Higashi15Figures 3(b) and 3(e) showed a relatively coarser grained material with relatively smaller fraction of DRXed grains for sample B. However, no DRXed grains were visible in optical as well as SEM micrographs in the case of sample C [Figs. 3(c) and 3(f)]. Figure 4(a) provides a magnified view of the highlighted region of the DRXed grains shown in Fig. 3(d). This shows that the majority of the grains are of the order of ∼1–2 μm. Figure 4(b) provides a summary of the EDX analysis performed at regions A (gray) and B (dark gray) in Fig. 4(a). The confidence level was attained by carrying out at least five different EDX analyses for each region using a backscattered electron (Z-contrast) detector. From the results, both regions A and B seem to be grains of Mg-based solid solution with a slight change in stoichiometry. The two different contrasts of grains might be associated with different grain topographies.
(a–c) The optical microstructures, (d–f) SEM micrographs, and (g–i) ASTM grain analysis, for the alloy after 33% rolling reduction at 300 °C vide 1, 2, and 8 passes, respectively.

(a) Magnified view of the highlighted region in Fig. 3(d), (b) summary of EDX analysis performed at regions 1 and 2 in (a).

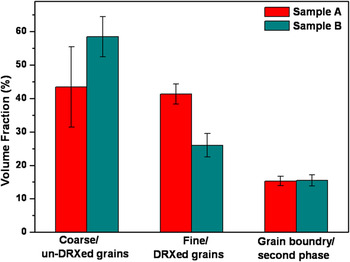
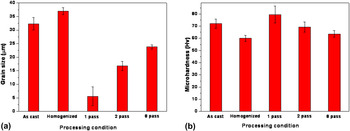
Figure 5 illustrates the effect of reduction per pass on volume fraction of DRXed grains. It can be deduced that the volume fraction of DRXed grain in the alloy is dependent on the amount of reduction per pass. It is observed that the amount of DRXed grains in sample A (∼42%) was greater than that of sample B (∼25%), while the fraction of coarsened grains or unDRXed grains was higher for sample B. Figure 6(a) provides the average grain size of the alloy in the as-cast, homogenized, and as-rolled conditions. The increase in average grain size of sample C with the lowest reduction ratio per pass may be attributed to the intermediate heating (350 °C for 4 min), between the roll passes due to which the grain growth might have occurred more frequently and more readily than at a higher reduction ratio per pass. It is clear from the results that with an increase in the reduction per pass the grain size becomes increasingly finer and vice versa. These findings are in agreement with the work of previous researchers.Reference Yim, Seo and You20
The effect of single and multiple pass reduction on volume fraction of DRXed grains.

(a) The variation in the grain size and (b) microhardness of as-cast, homogenized, and rolled samples.

C. Microhardness
Figure 6(b) shows the variation in microhardness of the alloy in different processing conditions, in as-cast, homogenized, and as a function of reduction per pass. It is clear from the results that the hardness of sample A was maximum due to heavy reduction per pass. The microhardness was found to vary inversely with the number of rolling passes. It may be concluded that greater the number of rolling passes to get a particular reduction in thickness, lower the microhardness. The contribution in hardness seems to be due to two separate reasons, one a strained lattice having a high volume fraction of twins and second due to the fraction of DRXed fine grains. Thus, the maximum hardness would be observed when either both effects would have a significant contribution or when one effect has an overwhelmingly high contribution. In the present study, the effect of increase on microhardness due to the finer grain size is quite evident. Sample A has minimum grain size as a result of heavy reduction in a single pass, therefore its hardness is higher than those of sample B and sample C. On the other hand, no significant grain refinement was observed as the reduction per pass was decreased. The relation of ductility with grain refinement obtained either with the addition of alloying elements or by applying sever plastic deformation is well documented.Reference Mukai, Watanabe, Ishikawa and Higashi21
D. Texture analysis
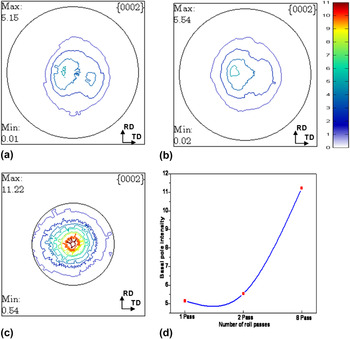
The evolution of the macrotexture during warm rolling of the alloy subjected to 33% reduction in thickness in 1, 2, and 8 passes is presented in Figs. 7(a)–7(c). The texture is represented using the (0002) pole figures. After a reduction of 33% in a single pass (sample A), a comparatively weak basal texture developed with a prominent double basal peak maximum splitting from ND toward the TD [Fig. 7(a)]. In the previous studies on Mg–3Al–1Zn, a surface split of texture from ND to RD is reported in the normal conventionally rolled samples whereas differential/variable speed rolling showed this type of split from ND to TD, which is considered a desirable feature of texture modification.Reference Huang, Suzuki, Watazu, Shigematsu and Saito22,Reference Zhu, Liu, Wu, Cai and Shen23 In the present work, the development of this type of two-peak TD split texture in Mg alloy sheets is quite significant because this has been reported for only a few Mg based alloys like Mg–Zn–Ce, Mg–Zn–Gd, etc. Different explanations have been provided by the researcher for the TD splitting of basal poles for these alloys, these include (i) static recrystallization accompanied by nucleation during annealing, (ii) reorientation of grains during deformation, and (iii) activation of prismatic 〈a〉 slip.Reference Mackenzie and Pekguleryuz24–Reference Yan, Chen and Han26 On the other hand, warm rolling of the modified alloy subjected to 33% reduction in 2 passes (sample B) showed a slightly stronger basal texture as double peak is tending to convert into single peak as a result of low strain in each successive pass [Fig. 7(b)]. The intensity of the basal pole texture became very strong as the strain per pass was further reduced in such a way that 33% reduction in thickness (sample C) was obtained in 8 passes [Fig. 7(c)]. The shifting of double peak split into a single peak in sample C may be attributed to grain coarsening due to intermediate heating between the successive passes of rolling. For comparison purpose, Fig. 7(d) presents a summary of the basal pole texture intensity in samples A, B, and C. It is quite clear from the figure that the basal pole intensity of sample C becomes almost double than that of sample A.
The basal pole figures of rolled alloys, (a) 1 pass, (b) 2 pass, (c) 8 pass, and (d) effect of number of passes on basal pole intensity. The center of the pole figure corresponds to the normal to the sheet plane.

All in all, it seems that fine DRXed grains, high hardness and a double peak split toward TD are the characteristics of this novel alloy when subjected to 33% reduction in a single pass. Whereas, coarse grains, low hardness, and a single peak maximum are the other features when this alloy was subjected to multipass warm rolling.
IV. CONCLUSIONS
It can be concluded that the addition of 0.5 wt% Ag–In to Mg–3Al–1Zn alloy resulted in a finer grain structure in the as-cast and in as-homogenized states. The warm deformation of sample A at 300 °C with accumulative reduction in a single pass helped in (i) grain refinement due to an increased amount of DRX and (ii) a significantly reduced basal pole intensity in comparison to samples B and C. It was noticed that the splitting of the basal poles occurred from ND toward the TD in sample A. The increase in grain size of samples B and C was attributed to a larger number of rolling passes each with an intermediate reheating. The microhardness results confirmed a higher hardness value for the fine grained sample. It was concluded that larger reduction per pass resulted in a greater amount of fine DRXed grains which in turn resulted in a weaker texture.
ACKNOWLEDGMENTS
One of the authors, Mr. Javed Kamran, would like to acknowledge the funding provided by the Higher Education Commission (HEC) of Pakistan under the International Research Initiative Support Program (IRSIP). All the research support provided by the faculty and staff at School of Materials in the University of Manchester is also gratefully acknowledged.