



%20--%3e%3c!DOCTYPE%20svg%20PUBLIC%20'-//W3C//DTD%20SVG%201.0//EN'%20'http://www.w3.org/TR/2001/REC-SVG-20010904/DTD/svg10.dtd'%3e%3csvg%20version='1.0'%20id='Layer_1'%20xmlns='http://www.w3.org/2000/svg'%20xmlns:xlink='http://www.w3.org/1999/xlink'%20x='0px'%20y='0px'%20width='64px'%20height='64px'%20viewBox='5.5%20-3.5%2064%2064'%20enable-background='new%205.5%20-3.5%2064%2064'%20xml:space='preserve'%3e%3cg%3e%3ccircle%20fill='%23FFFFFF'%20fill-opacity='0'%20cx='37.785'%20cy='28.501'%20r='28.836'/%3e%3cpath%20fill='%23595959'%20d='M37.441-3.5c8.951,0,16.572,3.125,22.857,9.372c3.008,3.009,5.295,6.448,6.857,10.314%20c1.561,3.867,2.344,7.971,2.344,12.314c0,4.381-0.773,8.486-2.314,12.313c-1.543,3.828-3.82,7.21-6.828,10.143%20c-3.123,3.085-6.666,5.448-10.629,7.086c-3.961,1.638-8.057,2.457-12.285,2.457s-8.276-0.808-12.143-2.429%20c-3.866-1.618-7.333-3.961-10.4-7.027c-3.067-3.066-5.4-6.524-7-10.372S5.5,32.767,5.5,28.5c0-4.229,0.809-8.295,2.428-12.2%20c1.619-3.905,3.972-7.4,7.057-10.486C21.08-0.394,28.565-3.5,37.441-3.5z%20M37.557,2.272c-7.314,0-13.467,2.553-18.458,7.657%20c-2.515,2.553-4.448,5.419-5.8,8.6c-1.354,3.181-2.029,6.505-2.029,9.972c0,3.429,0.675,6.734,2.029,9.913%20c1.353,3.183,3.285,6.021,5.8,8.516c2.514,2.496,5.351,4.399,8.515,5.715c3.161,1.314,6.476,1.971,9.943,1.971%20c3.428,0,6.75-0.665,9.973-1.999c3.219-1.335,6.121-3.257,8.713-5.771c4.99-4.876,7.484-10.99,7.484-18.344%20c0-3.543-0.648-6.895-1.943-10.057c-1.293-3.162-3.18-5.98-5.654-8.458C50.984,4.844,44.795,2.272,37.557,2.272z%20M37.156,23.187%20l-4.287,2.229c-0.458-0.951-1.019-1.619-1.685-2c-0.667-0.38-1.286-0.571-1.858-0.571c-2.856,0-4.286,1.885-4.286,5.657%20c0,1.714,0.362,3.084,1.085,4.113c0.724,1.029,1.791,1.544,3.201,1.544c1.867,0,3.181-0.915,3.944-2.743l3.942,2%20c-0.838,1.563-2,2.791-3.486,3.686c-1.484,0.896-3.123,1.343-4.914,1.343c-2.857,0-5.163-0.875-6.915-2.629%20c-1.752-1.752-2.628-4.19-2.628-7.313c0-3.048,0.886-5.466,2.657-7.257c1.771-1.79,4.009-2.686,6.715-2.686%20C32.604,18.558,35.441,20.101,37.156,23.187z%20M55.613,23.187l-4.229,2.229c-0.457-0.951-1.02-1.619-1.686-2%20c-0.668-0.38-1.307-0.571-1.914-0.571c-2.857,0-4.287,1.885-4.287,5.657c0,1.714,0.363,3.084,1.086,4.113%20c0.723,1.029,1.789,1.544,3.201,1.544c1.865,0,3.18-0.915,3.941-2.743l4,2c-0.875,1.563-2.057,2.791-3.541,3.686%20c-1.486,0.896-3.105,1.343-4.857,1.343c-2.896,0-5.209-0.875-6.941-2.629c-1.736-1.752-2.602-4.19-2.602-7.313%20c0-3.048,0.885-5.466,2.658-7.257c1.77-1.79,4.008-2.686,6.713-2.686C51.117,18.558,53.938,20.101,55.613,23.187z'/%3e%3c/g%3e%3c/svg%3e)
%20--%3e%3c!DOCTYPE%20svg%20PUBLIC%20'-//W3C//DTD%20SVG%201.0//EN'%20'http://www.w3.org/TR/2001/REC-SVG-20010904/DTD/svg10.dtd'%3e%3csvg%20version='1.0'%20id='Layer_1'%20xmlns='http://www.w3.org/2000/svg'%20xmlns:xlink='http://www.w3.org/1999/xlink'%20x='0px'%20y='0px'%20width='64px'%20height='64px'%20viewBox='5.5%20-3.5%2064%2064'%20enable-background='new%205.5%20-3.5%2064%2064'%20xml:space='preserve'%3e%3cg%3e%3ccircle%20fill='%23FFFFFF'%20fill-opacity='0'%20cx='37.637'%20cy='28.806'%20r='28.276'/%3e%3cg%3e%3cpath%20fill='%23595959'%20d='M37.443-3.5c8.988,0,16.57,3.085,22.742,9.257C66.393,11.967,69.5,19.548,69.5,28.5c0,8.991-3.049,16.476-9.145,22.456%20C53.879,57.319,46.242,60.5,37.443,60.5c-8.649,0-16.153-3.144-22.514-9.43C8.644,44.784,5.5,37.262,5.5,28.5%20c0-8.761,3.144-16.342,9.429-22.742C21.101-0.415,28.604-3.5,37.443-3.5z%20M37.557,2.272c-7.276,0-13.428,2.553-18.457,7.657%20c-5.22,5.334-7.829,11.525-7.829,18.572c0,7.086,2.59,13.22,7.77,18.398c5.181,5.182,11.352,7.771,18.514,7.771%20c7.123,0,13.334-2.607,18.629-7.828c5.029-4.838,7.543-10.952,7.543-18.343c0-7.276-2.553-13.465-7.656-18.571%20C50.967,4.824,44.795,2.272,37.557,2.272z%20M46.129,20.557v13.085h-3.656v15.542h-9.944V33.643h-3.656V20.557%20c0-0.572,0.2-1.057,0.599-1.457c0.401-0.399,0.887-0.6,1.457-0.6h13.144c0.533,0,1.01,0.2,1.428,0.6%20C45.918,19.5,46.129,19.986,46.129,20.557z%20M33.042,12.329c0-3.008,1.485-4.514,4.458-4.514s4.457,1.504,4.457,4.514%20c0,2.971-1.486,4.457-4.457,4.457S33.042,15.3,33.042,12.329z'/%3e%3c/g%3e%3c/g%3e%3c/svg%3e)
%20--%3e%3c!DOCTYPE%20svg%20PUBLIC%20'-//W3C//DTD%20SVG%201.0//EN'%20'http://www.w3.org/TR/2001/REC-SVG-20010904/DTD/svg10.dtd'%3e%3csvg%20version='1.0'%20id='Layer_1'%20xmlns='http://www.w3.org/2000/svg'%20xmlns:xlink='http://www.w3.org/1999/xlink'%20x='0px'%20y='0px'%20width='64px'%20height='64px'%20viewBox='5.5%20-3.5%2064%2064'%20enable-background='new%205.5%20-3.5%2064%2064'%20xml:space='preserve'%3e%3cg%3e%3ccircle%20fill='%23FFFFFF'%20fill-opacity='0'%20cx='36.924'%20cy='28.403'%20r='28.895'/%3e%3cpath%20fill='%23595959'%20d='M37.442-3.5c8.99,0,16.571,3.085,22.743,9.256C66.393,11.928,69.5,19.509,69.5,28.5c0,8.992-3.048,16.476-9.145,22.458%20C53.88,57.32,46.241,60.5,37.442,60.5c-8.686,0-16.19-3.162-22.513-9.485C8.644,44.728,5.5,37.225,5.5,28.5%20c0-8.762,3.144-16.343,9.429-22.743C21.1-0.414,28.604-3.5,37.442-3.5z%20M12.7,19.872c-0.952,2.628-1.429,5.505-1.429,8.629%20c0,7.086,2.59,13.22,7.77,18.4c5.219,5.144,11.391,7.715,18.514,7.715c7.201,0,13.409-2.608,18.63-7.829%20c1.867-1.79,3.332-3.657,4.398-5.602l-12.056-5.371c-0.421,2.02-1.439,3.667-3.057,4.942c-1.622,1.276-3.535,2.011-5.744,2.2%20v4.915h-3.714v-4.915c-3.543-0.036-6.782-1.312-9.714-3.827l4.4-4.457c2.094,1.942,4.476,2.913,7.143,2.913%20c1.104,0,2.048-0.246,2.83-0.743c0.78-0.494,1.172-1.312,1.172-2.457c0-0.801-0.287-1.448-0.858-1.943l-3.085-1.315l-3.771-1.715%20l-5.086-2.229L12.7,19.872z%20M37.557,2.214c-7.276,0-13.428,2.571-18.457,7.714c-1.258,1.258-2.439,2.686-3.543,4.287L27.786,19.7%20c0.533-1.676,1.542-3.019,3.029-4.028c1.484-1.009,3.218-1.571,5.2-1.686V9.071h3.715v4.915c2.934,0.153,5.6,1.143,8,2.971%20l-4.172,4.286c-1.793-1.257-3.619-1.885-5.486-1.885c-0.991,0-1.876,0.191-2.656,0.571c-0.781,0.381-1.172,1.029-1.172,1.943%20c0,0.267,0.095,0.533,0.285,0.8l4.057,1.83l2.8,1.257l5.144,2.285l16.397,7.314c0.535-2.248,0.801-4.533,0.801-6.857%20c0-7.353-2.552-13.543-7.656-18.573C51.005,4.785,44.831,2.214,37.557,2.214z'/%3e%3c/g%3e%3c/svg%3e)
%20--%3e%3c!DOCTYPE%20svg%20PUBLIC%20'-//W3C//DTD%20SVG%201.1//EN'%20'http://www.w3.org/Graphics/SVG/1.1/DTD/svg11.dtd'%3e%3csvg%20version='1.1'%20id='Layer_1'%20xmlns='http://www.w3.org/2000/svg'%20xmlns:xlink='http://www.w3.org/1999/xlink'%20x='0px'%20y='0px'%20width='64.000977px'%20height='64px'%20viewBox='0%200%2064.000977%2064'%20enable-background='new%200%200%2064.000977%2064'%20xml:space='preserve'%3e%3cg%3e%3ccircle%20fill='%23FFFFFF'%20fill-opacity='0'%20cx='32.064453'%20cy='31.788086'%20r='29.012695'/%3e%3cg%3e%3cpath%20fill='%23595959'%20d='M31.943848,0C40.896484,0,48.476562,3.105469,54.6875,9.314453C60.894531,15.486328,64.000977,23.045898,64.000977,32%20s-3.048828,16.457031-9.145508,22.513672C48.417969,60.837891,40.779297,64,31.942871,64%20c-8.648926,0-16.152832-3.142578-22.513672-9.429688C3.144043,48.286133,0,40.761719,0,32.000977%20c0-8.723633,3.144043-16.285156,9.429199-22.68457C15.640137,3.105469,23.14502,0,31.943848,0z%20M32.060547,5.771484%20c-7.275391,0-13.429688,2.570312-18.458496,7.714844C8.381836,18.783203,5.772949,24.954102,5.772949,32%20c0,7.125,2.589844,13.256836,7.77002,18.400391c5.181152,5.181641,11.352051,7.770508,18.515625,7.770508%20c7.123047,0,13.332031-2.608398,18.626953-7.828125C55.713867,45.466797,58.228516,39.353516,58.228516,32%20c0-7.3125-2.553711-13.484375-7.65625-18.513672C45.504883,8.341797,39.333984,5.771484,32.060547,5.771484z%20M44.117188,24.456055%20v5.485352H20.859863v-5.485352H44.117188z%20M44.117188,34.743164v5.481445H20.859863v-5.481445H44.117188z'/%3e%3c/g%3e%3c/g%3e%3c/svg%3e)
Significant outcomes
-
• A machine learning model to predict incident type 2 diabetes (T2D) in patients with mental illness demonstrated high temporal stability.
-
• Secondary analyses suggested that models trained on recent data (past year) may achieve similar or better discrimination than models trained on longer historical periods.
-
• The temporal stability of the T2D prediction model supports its potential for clinical implementation, facilitating early detection and tailored intervention.
Limitations
-
• We evaluated a previously developed T2D risk prediction model and, therefore, inherited methodological choices and associated limitations of that work.
-
• The result may not generalise to populations with a different T2D risk profile and HbA1c sampling frequency.
Introduction
Clinical prediction models are emerging across a wide range of medical fields, including psychiatry, often with the goal of diagnostic classification or predicting patient outcomes (prognosis). Despite their initial promise, an increasing body of literature raises concerns about the real-world applicability of clinical prediction models and calls for validation of generalisability before such models are implemented in clinical practice (Altman et al., Reference Altman, Vergouwe, Royston and Moons2009; Steyerberg and Harrell, Reference Steyerberg and Harrell2016; Van Calster et al., Reference Van Calster, Steyerberg, Wynants and van Smeden2023).
In modern medicine, standards of care, baseline risks for medical conditions, data registration procedures, and available treatment options change over time. Such changes affect population characteristics and data-generating processes, possibly causing performance drifts in clinical prediction models (Jenkins et al., Reference Jenkins, Sperrin, Martin and Peek2018, Reference Jenkins, Martin, Sperrin, Riley, Debray, Collins and Peek2021; Toll et al., Reference Toll, Janssen, Vergouwe and Moons2008). Consequently, assessment of temporal stability – i.e., maintained performance of a prediction model on new patients – is increasingly recognised as vital prior to deployment in routine clinical decision-support settings (Jenkins et al., Reference Jenkins, Martin, Sperrin, Riley, Debray, Collins and Peek2021; Lopes et al., Reference Lopes, Yordanov, Ravelli, Houterman, Vis, de Mol, Marquering and Abu-Hanna2023; Ramspek et al., Reference Ramspek, Jager, Dekker, Zoccali and van Diepen2021; Toll et al., Reference Toll, Janssen, Vergouwe and Moons2008).
We have previously developed and validated a machine learning model for prediction of incident type 2 diabetes (T2D) in patients with mental illness using routinely collected electronic health record (EHR) data (Bernstorff et al., Reference Bernstorff, Hansen, Enevoldsen, Damgaard, Hæstrup, Perfalk, Danielsen and Østergaard2025). In the present study, we set out to investigate the temporal stability of this model by evaluating its performance across successive calendar years. This was operationalised by taking the original model, trained on data from the years 2013 to 2017, and evaluating it on data from the years 2018 through 2023, respectively. By investigating performance trends across evaluation years, we quantify potential temporal degradation and evaluate whether a model developed on historical data remains reliable for ongoing clinical deployment.
Methods
In the present study, we evaluated the temporal stability of the T2D prediction model (Bernstorff et al., Reference Bernstorff, Hansen, Enevoldsen, Damgaard, Hæstrup, Perfalk, Danielsen and Østergaard2025) by quantifying how its discriminative performance, measured by the area under the receiver operating characteristic curve (AUROC), varies across calendar years. More specifically, we used the training configuration of the original model to train a new model on data from the first five calendar years (2013–2017) of the same underlying cohort as the original model. We, then, evaluated the model’s ability to predict T2D two years ahead separately on data from each of the subsequent calendar years (2018–2023). Specifically, for each patient contact, the outcome was defined as incident T2D within the following two years. For example, for a contact on January 1, 2018, T2D occurring before January 1, 2020 was considered as outcome, whereas for a contact on December 31, 2018, T2D occurring before December 31, 2020 was considered as outcome. Predictions were binned according to calendar year of the patient contact. This yielded one independent test set per year from which we can estimate year-specific performance metrics to assess potential temporal drift in the predictive accuracy of the model.
Statistical analyses
The analytical approach is illustrated in Figure 1, while detailed specifications on data preprocessing, outcome extraction, prediction time filtering, and model training procedure are described elsewhere (Bernstorff et al., Reference Bernstorff, Hansen, Enevoldsen, Damgaard, Hæstrup, Perfalk, Danielsen and Østergaard2025). In brief, the point of departure is a hyperparameter-tuned XGBoost model that – based on information on sex, age and mean HbA1c within the past two years (described as the “parsimonious” model in the original study (Bernstorff et al., Reference Bernstorff, Hansen, Enevoldsen, Damgaard, Hæstrup, Perfalk, Danielsen and Østergaard2025)) – predicts whether a patient will meet criteria for T2D following each physical contact to psychiatric services (Bernstorff et al., Reference Bernstorff, Hansen, Enevoldsen, Damgaard, Hæstrup, Perfalk, Danielsen and Østergaard2025). The simplicity of this model is one of its strengths; it minimises the risk of overfitting, thereby providing a robust baseline for evaluating generalisability and temporal robustness.
Extraction of data and outcome, dataset splitting, prediction time filtering, specification of predictors and flattening, model training, testing and evaluation. (A) Data was extracted from the electronic health records. (B) Potential T2D was identified. (C) The dataset obtained is split into an independent training dataset (2013-2017) and six test datasets respective to the years 2018, 2019, 2020, 2021, 2022, and 2023. (D) Prediction times were removed if their lookbehind window extended beyond the start of the dataset or their lookahead extended beyond the end of the dataset. Prediction times were also removed after a patient developed T2D. (E) Predictors for each prediction time were extracted by aggregating the variables within the lookbehind (preceding two years) with multiple aggregation functions. As a result, each row in the dataset represents a specific prediction time with a column for each predictor. (F) The model was trained using the training configuration from the original study and subsequently evaluated on the six independent test sets. True positive predictions were those with predicted probabilities above the decision threshold and the patient developing T2D within the lookahead window. False positive predictions were those where the model’s predicted probability was above the decision threshold, but where none of the T2D criteria were satisfied within the lookahead window. False negatives had predicted probabilities below the threshold, but the T2D criteria were met within the lookahead window. True negatives had predicted probabilities below the threshold, and the patient did not satisfy T2D criteria within the lookahead window. The figure was modified from Bernstorff et al. (Reference Bernstorff, Hansen, Enevoldsen, Damgaard, Hæstrup, Perfalk, Danielsen and Østergaard2025).

Figure 1. Long description
Panel A: A diagram showing data extraction from an SQL database containing information on 100,221 patients and 2.26 million contacts. Data includes medicine, demographics, lab results, and ICD-10 diagnoses. Panel B: A diagram depicting outcome extraction for potential Type 2 Diabetes (T2D) using HbA1c levels. Data entry points and timestamps are shown for two patients. Panel C: A diagram illustrating dataset splitting into a training set (2013-2017) and six test sets (2018-2023). Prediction times are marked along a timeline. Panel D: A diagram explaining prediction time filtering, showing the removal of prediction times that extend beyond the dataset start or end, or after a T2D diagnosis. Panel E: A diagram demonstrating predictor flattening by aggregating variables within a two-year lookbehind window for each prediction time. Panel F: A diagram showing model evaluation on test sets, with true positive, false positive, false negative, and true negative predictions based on predicted probabilities and T2D criteria.
The original model was trained using data from the PSYchiatric Clinical Outcome Prediction cohort, which encompasses routine clinical EHRs data from patients receiving treatment in the Psychiatric Services of the Central Denmark Region from January 1, 2013, to November 22, 2021 (Hansen et al., Reference Hansen, Enevoldsen, Bernstorff, Nielbo, Danielsen and Østergaard2021). For the present study, this dataset was extended to include data up until March 26, 2025.
The methods with regard to model training and testing from the original study (Bernstorff et al., Reference Bernstorff, Hansen, Enevoldsen, Damgaard, Hæstrup, Perfalk, Danielsen and Østergaard2025) were followed with three exceptions. First, while the original study relied on a random, stratified 85/15% training and test split (Bernstorff et al., Reference Bernstorff, Hansen, Enevoldsen, Damgaard, Hæstrup, Perfalk, Danielsen and Østergaard2025), for the present study, we defined the training and test sets according to their temporal position. Specifically, we trained the model exclusively on patient data from January 1, 2013 to December 31, 2017, while patient data from 2018, 2019, 2020, 2021, 2022, and 2023, respectively, make up six test sets reserved solely for model evaluation (prediction of T2D two years ahead). Thus, contrary to the original study, data splits are not defined on the patient level but rather based on prediction times (i.e. psychiatric service contacts). Consequently, data from the same patient may be present in both the training and test sets at different time points. This design reflects a real-world deployment scenario, in which a clinical prediction model trained on historical data is applied to future observations from the same and new patients, and allowed us to evaluate the temporal stability of the prediction model under clinically realistic settings. An overview of patient overlap between training and test sets can be found in Supplementary Table 1. Second, in the original study, the best-performing model was designed to predict whether a patient will meet criteria for T2D in the five years following each physical contact to the Psychiatric Services (Bernstorff et al., Reference Bernstorff, Hansen, Enevoldsen, Damgaard, Hæstrup, Perfalk, Danielsen and Østergaard2025). In the present study, we shortened the prediction/lookahead window and trained the model to predict T2D two years ahead. This was done to facilitate a more robust assessment of temporal stability by avoiding substantial right truncation of data in more recent evaluation years. Third, we retained the hyperparameters from the best-performing model in the original study (Bernstorff et al., Reference Bernstorff, Hansen, Enevoldsen, Damgaard, Hæstrup, Perfalk, Danielsen and Østergaard2025) and did not repeat hyperparameter optimisation or cross-validation. The model was trained once using the full training set (2013–2017) and evaluated on each temporally separated test set to assess the temporal stability of a fixed model specification rather than optimise predictive performance.
For each evaluation year (2018–2023), predicted probabilities were used to compute receiver operating characteristic (ROC) curves and corresponding area under ROC curves (AUROC) values. To derive descriptive performance measures, a classification threshold corresponding to a predicted positive rate of 3% was used to construct confusion matrices, from which sensitivity, specificity, positive predictive value, and negative predictive value were calculated. The predicted positive rate of 3% was chosen from the best-performing model of the original study (Bernstorff et al., Reference Bernstorff, Hansen, Enevoldsen, Damgaard, Hæstrup, Perfalk, Danielsen and Østergaard2025), in which model performance was assessed across a range of different thresholds. Robustness analyses were carried out by examining model performance on each evaluation year across sex, age, and month of the year. As changes in HbA1c sampling frequency over time could affect apparent model performance, we plotted HbA1c sampling frequency by evaluation year (2018–2023). Moreover, to quantify potential temporal drift in model discrimination, a weighted linear regression model was fitted with evaluation year (2018–2023) as a continuous predictor and corresponding AUROC values as the outcome. As the number of contacts (i.e. prediction times) differed across evaluation years (Table 1), the regression was weighted by the number of contacts in each evaluation year. The resulting slope represents the model’s average annual change in AUROC, and 95% confidence intervals were computed to test whether the trend differed from zero. Additionally, model calibration was assessed for each evaluation year, reporting calibration-in-the-large (CITL), calibration slope, observed-to-expected (O:E) event ratio, Brier score, as well as calibration plots.
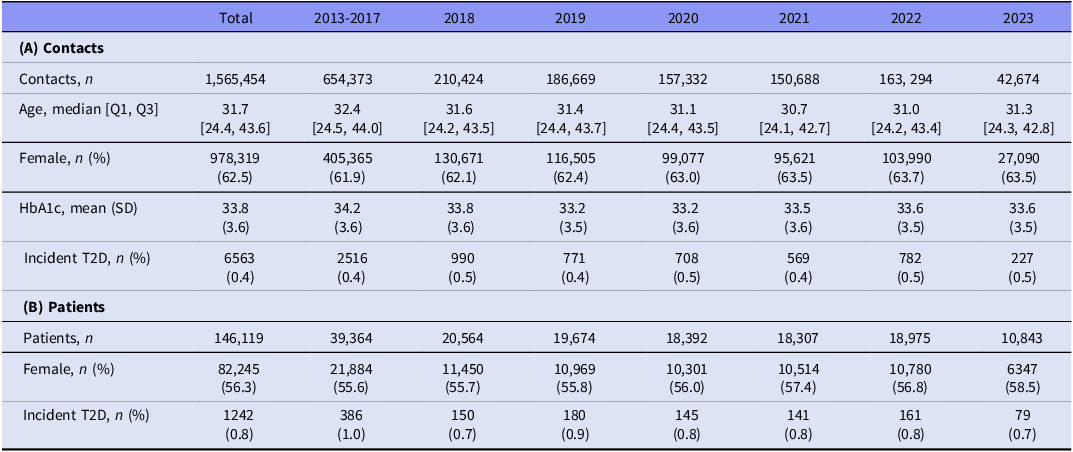
Descriptive statistics for (A) contacts and (B) patients that were eligible for prediction for training (2013–2017) and evaluation years (2018–2023)

Table 1. Long description
The table presents descriptive statistics for contacts and patients eligible for prediction from 2013 to 2023. It is divided into two main sections: (A) Contacts and (B) Patients. Panel A includes data on total contacts, age, gender distribution, HbA1c levels, and incident Type 2 Diabetes (T2D) cases. Panel B includes data on total patients, gender distribution, and incident T2D cases. Each section is further divided into columns for the years 2013-2017, 2018, 2019, 2020, 2021, 2022, and 2023. Row 1: Contacts, n: Total, 1565454; 2013-2017, 654373; 2018, 210424; 2019, 186669; 2020, 157332; 2021, 150688; 2022, 163294; 2023, 42674. Row 2: Age, median [Q1, Q3]: Total, 31.7 [24.4, 43.6]; 2013-2017, 32.4 [24.5, 44.0]; 2018, 31.6 [24.2, 43.5]; 2019, 31.4 [24.4, 43.7]; 2020, 31.1 [24.4, 43.5]; 2021, 30.7 [24.1, 42.7]; 2022, 31.0 [24.2, 43.4]; 2023, 31.3 [24.3, 42.8]. Row 3: Female, n (%): Total, 978319 (62.5); 2013-2017, 405365 (61.9); 2018, 130671 (62.1); 2019, 116505 (62.4); 2020, 99077 (63.0); 2021, 95621 (63.5); 2022, 103990 (63.7); 2023, 27090 (63.5). Row 4: HbA1c, mean (SD): Total, 33.8 (3.6); 2013-2017, 34.2 (3.6); 2018, 33.8 (3.6); 2019, 33.2 (3.5); 2020, 33.2 (3.6); 2021, 33.5 (3.6); 2022, 33.6 (3.5); 2023, 33.6 (3.5). Row 5: Incident T2D, n (%): Total, 6563 (0.4); 2013-2017, 2516 (0.4); 2018, 990 (0.5); 2019, 771 (0.4); 2020, 708 (0.4); 2021, 569 (0.4); 2022, 782 (0.5); 2023, 227 (0.5). Panel B includes data on total patients, gender distribution, and incident T2D cases. Row 1: Patients, n: Total, 146119; 2013-2017, 39364; 2018, 20564; 2019, 19674; 2020, 18392; 2021, 18307; 2022, 18975; 2023, 10843. Row 2: Female, n (%): Total, 82245 (56.3); 2013-2017, 21884 (55.6); 2018, 11450 (55.7); 2019, 10969 (55.8); 2020, 10301 (56.0); 2021, 10514 (57.4); 2022, 10780 (56.8); 2023, 6347 (58.5). Row 3: Incident T2D, n (%): Total, 1242 (0.8); 2013-2017, 386 (1.0); 2018, 150 (0.7); 2019, 180 (0.9); 2020, 145 (0.8); 2021, 141 (0.8); 2022, 161 (0.8); 2023, 79 (0.7).
Contact-level statistics are based on all recorded contacts in the given year(s), while patient-level statistics count unique patients within each year. Given the study design where each year is treated as a separate test set, patients with contacts in multiple years can appear in multiple data sets. Consequently, the patient-level totals across data sets do not correspond to the total number of unique individuals in the study population. Incident T2D refers to patients who develop T2D within the lookahead window (two years). Note that for 2023, the number of contacts and patients is lower than for previous evaluation years, as our dataset extends up until March 26, 2025. Given the lookahead window of two years, we restricted prediction times for 2023 to the period from January 1, 2023, to March 26, 2023.
Secondary analyses
The model described above serves as a baseline scenario where a prediction model is trained, tested, and then deployed without further retraining. Using the same model architecture, predictors, and data source, we conducted a series of secondary analyses to further examine the temporal stability of model discrimination under different temporally defined training data splits. In all analyses, model performance was quantified using the AUROC. The corresponding training and evaluation period for each secondary analysis is described below.
First, to investigate how the stability in performance would be affected by re-estimating the model parameters as new data becomes available, we trained and evaluated annually updated models. This was operationalised by extracting AUROC values from models trained on all available data up to (but not including) each given evaluation year. For example, for evaluation in 2022 (prediction of T2D two years ahead), a model was trained from scratch on all data from 2013 to 2021 and evaluated on data from 2022. This analysis explored whether models trained using all available preceding data up to the evaluation year improved discrimination on unseen data compared with the original static model described above.
Second, to contrast cumulative training and longer retrospective training windows with a short-term recency-based approach, we trained models exclusively on data only from the year immediately preceding each of the evaluation years. For example, for evaluation in 2022, a model was trained on data from 2021 only and evaluated on data from 2022. This analysis assessed how well a model trained on narrow, temporally local data transferred to the following year.
Third, we evaluated models trained on increasingly long look behind windows, beginning with the most recent year and progressively extending the window backwards in time by adding one preceding year at a time. All models were evaluated on data from 2023. This analysis examined the trade-off between training data volume and temporal proximity in a temporally fixed evaluation setting.
Together, these analyses characterise the temporal stability of the XGBoost prediction model under different training window configurations based on data from a real clinical setting.
Sensitivity analysis
To examine whether the apparent stability of the prediction model over time was driven by having data from the same patient being present in both the training and test sets, we repeated the main analysis, stratified by whether patients appeared in the training set or not.
Ethics
The use of EHR data for this study was approved by the Legal Office of the Central Denmark Region in accordance with the Danish Health Care Act §46, Section 2. According to the Danish Committee Act, ethical review board approval is not required for studies based solely on data from EHRs (waiver for the present study: ref. no. 1-10-72-103-24).
Results
The cohort consisted of 75,791 patients with a total of 1.6 million contacts eligible for prediction, distributed across the temporal splits. Table 1 displays an overview of the number of patients and contacts in each split, along with demographic information.
Main analyses
Figure 2 shows the predictive performance of the original XGBoost model when trained on data from 2013–2017 and evaluated (prediction of T2D two years ahead) on each subsequent calendar year from 2018 to 2023. The AUROC values were 0.84 (2018), 0.83 (2019), 0.87 (2020), 0.80 (2021), 0.84 (2022), 0.80 (2023).
Discrimination on unseen data over time. Points represent yearly AUROC values from 2018 to 2023. The inset depicts the same points zoomed in on the area marked by the dashed grey lines. The solid blue line on the inset shows a fitted linear regression (weighted by number of contacts in each year), and the shaded area displays the 95% confidence intervals for the regression-predicted mean AUROC at each year.

A weighted linear regression fitted to the yearly AUROC estimates from 2018 to 2023 showed an annual change in AUROC of –0.004 (SE:0.007; 95%CI: –0.024 to 0.016). Notably, the confidence interval for the slope included zero. ROC curves and confusion matrices for each evaluation year are shown in Supplementary Figures 1–6. Performance robustness across sex, age, and month of the year is shown in Supplementary Figures 7–12.
Model calibration was assessed across evaluation years (Supplementary Table 2, Supplementary Figure 13). The model consistently underestimated risk (CITL 0.18–0.47; O:E 1.19–1.57) with predictions being too extreme compared to observed outcomes (slope 0.75–0.95, except 2020 1.03).
The HbA1c sampling frequency was stable across evaluation years, with the median number of HbA1c measurements per patient being 1 (IQR 1-2) for the years from 2018 to 2022 and 1 (IQR 1-1) for 2023. The decrease for 2023 is likely due to the truncated data window for that year, as described in Table 1. Full distributions of HbA1c sampling frequencies for each year can be seen in Supplementary Figure 14. These show similar patterns, suggesting HbA1c testing practices did not change substantially over the evaluated years.
Secondary analyses
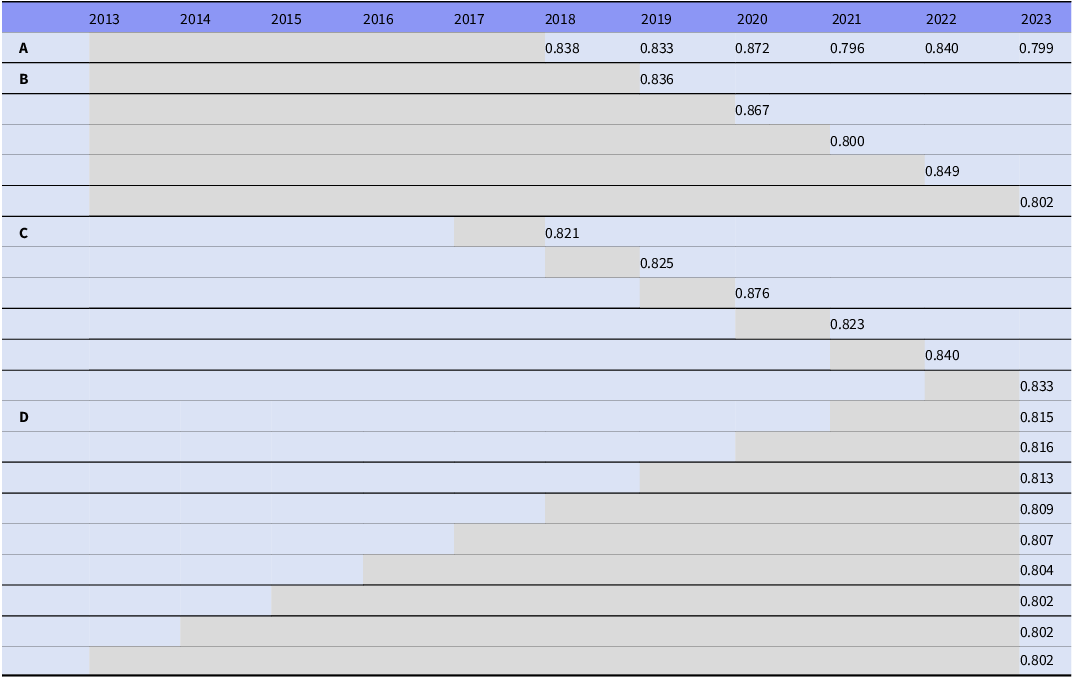
Table 2 summarises the results from the original model (A) and the secondary analyses across the different training data splits (B–D). Each row represents a trained model, while the grey shaded area represents the training data for that given model. The values in the cells are AUROC values for a given model evaluated on a given year (prediction of T2D two years ahead), as indicated by the columns.
AUROC values across the three secondary analyses

Table 2. Long description
The table has 4 rows and 11 columns. The columns are labeled with years from 2013 to 2023. The rows are labeled A, B, C, and D. Row A: 2017: 0.838, 2018: 0.833, 2019: 0.872, 2020: 0.796, 2021: 0.840, 2022: 0.799. Row B: 2016: 0.836, 2018: 0.867, 2019: 0.793, 2020: 0.800, 2021: 0.849, 2023: 0.802. Row C: 2015: 0.821, 2017: 0.825, 2019: 0.876, 2020: 0.823, 2021: 0.840, 2022: 0.833. Row D: 2020: 0.815, 2021: 0.816, 2022: 0.813, 2023: 0.809, 2023: 0.807, 2023: 0.804, 2023: 0.802.
Each column represents a year, and each row represents a trained model. The values are the AUROC values for a given model evaluated on a given year (prediction of T2D two years ahead). The grey shaded cells represent the training data (e.g. the first row shows the original model that has been trained on data from 2013 to 2017 and evaluated on each of the six consecutive years, respectively). A) The original static model, trained on data from 2013-2017. B) Annually trained models, trained on all preceding data. C) One-year models, trained on data from the previous year. D) Expanding retrospective training window models, trained on data from previous one to ten years, respectively.
Table 2B shows that annual re-estimation of model parameters (i.e. training model on all preceding data for a given evaluation year) yields AUROC values that are comparable to the original static model, with no consistent performance gains across evaluation years. No consistent advantage of cumulative training was observed, indicating that repeated training of the model with updated data did not improve discrimination on future data or make performance (i.e. AUROC) more stable compared to the original, static model.
Models trained exclusively on data from the immediately preceding year also perform comparably to the original and cumulatively trained models across evaluations years (Table 2C). While these one-year models were trained on substantially less data, their AUROC values ranged between 0.82 and 0.88, closely tracking the performance of the longer-history models (Table 2A and 2B). Notably, as seen in Figure 3, the year-to-year variability was slightly lower than that of the other approaches (similar direction of change but smaller fluctuations).
Model performance across training approaches (different look behind windows). Points represent yearly AUROC values. Black, empty points represent the original model, trained on data from 2013 to 2017. Grey, solid points represent the annually updated model, trained on all preceding data (2013-evaluation year). Dark blue, solid points represent the one-year models, trained only on data from the previous year.

Table 2D shows AUROC values when fixing the evaluation year to 2023 and gradually increasing the training data window backwards in time. From this, we observe an, almost consistent, decrease in discriminative performance as older data is included in the training set. Model trained on only the most recent year achieved AUROC value of 0.83, whereas eight, nine, or ten years of historical data yields AUROC values of 0.80.
Discussion
This study investigated the temporal stability of a previously trained model for the prediction of incident T2D in individuals with mental illness. Despite being trained only on data from 2013 to 2017, the model maintained good discrimination on the evaluated years from 2018 through 2023, with AUROC values remaining close to 0.80 or higher. The regression analysis showed a negligible and statistically insignificant trend in predictive ability over time. However, despite the model’s simplicity, and that all data are from the same, relatively small, Danish region, the model discrimination varied somewhat year-by-year (peaking at 0.87 in 2020 dipping to 0.80 in 2021), and the year-by-year fluctuations in AUROC values were larger than any systematic decline. Together, these results suggest a relatively high temporal stability in the model’s ability to predict T2D over time.
We are not aware of studies that have tested the temporal stability of prediction models for T2D in patients with mental illness that would allow for direct comparison. A recent systematic review of T2D risk prediction models reports that only 8 out of 65 reviewed studies performed temporal validation, and that these demonstrated relatively stable performance (Li et al., Reference Li, Tan, Song, Qiu, Zhou and Wen2025). This suggests that while temporal validation is increasingly recognised as important for the assessment of clinical utility in methodological clinical prediction modelling literature (Lopes et al., Reference Lopes, Yordanov, Ravelli, Houterman, Vis, de Mol, Marquering and Abu-Hanna2023; Ramspek et al., Reference Ramspek, Jager, Dekker, Zoccali and van Diepen2021; Toll et al., Reference Toll, Janssen, Vergouwe and Moons2008), it is not yet common practice in T2D risk prediction. Several other studies conduct temporal validation for other prediction models related to diabetes or closely related outcomes using a similar approach of testing models on a separate dataset comprising data from more recent calendar years that have not been used for model training. These include models predicting risk of gestational diabetes in early pregnancy (Cooray et al., Reference Cooray, Silva, Enticott, Dawadi, Boyle, Soldatos, Paul, Versace and Teede2023), risk of conversion to T2D in women with a history of gestational diabetes (protocol only) (Versace et al., Reference Versace, Boyle, Janus, Dunbar, Feyissa, Belsti, Trinder, Enticott, Sutton, Speight, Boyle, Cooray, Beks, O’Reilly, Mc Namara, Rumbold, Lim, Ademi and Teede2025), three-year diabetic kidney disease risk in T2D patients (Tourkmani et al., Reference Tourkmani, Al-Harbi, Alghamdi, Youzghadli, Alosaimi and Azzam2026), and risk of adverse outcomes in inpatients with diabetes (Adderley et al., Reference Adderley, Mallett, Marshall, Ghosh, Rayman, Bellary, Coleman, Akiboye, Toulis and Nirantharakumar2018). The studies report reasonable to good temporal stability in model discrimination when tested on more recent data from the same data sources.
A key difference between the temporal validation performed in the studies described above and the present study lies in the assessment of stability over time. Prior studies typically assess performance on a single temporally separated validation dataset (Adderley et al., Reference Adderley, Mallett, Marshall, Ghosh, Rayman, Bellary, Coleman, Akiboye, Toulis and Nirantharakumar2018; Cooray et al., Reference Cooray, Silva, Enticott, Dawadi, Boyle, Soldatos, Paul, Versace and Teede2023; Li et al., Reference Li, Tan, Song, Qiu, Zhou and Wen2025; Tourkmani et al., Reference Tourkmani, Al-Harbi, Alghamdi, Youzghadli, Alosaimi and Azzam2026; Versace et al., Reference Versace, Boyle, Janus, Dunbar, Feyissa, Belsti, Trinder, Enticott, Sutton, Speight, Boyle, Cooray, Beks, O’Reilly, Mc Namara, Rumbold, Lim, Ademi and Teede2025), whereas we evaluate performance across six consecutive calendar-year test sets, allowing for a direct assessment of performance stability and potential drift over time. A study of cardiovascular risk prediction models adopted a similar year-by-year temporal validation strategy and demonstrated gradual performance decline over time (as measured via AUROC), highlighting the value of repeated temporal validation when longitudinal data are available (Li et al., Reference Li, Salimi-Khorshidi, Rao, Canoy, Hassaine, Lukasiewicz, Rahimi and Mamouei2022). Together, these findings illustrate the feasibility and importance of systematic temporal validation.
The observed temporal stability in this study is notable as the model was applied to data from up to a decade after the start of the training period. This robustness is likely driven by the small, restricted feature set – i.e., sex, age, and mean HbA1c in the last two years – that may capture more stable and relatively time-invariant risk factors for T2D. In contrast, models relying on more complex data, e.g., diagnostic codes, medication history, or high-dimensional clinical features may be more sensitive to changes in clinical practice, potentially making the simple model investigated here inherently less vulnerable to temporal data shift (Brosula et al., Reference Brosula, Corbin and Chen2024; Chen et al., Reference Chen, Qian, Pan and Li2025).
Across all models (original and secondary analyses), a peak in model performance can be observed in 2020, followed by a drop in 2021. One might speculate that this is due to the COVID-19 pandemic, which did affect the Psychiatric Services of the Central Denmark Region (Kølbæk et al., Reference Kølbæk, Nørremark and Østergaard2020) and the patients receiving treatment in these services (Kølbæk et al., Reference Kølbæk, Gil, Schmidt, Speed and Østergaard2023, Reference Kølbæk, Jefsen, Speed and Østergaard2022; Rohde et al., Reference Rohde, Jefsen, Nørremark, Danielsen and Østergaard2020), though it is unclear why COVID-19 should make it easier to discriminate between high- and low-risk patients when it comes to T2D.
The secondary analyses using alternative training data splits yielded similar AUROC values to the original static model across evaluation years. Cumulative training (i.e. annual training of a new model on all preceding data for each evaluation year) did not consistently improve discrimination compared to the original, static model. This suggests that, in this setting, gradual accumulation of more training data offers little benefit over the original five-year training data set and new estimations of model parameters may not be necessary to preserve model performance. Similarly, models trained only on data from the immediately preceding year yielded AUROC values comparable to those from the models trained on five or more years of data. This is likely a result of the temporally defined data splits, where patients can appear in both training and test sets at different time points, emulating a real-world deployment scenario in which a model is repeatedly applied to data from current patient trajectories. In this setting, the short-term data seems to contain substantial information about the population to be predicted in the next year, making longer historical data less critical for prediction. Results from the models trained on expanding retrospective training windows further supports this interpretation as adding older data did not improve, but rather slightly reduced performance, suggesting that historical data may dilute contemporary signal.
The results of the sensitivity analysis clearly point against model stability being driven by having data from the same patient being present in both the training and test sets. The observation of consistently better T2D prediction for patients only appearing in the test sets may seem counterintuitive but is likely driven by relatively lower T2D incidence in those appearing both in the training and test sets, by design, due to prevalent cases of T2D being excluded, and patients appearing both in the training and test sets having a longer follow-back for prevalent T2D than those appearing only in the test sets. Consequently, patients appearing only in the test sets apparently have a T2D risk profile that is more readily discriminated by the parsimonious prediction model (sex, age and mean HbA1c within the past two years).
There are limitations to this study that should be taken into account by the reader. First, the present study evaluates a previously developed T2D risk prediction model (Bernstorff et al., Reference Bernstorff, Hansen, Enevoldsen, Damgaard, Hæstrup, Perfalk, Danielsen and Østergaard2025) and, therefore, inherits methodological choices and associated limitations of that model. As the current work represents a temporal validation, we do not reiterate those here. Second, we focused on a parsimonious risk prediction model for T2D in patients with mental illness using only three predictors (sex, age, and mean HbA1c). As such, the findings may not generalise to other diseases, populations, or models based on larger or more heterogeneous feature sets. Third, the temporal validation was performed retrospectively. Although the design mimics real-world deployment by evaluating performance on new incoming data, it does not assess how actual model implementation might influence clinical behaviour or model predictions over time. Fourth, we focused primarily on model discrimination (AUROC) as a measure of performance. While discrimination reflects the model’s ability to differentiate patients according to risk, it does not fully capture agreement between observed and predicted risk. Calibration was assessed as a supplementary analysis and shows underprediction across all evaluation years. Calibration fluctuates, though the direction of miscalibration remains consistent, and no clear monotonic decline can be observed over time. This suggests that the observed miscalibration reflects a baseline limitation of the original model rather than a temporal drift in performance. As such, future work could investigate whether a single recalibration of the original model would suffice to address the observed underprediction across evaluation years.
In conclusion, the findings of this study indicate that a T2D prediction model, based solely on EHR data, is reasonably stable over time and is robust to different temporal training strategies. In this setting, neither updates of training data with contemporary data nor long historical data appeared to benefit model performance, with training on recent data alone being sufficient to maintain predictive ability. The observed temporal stability bodes well for potential clinical implementation, where the model may support early detection and tailored interventions to reduce the risk of T2D. Nevertheless, despite maintaining good discrimination across all evaluation years, we show that even a very simple model’s performance varies over time, highlighting the importance of temporal validation during model development, as well as continued monitoring after implementation.
Supplementary material
The supplementary material for this article can be found at https://doi.org/10.1017/neu.2026.10105.
Data availability statement
The data from the study cannot be shared according to Danish law.
Acknowledgements
The authors are grateful to Martin Bernstorff for his work in the initial phase of this study prior to obtaining his PhD from Aarhus University.
Author contributions
Frida Hæstrup: Writing – original draft, Methodology, Investigation, Formal analysis, Visualisation, Conceptualisation. Andreas Aalkjær Danielsen: Writing – review & editing, Methodology, Investigation, Conceptualisation, Supervision, Project administration. Søren Dinesen Østergaard: Writing – review & editing, Methodology, Investigation, Conceptualisation, Supervision, Funding Acquisition, Project administration.
Funding statement
The study is supported by grants to Søren D. Østergaard from the Lundbeck Foundation (grant No. R344-2020-1073), the Danish Cancer Society (grant No. R283-A16461), the Central Denmark Region Fund for Strengthening of Health Science (grant No. 1-36-72-4-20), the Danish Agency for Digitisation Investment Fund for New Technologies (grant No. 2020-6720), and Independent Research Fund Denmark (grant No. 4309-00028B). The funders of the study had no role in design and conduct of this study; collection, management, analysis, and interpretation of the data; and preparation, review, or approval of the manuscript or the decision to submit for publication.
Competing interests
Outside this project, Søren D.Østergaard has received grants from The Novo Nordisk Foundation (grant no. NNF20SA0062874), The Lundbeck Foundation (grant no. R358-2020-2341), and Independent Research Fund Denmark (grant no. 2096-00055B); received the 2020 Lundbeck Foundation Young Investigator Prize; owns or has owned units of mutual funds with stock tickers DKIGI, IAIMWC, SPIC25 KL, WEKAFKI, and DKIEUIXBNP; and owns or has owned units of exchange traded funds with stock tickers BATE, TRET, QDV5, QDVH, QDVE, SADM, IQQH, USPY, EXH2, 2B76, IS4S, OM3X, EUNL, MCHI and SXRV. The remaining authors report no competing interests.
Declaration of use of generative AI
During the preparation of this work the authors used ChatGPT (OpenAI) to assist with language editing and improve clarity. After using this tool/service, the authors reviewed and edited the content as needed and take full responsibility for the content of the published article.




 Open access

