Introduction
Beef cattle farms in most European dry mountain areas may have long indoor housing periods due to harsh climatic conditions. The adaptation of production systems to these environments, with high variability in the quantity and quality of forage resources, can be attained by the choice of calving and weaning dates. Early weaning could be a technically and economically viable practice, as it has been proposed when there is feed shortage or when available grass is of poor quality (Neville and McCormick, Reference Neville and McCormick1981). Casasús et al. (Reference Casasús, Bernués, Sanz, Riedel and Revilla2005) reported that forest pastures were efficiently used in late winter and early spring by dry cows, hence autumn-calving cows whose calves had been early weaned could graze these low-quality resources, allowing for a reduction of the housing period of the dams while their calves are intensively fed. Besides, grazing such areas in this season constitutes an effective management tool against herbage accumulation and shrub encroachment (Casasús et al., Reference Casasús, Bernués, Sanz, Villalba, Riedel and Revilla2007). In mountain production systems, when spring-born calves were either early weaned or traditionally weaned and thereafter fed intensive diets, early-weaned calves had greater growth rates between weaning dates than their lactating counterparts on pasture. However, during finishing, traditionally weaned calves showed compensatory growth and had improved efficiency. Despite the absence of differences in slaughter weight, early weaning improved dressing percentage (Blanco et al., Reference Blanco, Ripoll, Albertí, Sanz, Revilla, Villalba and Casasús2007). Nevertheless, calf management might differ with calving season, and thus the effect of early weaning on calf performance could be different with autumn-born v. spring-born calves.
Offering concentrates to nursing calves has been used to compensate for the decrease of the dam’s milk production and to improve the weight gains of the calves (e.g. Martin et al., Reference Martin, Lemenager, Srinivasan and Alenda1981; Prichard et al., Reference Prichard, Hargrove, Olson and Marshall1989; Myers et al., Reference Myers, Faulkner, Ireland, Berger and Parrett1999). In this sense, this practice is more efficient than providing extra feed to the dam for increased milk yield (Parkins et al., Reference Parkins, Morris and Wilton1977; Casasús et al., Reference Casasús, Bernués, Sanz, Alzón and Eguinoa2001b). Other benefits of this feeding strategy include the reduction of weaning stress through familiarisation with concentrates as feedstuffs (Martin et al., Reference Martin, Lemenager, Srinivasan and Alenda1981) and decreased morbidity in the feedlot (Myers et al., Reference Myers, Faulkner, Ireland, Berger and Parrett1999). Carry-over effects of pre-weaning concentrate feeding on finishing performance are controversial; some studies reported slight or no effects on weight gains in the subsequent phase (Myers et al., Reference Myers, Faulkner, Ireland, Berger and Parrett1999; Fluharty et al., Reference Fluharty, Loerch, Turner, Moeller and Lowe2000), whereas Tarr et al. (Reference Tarr, Faulkner, Buskirk, Ireland, Parrett and Berger1994) described deleterious effects on performance in the finishing phase. Moreover, offering starter feed to nursing calves has been reported to reduce the length of the fattening phase without affecting carcass characteristics (Corah and Bishop, Reference Corah and Bishop1975; Myers et al., Reference Myers, Faulkner, Ireland, Berger and Parrett1999; Casasús et al., Reference Casasús, Bernués, Sanz, Alzón and Eguinoa2001b) or even improving carcass yield grade (Faulkner et al., Reference Faulkner, Hummel, Buskirk, Berger, Parrett and Cmarik1994). However, providing a starter concentrate implies additional feed costs, and the profitability of this practice depends on the cost of weight gain in relation to the value of calves when they reach slaughter weight (Corah and Bishop, Reference Corah and Bishop1975).
IGF-I and leptin are hormones involved in protein and fat deposition. Circulating IGF-I concentrations depend on energy intake (Elsasser et al., Reference Elsasser, Rumsey and Hammon1989) and leptin concentrations on increases of adiposity and, to a lower extent, on nutrition (Chilliard et al., Reference Chilliard, Bocquier, Delavaud, Faulconnier, Bonnet, Guerre Millo, Martin and Ferlay1999). Therefore, as the different management strategies modify the diets given to the calves, the secretion of these hormones and the growth patterns might be altered.
The objective of the study was to assess the effect of early weaning and pre-weaning concentrate feeding on performance, circulating IGF-I and leptin concentrations, carcass and meat quality and on the economic performance of autumn-born beef calves.
Material and methods
Animals and management
The study was conducted in La Garcipollera Research Station, in the mountain area of the central Pyrenees (Spain, 42°37′ N, 0°30′W; 945 m a.s.l.). Fifty-six Parda de Montaña (beef breed derived from Brown Swiss) cows calved in the autumn (average calving date 21 October), but only male calves and their dams (28 pairs) were used for this study. Cow–calf pairs were randomly assigned to one of the four management strategies in a 2 × 2 factorial experiment, combining two ages at weaning, day 90 (early weaning, EW) and day 150 (traditional weaning, TW), and two levels of pre-weaning concentrate feeding, i.e. offering a starter concentrate mix (S) or not (NS) during nursing. Therefore, the four management strategies tested were EWS, EWNS, TWS and TWNS.
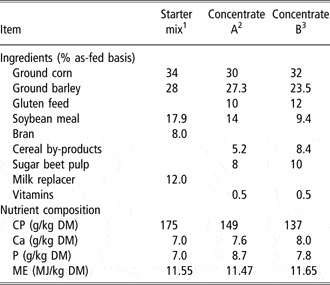
Cows and calves were group-, loose-housed during the entire nursing period, in a separate pen for each management strategy. Dams were group-fed daily 12 kg per head of a total mixed ration (TMR) (54% forages, 46% grains, by-products and vitamin and mineral supplements, 889 g/kg DM, 8.61 MJ ME/kg DM, 125 g CP/kg DM) to meet their nutritive requirements for maintenance and for an estimated milk production of 9 kg/day. Calves were kept in straw-bedded cubicles adjacent to their dams and allowed to suckle them twice daily for 30 min at 0800 and 1600 h. All calves had access to bed straw to ensure an adequate rumen development. EWS and TWS calves were offered on a group basis a ground starter concentrate mix (Table 1) ad libitum in a trough during the nursing period.
Composition of the diets fed to the calves throughout the experimentFootnote †

† Abbreviations are: CP = crude protein; DM = dry matter; ME = metabolisable energy.
1 Fed to EWS and TWS calves from birth to weaning; 2Fed to calves from weaning to 350 kg; 3Fed to calves from 350 kg to slaughter.
Before the calves reached 3 months of age, they were vaccinated against RSV, PI3 and Mannheimia (Pasteurella) haemolytica (Bovipast RSP; Intervet, Milton Keynes, UK), IBR (Ibraxion, Merial, Lyon, France) and Chlostridium perfringens (Polibascol, Schering-Plough, Kenilworth, NJ, USA).
At day 90, EWS and EWNS calves were weaned and transported to a feedlot facility in CITA Research Station (41°43′N, 0°48′W; 225 m a.s.l.), while their dams were turned out to forest pastures, where they received 7.6 kg of the TMR per day during 35 days, due to the low forage availability and harsh weather conditions. At day 150, TWS and TWNS calves were weaned and transported to the same feedlot as their counterparts, and their dams were turned out to forest pastures. In the feedlot, calves were randomly assigned to one of two pens, which had an automatic feeder station (ALPRO®; Alfa Laval Agri, Tumba, Sweden). Therefore, each automatic feeder was shared by 14 calves.
During the first week after weaning, calves received concentrate A (Table 1) in gradually increasing amounts until ad libitum intake was reached, in order to adapt to feedlot conditions. Calves were fed this concentrate until they reached an average live weight of 350 kg. From this moment to slaughter, the calves were fed concentrate B. Calves received both powder concentrates and barley straw on an ad libitum basis.
When calves reached 450 kg live weight, on average, they were slaughtered in a commercial abattoir (MercaZaragoza, Zaragoza, Spain) 6 km from the Research Station. They were transported on the slaughter day to minimise pre-slaughter stress. The animals were stunned by captive bolt pistol and dressed according to standard commercial practice.
Measurements
During the entire experiment, calves were weighed weekly at 0800 h without prior deprivation of feed and water. These data were used to calculate average daily gain (ADG) for periods from day 0 to 90, day 90 to 150 and day 150 to slaughter (finishing period) by linear regression of weight on day. The same method was used for calculating monthly ADG.
Milk intake was assumed to be equal to cow milk yield as estimated with the oxytocin and machine milking method (Le Du et al., Reference Le Du, Macdonald and Peart1979) at day 45, 90 and 150, the latter only for TW calves. A sample of milk from each cow and milking day was collected for chemical analysis by infrared scan (Milkoscan 255 AB; Foss Electric Ltd, Warrington, UK). Milk yield was corrected to 4% fat content with the formula of Gaines (Reference Gaines1928): kg milk (4%) = kg milk (0.4 + 0.15 × %fat). Energy content of 1 kg of 4% corrected milk was assumed to be 3.14 MJ ME (INRA, 1978).
Concentrate intake was recorded daily in the nursing period on a per-group basis, and during the feedlot phase (weaning to slaughter) automatically on an individual basis. These data were used to estimate daily dry matter intake (DMI), total DMI, DMI per kg of metabolic weight and feed-to-gain ratio for 30-day periods and for the periods from day 90 to 150 and from day 150 to slaughter.
Blood sampling and hormone analyses
Calves were bled at day 90, day 150 and 1 day before slaughter at 0800 h by puncture of the V. mediana caudalis to determine IGF-I and leptin concentrations. Blood was allowed to clot for 24 h; the serum obtained was harvested and frozen at −20°C until analysis. Circulating IGF-I concentrations were quantified using a commercial enzyme immunoassay (EIA) kit (OCTEIA® IGF-I; IDS, Boldon, UK), with intra- and inter-assay coefficients of variation (CV) of 3.6% and 3.4%, respectively. Serum leptin concentrations were determined with a competitive EIA for leptin in domestic animals validated for cattle (Sauerwein et al., Reference Sauerwein, Heintges, Hennies, Selhorst and Daxenberger2004). Intra- and inter-assay CVs were 6.6% and 11.5%, respectively.
Slaughter and sampling procedures
Immediately after slaughter, hot carcass weight was recorded. Dressing percentage was calculated by dividing hot carcass weight by slaughter live weight, which was obtained on the day before slaughter. After 24 h of chilling at 4°C, carcasses were graded using the European grading systems (Directives (ECC) no 1208/81 and no 2237/91). Carcass conformation was assessed with an 18-point scale (from 1 = poorest to 18 = best) and fatness score with a 15-point scale (from 1 = leanest to 15 = fattest).
To determine meat quality, the M. longissimus dorsi was dissected between the 6th and the 11th rib of each left half carcass and was sliced into steaks. Ultimate pH (24 h) was measured with a Crison pHmeter (Crison Instruments, SA, Barcelona, Spain). Lean meat colour (CIE L* (lightness), a* (redness) and b*(yellowness)) was measured in 2 cm steaks after 24 h of air exposure (Albertí et al., Reference Albertí, Panea, Ripoll, Sañudo, Olleta, Negueruela, Campo and Serra2005) with a spectrophotometer (Minolta CM-2600d, Konica Minolta Holdings, Inc., Osaka, Japan). Hue angle value (arc tg b*/a* × 57.29) was calculated with these parameters. For texture analysis, 3.5 cm steaks were aged at 4°C for 8 days and subjected to Warner-Bratzler meat determination with an Instron shear machine (Model 5543, Instron Limited, Barcelona, Spain). Steaks were boiled in a water bath (75°C) to an internal temperature of 70°C. When steaks cooled off, a minimum of ten strips were cut with 10 × 10 mm2 cross-section with the fibre direction parallel to a long dimension of at least 30 mm (Honikel, Reference Honikel1998). Values for toughness (energy needed per unit of volume to shear the sample below the shear blade until the point of maximum load) and maximum stress (maximum load per unit of cross-section) were determined. For meat chemical analysis, 2 cm steaks were minced and freeze-dried, obtaining the dry matter as the difference between weight before and after freeze-drying. After this, the minced samples were ground for protein and intramuscular fat determination. Protein was determined following the Dumas procedure (AOAC, 1995) and fat following the Ankom procedure (AOCS Am 5-04). Fatty acid profile was obtained following the procedures described by Tor et al. (Reference Tor, Estany, Francesch and Cubiló2005), modified for beef meat, as fatty acids were quantified by incorporating an internal standard, 1,2,3-tritridecanoylglycerol (tritridecanoin c13:0), into each sample. Proportions of poly-unsaturated (PUFA), mono-unsaturated (MUFA) and saturated (SFA) fatty acids and the PUFA/SFA ratio were obtained from individual fatty acid percentages.
Economic analysis
The four management strategies were economically compared considering only the technical and economic aspects that varied among strategies. From day 90 to 150, the TMR intake and housing period of the cows were different, and consequently the associated expenses differed. Other aspects that changed among management strategies were: calf concentrate intake and feed expenses; days at feedlot and yardage costs; carcass weight, conformation score and price of the calf at slaughter. The economic margin was calculated as the difference between income and the above-described costs. Actual selling prices of carcasses, TMR and concentrates during 2004 were considered.
Statistical Analysis
Weight, IGF-I and leptin data on different dates (0, 90 day, 150 day and slaughter) and ADG, milk and concentrate intake, feed-to-gain ratio in different periods (day 0 to day 90, day 90 to day 150 and day 150 to slaughter) were analysed using the MIXED procedure (SAS Institute Inc., Cary, NC, USA) with an unstructured covariance matrix for repeated measures including age at weaning (EW v. TW), pre-weaning concentrate feeding (S v. NS), time or period and their interactions as fixed effects, and animal as the random effect. A similar analysis was performed to analyse growth and feed intake during the finishing phase with data from 30-day periods. Carcass weight, conformation and fatness score were tested by analysis of variance (ANOVA) using the GLM procedure with age at weaning, pre-weaning concentrate feeding and their interaction as fixed effects with slaughter weight as covariate. Energy content of the diet, dressing percentage, meat characteristics and economic results were tested by ANOVA using the GLM procedure with age at weaning, pre-weaning concentrate feeding and their interaction as fixed effects. Least square means (LS Means) were estimated and differences between LS Means were tested with a t-test. Pearson’s correlation coefficients between variables were calculated. For all tests, the level of significance was set at 0.05. Trends were discussed when P values were <0.10.
Tables show the LS Means for the four management strategies (interaction between age at weaning and pre-weaning concentrate feeding) and the P values for the fixed effects and their interaction. Only when the interaction was not significant, individual effects of age at weaning and pre-weaning concentrate feeding are commented in the text.
Data from one calf were removed from the statistical analysis as it was affected by lameness (for causes not attributable to treatment) in the finishing phase, showing severe depression of its performance. Several performance parameters were below 3 s.d. of the mean and were considered outliers, therefore all data from this calf were discarded from the processed data set. However, the rest of the calves did not have any health problems during the finishing phase.
Results
Calf Performance
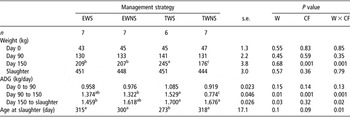
Weight at day 90 did not differ with age at weaning (132 and 136 kg for EW and TW calves, respectively), pre-weaning concentrate feeding (135 and 132 kg for S and NS calves, respectively) or their interaction (Table 2). ADG from day 0 to 90 was not affected by age at weaning (0.967 v. 1.002 kg/day for EW and TW, respectively), pre-weaning concentrate feeding (1.022 v. 0.947 kg/day for S and NS calves, respectively) or their interaction, either. When gains were analysed on a monthly basis, no difference was observed due to pre-weaning concentrate feeding during the first 2 months of life, but gains in the third month were improved when the starter was provided (1.087 v. 0.907 kg/day for S and NS calves, respectively; s.e. = 0.0655, P = 0.01). Corrected milk intake at day 90 was similar for S and NS calves (7.8 v. 7.6 kg/day, respectively; s.e. = 1.68, P = 0.76). In addition, S calves had an average concentrate intake of 0.4 kg DM/day during the 3rd month, while before the third month, concentrate intake was negligible.
Performance from birth to slaughter according to management strategyFootnote †

† Abbreviations are: EWS = early weaned calves with pre-weaning concentrate feeding; EWNS = early weaned calves with no pre-weaning concentrate feeding; TWS = traditionally weaned calves with pre-weaning concentrate feeding; TWNS = traditionally weaned calves with no pre-weaning concentrate feeding; W = age at weaning; CF = pre-weaning concentrate feeding; W × CF = management strategy (age at weaning × pre-weaning concentrate feeding); ADG = average daily gain.
a,b,c Mean values within a row lacking a common superscript letter differ among management strategies (P < 0.05).
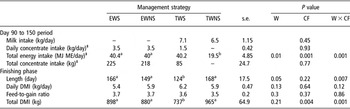
From day 90 to 150, weight gains were affected by management strategy (Table 2), TWNS calves had a substantially lower ADG than their counterparts, and TWS calves had the highest weight gains. These differences in weight gains therefore resulted in weight differences at day 150, with TWS calves being the heaviest and TWNS calves the lightest. Concentrate intake improved the performance of TWS calves as both groups of TW calves had a similar milk intake (Table 3). Both groups of EW calves had the same daily concentrate DMI at the feedlot (Table 3). Consequently, TWNS calves had the lowest energy intake from their diets, while the rest of the management strategies provided similar energy intakes (Table 3). Both groups of EW calves had similar and very low feed-to-gain ratio in the feedlot from day 90 to 150 (2.58 and 2.61 for EWS and EWNS calves, respectively; s.e. = 0.324, P = 0.75), and also similar total DMI in this period (Table 3).
Intake and feed conversion from day 90 to 150 and during the finishing phase (day 150 to slaughter) according to management strategyFootnote †

† Abbreviations are as in Table 2, and ME = metabolisable energy; DMI = dry matter intake.
a,b Mean values within a row lacking a common superscript letter differ among management strategies (P < 0.05).
‡ Statistical analysis not performed on TWS calves as animals were group-fed from day 90 to 150.
During the finishing phase (day 150 to slaughter), TWS, TWNS and EWNS had similar weight gains, and the gains of EWS calves were significantly lower than those of both groups of TW calves and tended to be lower than those of EWNS calves (P = 0.08). Due to the differences in weight at day 150 and the ADG during the finishing phase, TWS calves were 27 to 45 days younger when they reached the target slaughter weight than the other groups (Table 2).
Overall daily DMI during the finishing phase was unaffected by age at weaning (5.7 v. 6.0 kg/day for EW and TW calves, respectively), pre-weaning concentrate feeding (5.8 v. 5.9 kg/day for S and NS calves, respectively) or their interaction (Table 3). Similarly, feed-to-gain ratio was not affected by age at weaning (3.7 v. 3.6 for EW and TW calves, respectively), pre-weaning concentrate feeding (3.7 v. 3.6 for S and NS calves, respectively) or their interaction (Table 3). Total DMI in this period was affected by management strategy, as TWS calves had 15% to 25% lower concentrate intake than the rest of the groups (P = 0.001) (Table 3) due to the shorter finishing period.
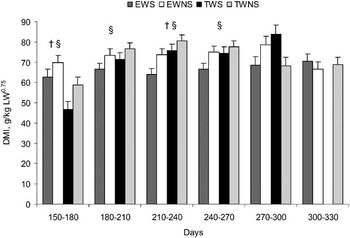
When daily feed intake across 30-day periods was studied, only marginal differences associated with age at weaning were observed (Figure 1). During the first month of the finishing phase, EW calves had a higher concentrate intake than did TW calves (66.3 v. 52.9 g/kg LW0.75, respectively; s.e. = 1.67; P = 0.001), while during the third month EW calves had a lower intake than their TW counterparts (69.8 v. 77.1 g/kg LW0.75, respectively; s.e. = 1.15, P = 0.01). From day 150 to 270, pre-weaning concentrate feeding had a larger effect on concentrate intake (Figure 1), because NS calves had a higher concentrate intake than S calves, especially during the first (64.4 v. 59.4 g/kg LW0.75, respectively; s.e. = 1.67; P = 0.004) and 3rd (77.1 v. 69.8 g/kg LW0.75, respectively; s.e. = 1.15, P = 0.03) months.
Dry matter intake over 30-day periods during the finishing phase (day 150 to slaughter) according to management strategy. †: Significant effect of age at weaning. §: Significant effect of pre-weaning concentrate feeding.

When the whole feedlot period (from weaning to slaughter) was studied, EWS calves were the longest on feed (226 day), followed by EWNS (209 day), TWNS (168 day) and TWS calves (124 day) (s.e. = 16.1, P = 0.001). Accordingly, total concentrate DMI from birth to slaughter was different among the four management strategies, with both groups of EW calves presenting the highest and TWS calves the lowest intakes (1166, 1099, 965 and 862 kg for EWS, EWNS, TWNS and TWS calves, respectively; s.e. = 75.6, P = 0.04).
Serum IGF-I and leptin concentrations
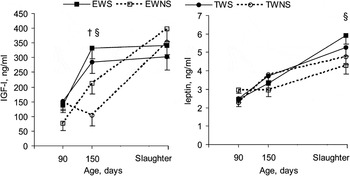
There was no interaction among age at weaning, pre-weaning concentrate feeding and sampling date for serum IGF-I concentrations (Figure 2), but there were significant interactions between age at weaning × sampling date (P = 0.02) and between pre-weaning concentrate feeding × sampling date (P = 0.002). These interactions imply that the time course of IGF-I concentrations differed between the EW and TW calves, and between S and NS calves. Serum IGF-I concentrations at day 90 were similar, but at day 150 IGF-I concentrations presented differences related to age at weaning and pre-weaning concentrate feeding. Early-weaned calves had higher IGF-I concentrations than TW calves (272 v. 194 ng/ml for EW and TW calves, respectively; s.e = 35.0, P = 0.03). On the other hand, circulating IGF-I concentrations of S calves doubled those of NS calves (308 v. 158 ng/ml, respectively; s.e. = 35.0, P = 0.001). Despite these differences found at day 150, IGF-I concentrations at slaughter were again alike.
Evolution of IGF-I and leptin concentrations according to management strategy. †: Significant effect of age at weaning. §: Significant effect of pre-weaning concentrate feeding.

In the present study, IGF-I at day 90 and ADG from birth to day 90 were related (r = 0.63, P = 0.001), and IGF-I at day 150 was also related with ADG from day 90 to 150 (r = 0.62, P = 0.001). In contrast, IGF-I at day 150 showed an inverse relationship with ADG during the finishing phase (r = −0.46, P = 0.04). Moreover, IGF-I at day 150 was correlated to feed-to-gain ratio during the finishing phase (r = 0.57, P = 0.002).
There was no interaction between age at weaning × pre-weaning concentrate feeding × sampling date (Figure 2) or by age at weaning × sampling date for circulating leptin concentrations. However, the time course of leptin concentrations differed between pre-weaning concentrate feeding treatments (P = 0.03). Leptin concentrations were not different between S and NS calves at day 90 and day 150, but at slaughter S calves had almost 20% higher leptin values than NS calves (5.6 v. 4.5 ng/ml, respectively; s.e. = 0.36, P = 0.04). Leptin concentrations before slaughter were correlated with fatness score (r = −0.44, P = 0.02), but not with intramuscular fat.
Carcass and meat quality
Carcass characteristics were not influenced by pre-weaning concentrate feeding, but age at weaning and the interaction between both management strategies had significant effects on these traits. Despite the absence of differences in slaughter weight (Table 2), EW calves had heavier carcasses than TW calves (262 v. 256 kg, respectively), resulting in higher dressing percentages in EW calves (58.3% v. 57.0% for EW and TW calves, respectively). Early weaning also increased fatness score (5.5 v. 4.8 for EW and TW calves, respectively). Carcass conformation was different among the four management strategies with TWNS calves showing the worst conformation (Table 4).
Carcass quality according to management strategyFootnote †

† Abbreviations are as in Table 2.
a,b Mean values within a row lacking a common superscript letter differ among management strategies (P < 0.05).
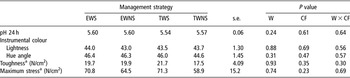
Meat pH, colour, toughness and maximum stress did not differ with pre-weaning concentrate feeding or management strategy (Table 5). Chemical composition presented little but significant differences due to age at weaning. Early weaning increased dry matter (24.9% v. 24.2% for EW and TW calves, respectively; s.e. = 0.58, P = 0.02) and protein on a fresh matter basis (23.4% v. 22.8% for EW and TW calves, respectively; s.e. = 0.45, P = 0.02) but not on a dry matter basis (P = 0.45). Age at weaning had no effect on intramuscular fat on a fresh matter basis (1.8% v. 1.7% for EW and TW calves, respectively; s.e. = 0.42, P = 0.53). Concerning the fatty acid profile, it was unaffected by management strategy, and neither were total SFA, MUFA, PUFA or PUFA/SFA ratio (Table 6).
Meat physical characteristics according to management strategyFootnote †

† Abbreviations are as in Table 2.
a After 7 days of ageing.
Meat total SFA, MUFA, PUFA and PUFA/SFA ratio according to management strategyFootnote †

† Abbreviations are as in Table 2, and SFA = saturated fatty acids; MUFA = mono-unsaturated fatty acids; PUFA = poly-unsaturated fatty acids.
Economic performance
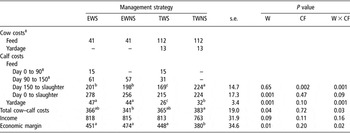
Cows were managed differently in the period from day 90 to 150 depending on the age of calf at weaning, i.e. cows whose calves had been early weaned grazed forest pastures and were supplemented daily with 7.6 kg TMR for the first month after weaning, while lactating cows were indoors and received 12 kg TMR per day, which led to different costs. Lactating cows had higher yardage expenses and feed costs than those cows whose calves had been early weaned (Table 7).
Economic performance according to management strategy (euros)Footnote †

† Abbreviations are as in Table 2.
a,b Mean values within a row lacking a common superscript letter differ among management strategies (P < 0.05).
‡ Statistical analysis not performed as animals were group-fed.
From birth to day 90, EWS and TWS calves had a low total concentrate intake, which had an associated feed cost of €15. In the period from day 90 to 150, EWS and EWNS calves had similar feed costs, which were higher than those of TWS calves, while TWNS calves had no concentrate feed costs. During the finishing phase, TWNS calves had the highest feed costs, whereas TWS had the lowest. Due to the different time on feed of each management strategy, yardage expenses were different, with EWS and EWNS having the highest costs and TWS the lowest. These different costs in the different periods resulted in EWS and EWNS calves having 16% to 34% higher total costs than TWS and TWNS calves. When cow and calf total costs were added up, TWNS strategy originated the highest costs, and EWNS strategy the lowest (Table 7).
Income yielded per calf at slaughter was not significantly different among the different management strategies, although TWNS calves produced €50 less due to their slightly lower carcass weight and conformation.
The economic margin varied among management strategies, with the TWNS strategy being the least favourable, whereas there were no differences among the other three management strategies tested.
Discussion
Calf performance
Calves that are offered starter feed during the nursing period are able to maintain their growth as cow’s milk production declines some weeks after parturition. Bartle et al. (Reference Bartle, Males and Preston1984) reported a beneficial effect of such starter feed offered from the ninth week post partum when daily milk yield was 5 kg. However, in higher producing cows, the benefit from this starter feed was delayed to the fourth month (Prichard et al., Reference Prichard, Hargrove, Olson and Marshall1989). Indeed, in the same breed as the one used in the current experiment, Casasús et al. (Reference Casasús, Bernués, Sanz and Revilla2001a) also reported different weight gains from the third month between calves offered concentrates or not during nursing, which was due, as in the current study, to the fact that concentrate intake of calves was minor during the first 2 months, but it increased steadily from the third month onwards.
Differences in weight gains from day 90 to 150 were evident, because energy intake from the diet was different in the four management strategies. Specifically, TWS calves had the highest weight gains, which almost doubled those of TWNS calves that were only fed on their dams’ milk. The positive effect of provision of concentrate to calves late in the suckling period had already been reported in 5-month old (Faulkner et al., Reference Faulkner, Hummel, Buskirk, Berger, Parrett and Cmarik1994) and 7-month old steers (Myers et al., Reference Myers, Faulkner, Ireland, Berger and Parrett1999; Fluharty et al., Reference Fluharty, Loerch, Turner, Moeller and Lowe2000). On the other hand, EWS and EWNS calves were given ad libitum the same intensive diet and had similar performance, because they had a comparable energy intake. Hence, when calves are weaned at 3 months of age, short-term pre-weaning concentrate feeding does not influence performance in the subsequent feedlot phase, as Tarr et al. (Reference Tarr, Faulkner, Buskirk, Ireland, Parrett and Berger1994) described. The better performance of TWS calves when compared with their counterparts, contradicts other results where traditionally weaned steers fed concentrates for 2 months before weaning had lower gains than early-weaned steers (Myers et al., Reference Myers, Faulkner, Ireland, Berger and Parrett1999; Fluharty et al., Reference Fluharty, Loerch, Turner, Moeller and Lowe2000). However, in those studies traditionally weaned steers were older (7 months old) at weaning than the TW calves in the current experiment, and their milk and concentrate intake was not enough to maintain as rapid growth as the feedlot grain diet of their early-weaned counterparts.
Age of calf at weaning or the provision of concentrates before weaning had little influence on performance in the finishing period in the present study. In the study of Myers et al. (Reference Myers, Faulkner, Ireland, Berger and Parrett1999), gains of traditionally weaned steers were 40% to 60% lower than those of early-weaned steers between weaning dates, which resulted in little or no compensation in gains during the finishing period. Similarly, Fluharty et al. (Reference Fluharty, Loerch, Turner, Moeller and Lowe2000) reported approximately 35% differences in weight gains between weaning dates, and no effect of age at weaning on ADG during the finishing period. Accordingly, in the current experiment, when pre-weaning concentrate feeding was not provided to the calves (TWNS and EWNS), the difference in ADG between weaning dates was 41%, and weight gains during the finishing phase did not differ with age at weaning. Concerning the carry-over effects of pre-weaning concentrate feeding on the feedlot phase, Martin et al. (Reference Martin, Lemenager, Srinivasan and Alenda1981), Casasús et al. (Reference Casasús, Bernués, Sanz, Alzón and Eguinoa2001b) and Hennessy et al. (Reference Hennessy, Morris and Allingham2001) reported no effects on weight gains, as in the current experiment. Unexpectedly, weight gains of EWS calves at the feedlot were lower than those of the other treatment groups. Schoonmaker et al. (Reference Schoonmaker, Cecava, Fluharty, Zerby and Loerch2004) reported that early-weaned steers that were intensively fed had lower ADG than their traditionally weaned counterparts during the finishing phase. They stated that the intensive feeding of early-weaned steers caused an appreciable amount of energy to be partitioned to subcutaneous fat, thereby accelerating physiological maturity. In such circumstances, growth is not linear and ADG reaches a plateau, which could also be the case of EWS in the current experiment, whose fatness score was higher than that of TW calves. On the other hand, weight gains of TWNS calves could have been impaired due to an under-development of their rumen, because during nursing they only had access to milk and straw from the bedding material. However, when weight gains in the finishing period were studied on monthly intervals, no differences were observed between TWNS and TWS calves (data not shown). In fact, Cozzi et al. (Reference Cozzi, Gottardo, Mattiello, Canali, Scanziani, Verga and Andrighetto2002) found no differences in the length of papillae of ruminal mucosa due to the provision of solid feeds to milk-fed calves. Moreover, Myers et al. (Reference Myers, Faulkner, Ireland, Berger and Parrett1999) studied the effect of pre-weaning concentrate feeding in traditionally weaned calves and reported no effects in both digestive morbidity and weight gains, which contradicted Fluharty and Loerch (Reference Fluharty and Loerch1996), who reported that pre-weaning solid feeding decreased digestive morbidity.
Overall daily DMI and efficiency in the finishing period have been reported to be unaffected by age at weaning (Fluharty et al., Reference Fluharty, Loerch, Turner, Moeller and Lowe2000; Schoonmaker et al., Reference Schoonmaker, Cecava, Fluharty, Zerby and Loerch2004) or pre-weaning concentrate feeding during the nursing period (Faulkner et al., Reference Faulkner, Hummel, Buskirk, Berger, Parrett and Cmarik1994; Fluharty et al., Reference Fluharty, Loerch, Turner, Moeller and Lowe2000; Casasús et al., Reference Casasús, Bernués, Sanz, Alzón and Eguinoa2001b). On the other hand, the studies cited above reported a shortening of the finishing phase when starter feeds are offered to nursing calves, which also occurred in the current experiment with the TWS calves, but not with EWS calves due to their lower gains at the end of the feedlot period.
The fact that early-weaned calves, being already adapted to intensive feeding, had higher intakes than traditionally weaned calves during the first month of the finishing phase had already been reported (Fluharty et al., Reference Fluharty, Loerch, Turner, Moeller and Lowe2000; Meyer et al., Reference Meyer, Kerley, Walker, Keisler, Pierce, Schmidt, Stahl, Linville and Berg2005). The studies cited above also reported a higher intake of traditionally weaned steers in the second to fourth month of the finishing phase, although in the current study differences were only significant during the third month. On the other hand, Ryan et al. (Reference Ryan, Williams and Moir1993) reported that during the first 120 days of the finishing period, previously restricted calves had higher intake than continuously grown calves, as in the current experiment. This increase in feed intake has been described as a mechanism that may contribute to compensatory growth, which did not occur in our experiment.
Pre-weaning concentrate feeding was too short in EW calves to affect total DMI, whereas it affected total DMI in TW calves. In the same way, 5- to 8-month-old calves, offered starter feeds and then allocated to intensive diets, had lower feed intakes in the finishing phase than calves that were not offered starter feeds during nursing (Corah and Bishop, Reference Corah and Bishop1975; Casasús et al., Reference Casasús, Bernués, Sanz, Alzón and Eguinoa2001b). Total DMI from birth to slaughter was clearly influenced by age at weaning, as it was higher for EW calves, which agrees well with Myers et al. (Reference Myers, Faulkner, Ireland, Berger and Parrett1999) and Schoonmaker et al. (Reference Schoonmaker, Fluharty, Loerch, Turner, Moeller and Wulf2001). On the other hand, pre-weaning concentrate feeding did not affect total concentrate DMI throughout the production cycle, as Myers et al. (Reference Myers, Faulkner, Ireland, Berger and Parrett1999) reported.
Serum IGF-I and leptin concentrations
Serum IGF-I concentrations are indicative of nutritional and metabolic status, and consequently they increase in response to an increment in nutrient intake. In the current experiment, IGF-I concentrations at day 150 were positively related to energy intake, as other studies reported (Elsasser et al., Reference Elsasser, Rumsey and Hammon1989; Renaville et al., Reference Renaville, Van Eenaeme, Breier, Vleurick, Bertozzi, Gengler, Hornick, Parmentier, Istasse, Haezenbroeck, Massart and Portetelle2000). At slaughter, IGF-I did not differ among management strategies presumably because all the groups had similar concentrate intake and, therefore, energy intakes. In support of this notion, Elsasser et al. (Reference Elsasser, Rumsey and Hammon1989) reported that after 4 weeks of realimentation, IGF-I concentrations of restricted calves levelled of those of continuously growing calves.
The increase of leptin concentrations during fattening has been reported previously in beef cattle (Higashiyama et al., Reference Higashiyama, Abe, Hayashi and Hodate2003; Bellmann et al., Reference Bellmann, Wegner, Rehfeldt, Teuscher, Schneider, Voigt, Derno, Sauerwein, Weingärtner and Ender2004), associated both to increased nutrient intake and to the amount of body fat. The reason for the higher serum leptin concentrations of S calves at slaughter compared to their NS counterparts remains unclear, as fatness score or intramuscular fat were similar between them. In our experiment, increased serum leptin at slaughter was related to lower carcass fatness score, which contradicted the results reported by Geary et al. (Reference Geary, McFadin, MacNeil, Grings, Short, Funston and Keisler2003), who reported a positive relationship between them and proposed leptin as a predictor of carcass quality. However, in the current experiment fatness score had a narrow variability range, which could have interfered in the correlation obtained. Leptin concentrations before slaughter were also suggested as a predictor of intramuscular fat in Wagyu and Holstein steers (Higashiyama et al., Reference Higashiyama, Abe, Hayashi and Hodate2003), breeds with a higher intramuscular fat than the one used in the current study, but such relationship was not significant in our experiment as calves were probably too lean for displaying a conclusive relation of body fat and circulating leptin concentrations.
Carcass and meat quality
Pre-weaning concentrate feeding had no effect on carcass characteristics, which is in accordance with previous reports (Myers et al., Reference Myers, Faulkner, Ireland, Berger and Parrett1999; Fluharty et al., Reference Fluharty, Loerch, Turner, Moeller and Lowe2000; Casasús et al., Reference Casasús, Bernués, Sanz, Alzón and Eguinoa2001b). Early-weaned calves had heavier carcasses with a concomitant improvement of dressing percentage and fatness score, as had already been reported in other studies (Fluharty et al., Reference Fluharty, Loerch, Turner, Moeller and Lowe2000; Meyer et al., Reference Meyer, Kerley, Walker, Keisler, Pierce, Schmidt, Stahl, Linville and Berg2005; Blanco et al., Reference Blanco, Ripoll, Albertí, Sanz, Revilla, Villalba and Casasús2007). However, Fluharty et al. (Reference Fluharty, Loerch, Turner, Moeller and Lowe2000) also reported an improvement of carcass grade with early weaning, which did not appear in the current study. Pre-weaning concentrate feeding has been reported to affect carcass quality, with better conformed and fatter carcasses (Faulkner et al., Reference Faulkner, Hummel, Buskirk, Berger, Parrett and Cmarik1994). However, in our study this effect on carcass conformation only appeared in TW calves but not in EW calves.
The absence of effects of the management strategy on meat quality is consistent with other studies. Barker-Neef et al. (Reference Barker-Neef, Buskirk, Blackt, Doumit and Rust2001), Schoonmaker et al. (Reference Schoonmaker, Fluharty, Loerch, Turner, Moeller and Wulf2001) and Meyer et al. (Reference Meyer, Kerley, Walker, Keisler, Pierce, Schmidt, Stahl, Linville and Berg2005) had reported that early and traditionally weaned steers presented similar pH, toughness and maximum stress. On the other hand, the differences in meat chemical composition found in the current study are negligible due to their small magnitude. Barker-Neef et al. (Reference Barker-Neef, Buskirk, Blackt, Doumit and Rust2001) and Schoonmaker et al. (Reference Schoonmaker, Fluharty, Loerch, Turner, Moeller and Wulf2001) found no differences in dry matter and protein due to age at weaning. Previous experiments on age at weaning or pre-weaning concentrate feeding did not study meat fatty acid profile, which depends mainly on the composition of the diet given to the animals. Indeed, no differences were evident in the current experiment, because calves received the same intensive feeding for 123 to 225 days, a period long enough for previous SFA, PUFA and MUFA differences to vanish (Duckett et al., Reference Duckett, Wagner, Yates, Dolezal and May1993).
Economic performance
Considering the total expenses associated with the calf, EW calves had the highest costs due to higher total concentrate DMI, as Story et al. (Reference Story, Rasby, Clark and Milton2000) described, and more days on feed, which increased yardage costs. In EW calves, the short-term pre-weaning concentrate feeding did not affect total costs. On the other hand, TWS and TWNS calves had similar costs, although Corah and Bishop (Reference Corah and Bishop1975) had reported that the lower feed costs during the feedlot phase of calves offered concentrates during nursing when compared with milk-fed calves did not compensate for the value of the concentrate fed during the nursing period. However, in a cow–calf enterprise, cow costs should also be taken into account. The higher costs of lactating cows compared with those whose calves had been early weaned had already been reported by Casasús et al. (Reference Casasús, Blanco, Sanz, Bernués and Revilla2006). The advantage of TWS and TWNS strategies due to their lower calf-associated costs was counterbalanced by the greater cow-associated costs when compared with EWS and EWNS strategies. Conversely, no other cow-associated costs were considered, as cow weight and reproductive performance did not differ between EW and TW strategies (unpublished data).
Results on income yielded from different management strategies differ among studies, because of their dissimilar effect on animal performance and carcass quality. When early-weaned calves had better carcass quality, they yielded higher incomes than traditionally weaned calves (Story et al., Reference Story, Rasby, Clark and Milton2000). On the contrary, Barker-Neef et al. (Reference Barker-Neef, Buskirk, Blackt, Doumit and Rust2001) reported that early-weaned calves had lighter carcasses, which resulted in lower incomes. In the current experiment, as carcass weights and conformation were similar among EWS, EWNS and TWS, the incomes were also similar. However, TWNS calves had slightly lighter and more poorly conformed carcasses; therefore the income was also lower. Consequently, pre-weaning concentrate feeding improved the economic performance of TW but not EW calves. Hence, considering the economic margin, the least advisable management strategy would be TWNS, whereas any of the other three could be equally recommended. However, if calves were sold after weaning, TWNS would have similar economic margin than TWS, as the lesser income perceived due to a lower weaning weight would be counterbalanced by lesser feed costs.
Implications
The results of the current study revealed that when calves were fattened in the farm and sold at slaughter, the traditional management strategy used in the study area (TWNS) was the least favourable one from an economic point of view, because the higher feeding and yardage costs of cows were not counterbalanced by the lower feed costs of their calves, and their lower carcass quality originated a lower income. Consequently, if calves are traditionally weaned, pre-weaning concentrate feeding improves gains, carcass quality and economic performance. On the other hand, EWNS and EWS strategies had similar economic performance than TWS strategy, without affecting gains, carcass or meat quality. Therefore, it is feasible to early wean calves, reducing the indoor housing period of their dams and allowing for an earlier turnout to forest pastures, which has been reported as an effective strategy for enhanced environmental management of these areas.
Acknowledgements
We wish to thank the farm staff working at La Garcipollera Research Centre and CITA Research Centre, MercaZaragoza and BIMARCA S.A., for technical support, and Departament de Producció Animal, Universitat de Lleida, for meat fatty acid analysis. Research funded by project AGL 2002-00027 (MCyT). We also thank Mrs. B. Mielenz, University of Bonn, Germany for her help with the leptin analyses. M. Blanco received a grant from INIA.