I. INTRODUCTION
High performance integrated circuit (IC) back-end-of-line (BEOL) structures are constructed with copper interconnect lines and low-dielectric constant (k) insulators to reduce resistive and capacitive delay. These low-k thin films are composed of amorphous silicon dioxide; however, some of the bridging oxygen atoms are replaced with hydrogen or hydroxyl groups and by organic groups such as methyl (-CH3) or methylene (-CH2-). These hybrid organic–inorganic materials are often referred to as organosilicate glass (OSG). To further reduce the dielectric constant of the OSG and achieve k values as low as 2.6 to 2.3, nanometer scale pores are often introduced into the matrix creating porosity in the range of ∼7 to ∼45%.Reference O’Neill, Haas, Peterson, Vrtis, Weigel, Wu, Bitner, Karwacki, Tsui, Joo, Michaelson, Lane and Volinsky1–Reference Morgen, Ryan, Zhao, Hu, Cho and Ho3 In a well hermetically sealed IC product with a protective overcoat, such as silicon nitride, these nanopores are evacuated with the internal pressure defined by the deposition steps during the IC manufacturing processes. The increase of porosity within the OSG molecular structure reduces the average bond density and weakens the mechanical strength of these materials, thereby increasing their vulnerability to stress corrosion cracking and inducing catastrophic failure.
Environmental effects on the fracture properties of bulk glass materials, such as amorphous silica and borosilicate glass, have been thoroughly studied.Reference Liniger and Cook4–Reference Wiederhorn, Fuller and Thomson9 A reaction-rate-controlled model to predict crack growth velocity in the presence of reactive species has been developed by WiederhornReference Wiederhorn6 and Lawn.Reference Lawn5, Reference Lawn10 Sparked by IC mechanical reliability concerns, stress corrosion cracking of thin film dielectrics has been a topic of interest and moisture and temperature effects have been studied.Reference Cook and Liniger11–Reference Lane, Snodgrass and Dauskardt14 Several experiment techniques have been developed to characterize the fracture strength of thin films, such as channel cracking,Reference Hutchinson and Suo15–Reference Vlassak19 four-point bend,Reference Vlassak, Lin and Tsui20–Reference Lin, Tsui and Vlassak22 and double cantilever beam.Reference Li, Lin, Tsui and Vlassak23, Reference Lin, Xiang, Tsui and Vlassak24 The fracture energy of a series of OSG films deposited with different amounts of porosity in the range of 7–45% were evaluated by Guyer et al.,Reference Guyer, Patz and Dauskardt21 Lin et al.,Reference Lin, Xiang, Tsui and Vlassak24 Li et al.,Reference Li, Lin, Tsui and Vlassak23 Maidenberg et al.,Reference Maidenberg, Volksen, Miller and Dauskardt25 Iacopi et al.,Reference Iacopi, Tavaly, Eyckens, Waldfried, Abell, Guyer, Gage, Dauskardt, Sajavaara, Houthoofd, Grobet, Jacobs and Maex26 Smith et al.,Reference Smith, Tsui and Ho27 and Merrill et al.Reference Merrill, Ho, Carter, HauRiege, Lu and Schulz28 Their results show that the energy release rate of these films decreases with increasing porosity. The fracture strength of porous OSG and its adhesion properties with different capping materials under different environmental conditions was studied by Vlassak et al.,Reference Vlassak, Lin and Tsui20 Tsui et al.,Reference Tsui, McKerrow and Vlassak29 Lin et al.,Reference Lin, Tsui and Vlassak22 Lane et al.,Reference Lane, Snodgrass and Dauskardt14 and Guyer and DauskardtReference Guyer and Dauskardt30 They demonstrated that the fracture toughness and crack propagation rates are sensitive to the chemical species in the environment, such as the water vapor content or the pH of the solution. In general, the fracture strength of the OSG in the reaction-controlled regime decreases with the amount of reactive species in the surrounding environment. Assuming that water vapor in the environment can be modeled as an ideal gas and the crack propagation rate is in the reaction-controlled regime, fracture energy (G) at a fixed crack velocity is related to the partial pressure of moisture (p H2O) in the environment according to the following:

where n is the number of water molecules reacting with each broken bond, N is the bond density, R is the gas constant, and T is the absolute temperature of the environment.Reference Lawn10, Reference Cook and Liniger11, Reference Lane, Snodgrass and Dauskardt14, Reference Vlassak, Lin and Tsui20, Reference Lin, Tsui and Vlassak22, Reference Tsui, McKerrow and Vlassak29, Reference Lin, Vlassak, Tsui, McKerrow, McKerrow, Leu and Kraft31
To the best of our knowledge, virtually all the OSG fracture studies are conducted at ambient temperature and atmospheric pressure with very few experiments performed in harsh environments, such as vacuum and at subzero temperatures. The fracture properties of these dielectric materials at low temperature and pressure are very important for IC mechanical reliability. This is because a large amount of shear stress can be generated by the thermal expansion coefficient mismatch between the underfill packaging materials and the silicon substrate at low temperatures. This stress becomes the driving force for mechanical failure, such as BEOL thin film delamination or cracking; therefore, it is vital to characterize the fracture energy of the BEOL structures in these harsh environments.
There are two objectives for the current project. The first is to design and construct a load–displacement sensing instrument that can operate in a wide range of pressures with the lowest limit near 0.0001 Pa. This equipment should also be capable of performing experiments near the cryogenic temperature of approximately −170 °C. This cryogenic thin film mechanical tester is fitted with a four-point bend testing apparatus that is used to characterize the critical fracture strengths of OSG thin films with dielectric values of 2.60, 2.43, and 2.30, which fulfills the second objective of this work. Fracture results show that the measured energy release rate of these samples increases by reducing amount of moisture in the environment. A temperature range from 20 to 25 °C and atmospheric pressure are regarded as ambient. In addition, the OSG fracture strengths measured at approximately −30 °C and high vacuum are very similar to those characterized in pure nitrogen. This can be explained by the reduced concentration of reactive species in these harsh conditions.
II. EXPERIMENTAL METHODS
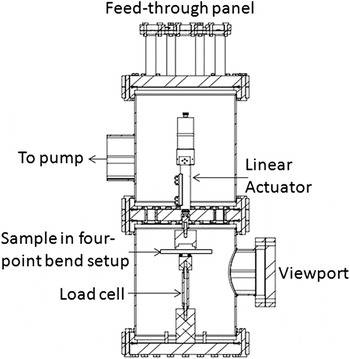
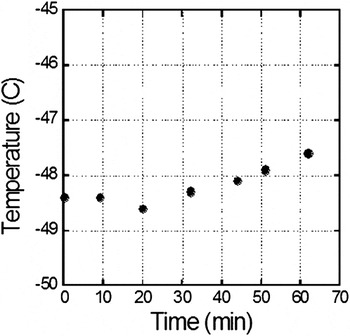
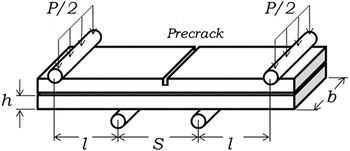
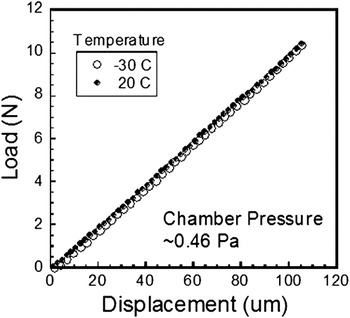
A schematic drawing of the cryogenic thin film mechanical tester constructed for this work is shown in Fig. 1. The linear actuator (MP-20 L; Micos USA LLC, Irvine, CA) shown in the figure is capable of operating in vacuum and cryogenic temperatures and has a full step resolution of 1.25 μm. The load cell (Sensing Systems Corporation, New Bedford, MA) has a resolution of 5.96 μN and an operation temperature range between –100 and 65 °C. These components are mounted inside a vacuum chamber made of stainless steel 304 with a 0.5-inch-thick sidewall for added rigidity. The chamber is evacuated using a dual stage system including a roughing pump and a turbomolecular pump. Temperature is reduced by placing the entire test chamber in an insulated box packed with cooling agent, which is dry ice in this work. Chamber pressure is measured using a cold cathode ion gauge (Pfeffier Vacuum GmbH, Asslar, Germany). For a typical low temperature experiment, after the sample is loaded into the testing chamber, approximately 30 min is required to pump the chamber down to the targeted pressure. This is then followed by an additional 5-h cooling period to chill the entire testing chamber from room temperature to approximately −30 °C. To avoid ice crystal formation on the linear actuator and other electronics inside the chamber, all the low temperature tests were conducted at chamber pressure below 1 Pa to keep water molecules in vapor phase. Figure 2 shows the sample temperature plotted as a function of time after the testing system is cooled to approximately −48 °C. It indicates that the specimen temperature deviates less than ±1 °C within a 60-min period. Fracture strengths of the thin film samples were tested by applying the four-point bend loading configuration shown in Fig. 3.Reference Matos, McMeeking, Charalambides and Drory32–Reference Ma35 The bending scheme includes four points of load application on each sample, where l is the distance between the inner and the outer pin spacing, h is the thickness of the silicon substrate, and b is the width of the beam. Load–displacement data of four-point bend tests performed on a 1-mm-thick and 25-mm-wide glass slide (Fisherfinest microscope slides) at different chamber temperatures are shown in Fig. 4. Both experiments were performed at a chamber pressure of 0.46 Pa with the first test at 20 °C and the second at −30 °C. Since the load–displacement results measured in these two extreme conditions overlap, it is concluded that the instrument can produce consistent and reproducible results in the environments explored in this work.
Section view of the mechanical tester constructed for this work. The linear actuator and load cell are mounted inside an environmental chamber. Thick walls and rigid mounts are used to reduce the compliance of the frame.

Temperature stability of the environmental chamber is shown over a 60-min time frame during which a total fluctuation of 1 °C occurs. A similar temperature plateau is generated for each cold experiment.

Thin film stack sandwiched between silicon substrates. Fracture is facilitated by a machined precrack into the substrate. As load (P) increases, the precrack advances to the weakest interface and propagates toward the inner pins.

Load–displacement curve of a glass slide measured at −30 and 20 °C. The linearity and slope of the reading has not been impacted by the change in temperature.

The OSG thin film stacks investigated in this work were deposited on 300-mm silicon substrates by using plasma-enhanced chemical vapor deposition (PECVD) techniques. The precursor used was diethoxymethylsilane with helium and oxygen serving as carrier and oxidizer gases, respectively. The PECVD process was performed at 250 °C using appropriate ratios of a proprietary aromatic porogen. These organic molecules were then removed by irradiation at 400 °C using broadband ultraviolet radiation in vacuum. Three different types of OSG thin films, i.e., OSG_1, OSG_2, and OSG_3 were deposited with porosity values of ∼20.1, 27.2, and 44.5, respectively. The corresponding dielectric values of these films are ∼2.60, 2.43, and 2.30, respectively. All the OSG films were capped with ∼300-nm-thick PECVD silicon carbonitride (SiCN) thin film, which has a dielectric constant of approximately 5.0.
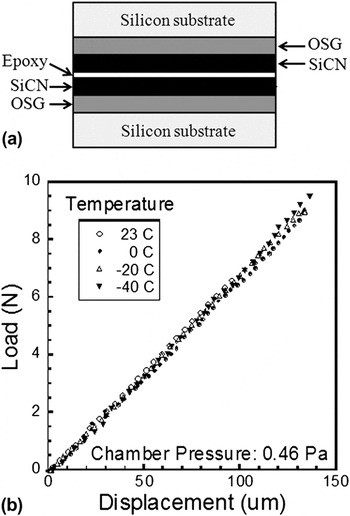
To characterize the fracture strength of the OSG/SiCN thin film composites using the four-point bending test configuration, the 300-mm silicon wafers with the OSG/SiCN thin films were cleaved into ∼5- × ∼1-cm2 rectangular strips. They were subsequently bonded together with the film stacks adjacent to each other using epoxy adhesive (Epotek 353ND). A schematic drawing of the OSG/SiCN sample film stack structure is revealed in Fig. 5(a). The adhesive in these samples was cured in a convection oven at ∼45 °C for 20 min and then at ∼85 °C for an additional 40 min. To confirm the thermal mechanical stability of the epoxy adhesive, load–displacement responses of an epoxy beam (7.9-mm width and 2.3-mm thickness) under four-point bend loading at 23, 0, −20, and −40 °C are plotted in Fig. 5(b). The displacement rate used in this experiment was 1 μm/s. This figure shows that the elastic deformation behavior of this material is not noticeably different within the temperature and pressure range of our experiments. After the curing step, all the prepared samples are stored in a dry nitrogen box to reduce the amount of moisture absorbed by the porous OSG films. To further ensure that the samples do not contain excess moisture, a bake-out step is performed at ∼85 °C for ∼20 min immediately before each adhesion test. A precrack is generated in each sample using a diamond dicing saw to a depth of approximately half the thickness of the silicon substrate. During all the fracture experiments, the linear actuator deforms the samples at constant velocity of ∼0.25 μm/s.
(a) Schematic drawing of a four-point bend adhesion sample stack. (b) Load–displacement curves of an epoxy beam measured at 23, 0, −20, and −40 °C. Overlapping curves indicate little change in elastic modulus across the temperature range.

III. RESULTS AND DISCUSSION
A. Humidity effects on OSG/SiCN thin film fracture strength
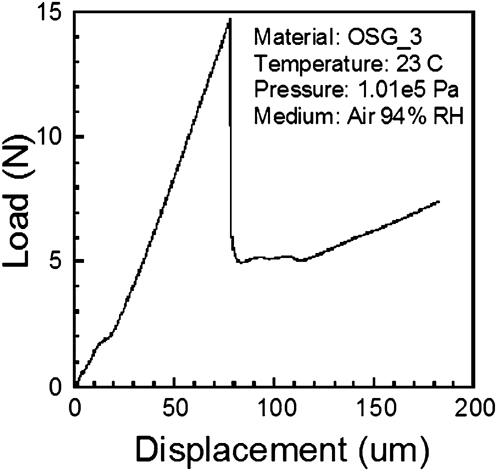
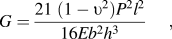
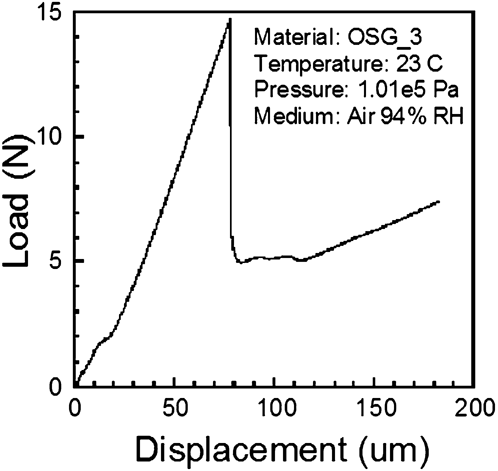
Figure 6 shows load–displacement data measured during a typical four-point bend thin film fracture experiment. Initially, the specimen deforms elastically until the precrack begins to propagate into the thin film stack which corresponds to a sudden drop in the load. As the crack extends laterally through the weakest dielectric thin film or interface, a characteristic plateau load (P) is formed which is indicative of steady-state crack propagation. The energy release rate or fracture energy (G) at this crack growth velocity is related to the load and sample geometric parameters according to the following expression:
Load–displacement curve of a typical OSG_3/SiCN film stack. Initially, elastic deformation occurs. The sharp drop in load (near 80-μm displacement) corresponds to precrack propagation to the surface of interest.
where E and ν are the elastic modulus and the Poisson’s ratio of the silicon substrate, respectively.Reference Matos, McMeeking, Charalambides and Drory32
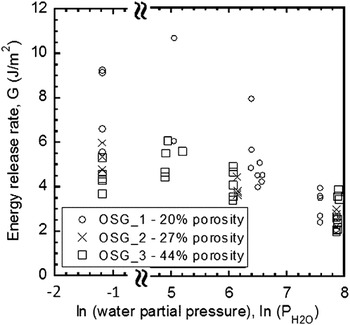
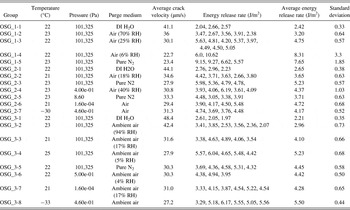
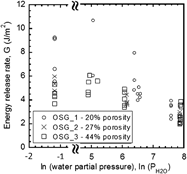
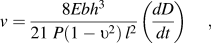
Room temperature fracture energy values of all three OSG/SiCN film stacks measured in various relative humidity (RH) conditions are shown in Fig. 7. This figure also includes results from specimens tested in deionized (DI) water and high purity nitrogen (Praxair NI4.8, 99.998%) environments. The water partial pressures of these two conditions are assumed to be 2612 Pa, which is the saturated water vapor partial pressure at 22 °C, and 3.03e-3 Pa, which is the maximum moisture concentration in the nitrogen gas (3 ppm) as specified by the supplier. A summary of the testing conditions and the fracture energy data from these experiments is given in Table I. Fracture tests performed in DI water and 70% RH were not carried out in the cryogenic load–displacement sensing instrument due to the moisture sensitivity of the electronics in this equipment. Instead, they were carried out in another thin film adhesion tester with the same load–displacement capabilities but with higher tolerance for moisture in the environment. To calculate the crack propagation velocity (v) of these experiments, the following expression is used:
Energy release rate of organosilicate glass/silicon carbonitride (OSG/SiCN) film stacks as a function of ln (water partial pressure). Also includes specimens tested in deionized (DI) water and in an N2 environment.

Testing conditions and results of OSG/SiCN film stacks.

OSG/SiCN, organosilicate glass/silicon carbonitride; DI, deionized; RH, relative humidity.
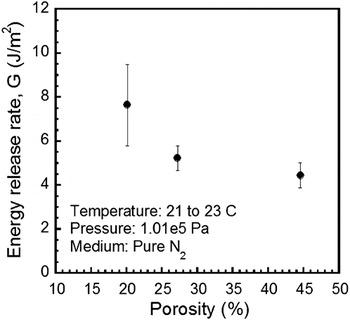
where (dD/dt) is the beam deflection rate.Reference Ma35 They are listed in Table I with the range of 22–41 μm/s. Figure 7 shows that the fracture strengths of all thin film specimens in this work are sensitive to the amount of moisture in the environment. Less energy is required to create crack propagation when the environment contains more water molecules. The results show that the fracture energy is the lowest when the samples are submerged in DI water and the G values converge to ∼2.5 J/m2. This indicates that the fracture strength of the OSG in this testing condition does not appear to depend on film porosity. As moisture content in the environment decreases, the fracture resistance of the OSG/SiCN samples increases exponentially. However, the fracture energy reaches a plateau value when moisture content is near 6% RH. Thereafter, further reduction of moisture in the environment does not have a significant effect on improving the fracture strength of the OSG/SiCN specimens. In contrast to the fracture energy measured when submerged in DI water, this plateau value appears to be influenced by the porosity of the OSG film. The average fracture energies for OSG_1, OSG_2, and OSG_3 in a pure nitrogen environment have G values of 7.65 ± 1.85, 5.23 ± 0.57, and 4.45 ± 0.58 J/m2, respectively, with one standard deviation of data spread. These results are shown in Fig. 8 and are consistent with observations by Li et al.Reference Li, Lin, Tsui and Vlassak23 and Guyer et al.Reference Guyer, Patz and Dauskardt21 who demonstrated that OSG films are stronger when they contain a smaller amount of porosity. A linear fit of the OSG_1/SiCN energy release results collected at RH greater than 6% shows that the moisture sensitivity coefficients (A and B) defined in Eq. (1) have the values 2.02 and 18.33 J/m2, respectively. The same constants for the OSG_3/SiCN samples are 0.84 and 9.31 J/m2, respectively.
Energy release rate of OSG films as a function of porosity (percent) showing a downward trend.

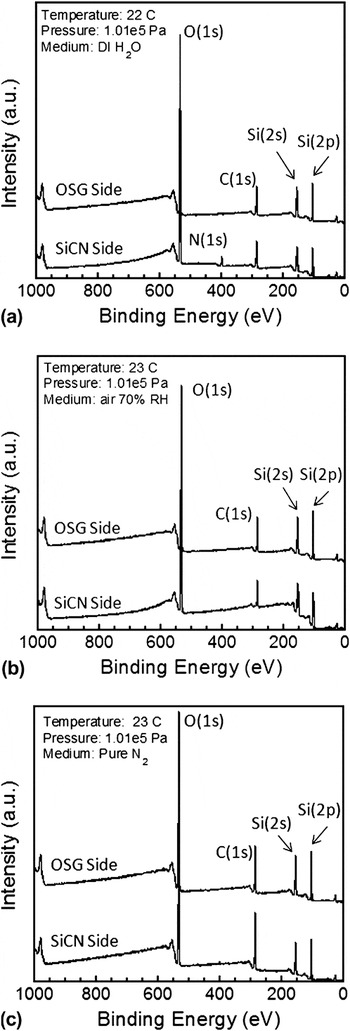
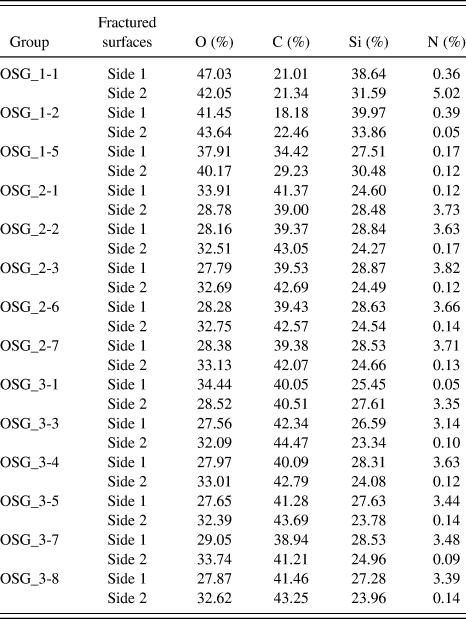
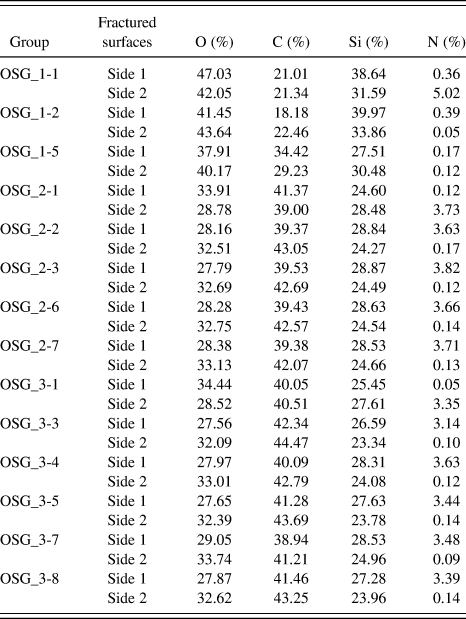
To identify the locus of failure, fractured surfaces of test specimens were characterized using x-ray photoelectron spectroscopy (XPS). The spectrums collected from the OSG_1/SiCN samples fractured in DI water, 70% RH ambient air, and pure nitrogen gas are shown in Figs. 9(a)–9(c), and the elemental compositions of these fractured surfaces are listed in Table II. The results reveal that the fracture surfaces of 70% RH ambient air and pure nitrogen gas specimens contain oxygen, carbon, and silicon and have a notable absence of nitrogen. This suggests that cracks did not propagate through the OSG_1/SiCN or Si substrate/OSG_1 interfaces. Instead, these fracture events were cohesive in nature with cracks extending within the OSG_1 film. In contrast to the aforementioned, XPS spectra of the DI-water-submerged sample show different elemental compositions between the two fracture surfaces with one containing nitrogen, whereas the other does not. The surface that contains nitrogen corresponds to the SiCN film, whereas the other surface is the OSG layer which is nitrogen free. This indicates that when submerged in DI water, the adhesion energy of OSG_1/SiCN is reduced and the crack propagates through the interface instead of the bulk material. One of the possible explanations for the change in failure site from cohesive to adhesive is the rapid moisture diffusion rate at the OSG_1/SiCN interface as reported by Lin et al.Reference Lin, Tsui and Vlassak22 They characterized the diffusion of water into the OSG/SiNx stacks using dynamic secondary ion mass spectrometry in depth profiling mode and a tracer isotope. Their results show that water molecules tend to diffuse along the OSG/SiNx interface faster than through the bulk OSG film. The fast moisture diffusion rate at the interface increases the moisture concentration at the crack tip and weakens the interfacial strength. The XPS chemical compositions of the fractured surfaces from OSG_2 and OSG_3 are also listed in Table II. They show the presence of nitrogen on one of the two fracture surfaces. This indicates that cracks propagate along the OSG/SiCN interface for these two film stacks, i.e., adhesive failure.
X-ray photoelectron spectroscopy (XPS) spectrum of the fractured surface of an OSG_1 sample tested in (a) DI water, (b) air with 70% relative humidity, and (c) pure N2 environment at room temperature.

Elemental compositions (at.%) of fractured OSG/SiCN thin film composites.
B. Fracture strength under harsh environments
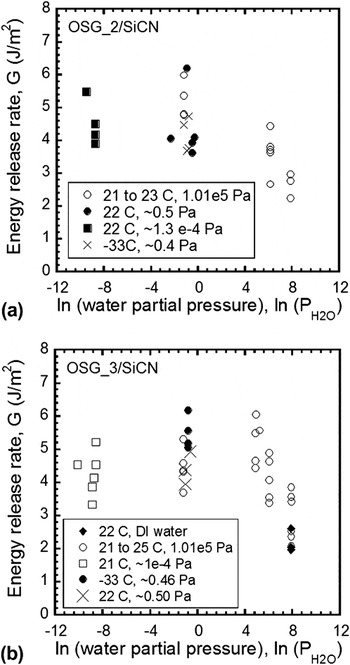
The fracture characteristics of OSG/SiCN specimens in harsh environments, such as high vacuum and cold temperatures, were also investigated in this work. Table I shows the detailed testing conditions for all OSG/SiCN samples. They were tested in three different environments: (i) at room temperature and pressure of ∼0.46 Pa; (ii) at room temperature and pressure of ∼1.6e-4 Pa; and (iii) at −30 °C and pressure of ∼0.46 Pa. The vacuum condition is needed for the low temperature tests to prevent damage caused by ice crystal formation on the linear actuator and other sensitive load cell electronics in the chamber. Results from these experiments are plotted in Figs. 10(a) and 10(b) with other experimental data shown in Fig. 7. Since the exact water vapor concentrations in the chamber were not measured directly during the extreme environment tests, the water partial pressure was assumed to be the same as the chamber pressure. Figures 10(a) and 10(b) show the fracture strengths of the OSG_2/SiCN and OSG_3/SiCN specimens in these harsh testing conditions. Like the OSG_1/SiCN results, the plots show that the fracture strengths of these two dielectrics are very similar in harsh environments to those in pure nitrogen. This is expected because at high vacuum the number of water vapor molecules in the chamber is significantly smaller than in ambient conditions. For example, assume an isothermal system at 20 °C and 101,325 Pa with 100% RH. The water vapor concentration in this enclosed environment is 5.71e23 molecules per meter cubed. At a pressure of 1.6e-4 Pa, the value used in the harsh environment tests, the vapor concentration drops by approximately nine orders of magnitude to ∼9.02e14 molecules per meter cubed according to the idea gas law. This reduces the reactant concentration at the crack tip and increases the fracture strength of the OSG/SiCN film stack. In addition, because the sticking probability of water to stainless steel 304 increases with decreasing temperature,Reference Steinherz36 more of the water molecules may attach to the cold chamber walls, further reducing the number of available reactive species in the testing space.
Harsh environment performance of (a) OSG_2 and (b) OSG_3.

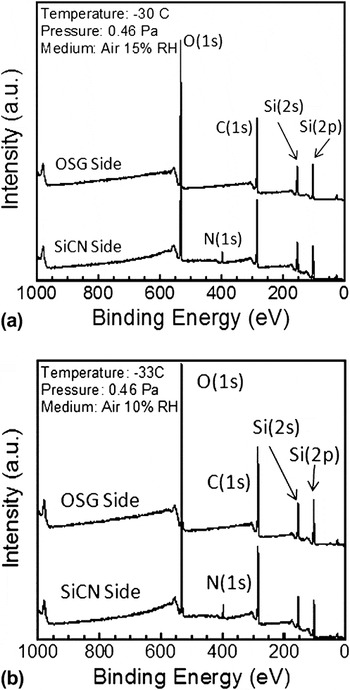
The XPS spectrums from the failed surfaces of the OSG_2/SiCN and OSG_3/SiCN specimens tested at −30 °C and 0.46 Pa are shown in Figs. 11(a) and 11(b) respectively. Elemental compositions extracted from these spectrums are summarized in Table II. These results reveal that for each failed specimen, one of the surfaces contains a nitrogen peak, whereas the other does not. These are the characteristics of OSG/SiCN interfacial failure. This demonstrates that the fracture behaviors of the OSG_2 and OSG_3 are the same in ambient and in harsh environments. It is important to note that even though the OSG/SiCN fracture results shown in this work do not indicate a significant temperature or atmospheric pressure sensitivity, other materials may exhibit changes in the fracture behaviors with these environmental parameters. For example, the elastic and plastic properties of some polymeric materials can change with temperature. This can lead to changes in fracture energy and the mode of deformation near the crack tip.
XPS spectrum of an OSG_2 sample tested under harsh environment conditions (−30 °C and 0.46 Pa) and (b) XPS spectrum of an OSG_3 sample tested under harsh environment conditions (−33 °C and 0.46 Pa).

IV. CONCLUSIONS
(1) A novel high resolution load and displacement sensing instrument has been constructed with the ability to conduct thin film fracture experiments at temperatures ranging from 20 to −30 °C and in high vacuum of 1.6e-5 Pa. It is believed that this is the first time that fracture energies of OSG/SiCN films were characterized in low temperature and low pressure environments.
(2) The effect of moisture content on the adhesion energy of OSG films with different porosities was investigated. It was observed that the energy release rate was the smallest when samples were submerged under DI water and increased exponentially as moisture concentration was reduced. A plateau was observed at 6% RH where the fracture strengths were not significantly different from those obtained in a pure nitrogen environment.
(3) Fracture strengths of OSG/SiCN film stacks measured in harsh environments, such as low temperature (−30 °C) and high vacuum experiments (4.0e-1 Pa), are similar to those tested in pure nitrogen gas. This may be explained by the depletion of reactive species in a vacuum and cold environment. XPS results of OSG_2 and OSG_3 showed that the cracks propagate in the same interface in ambient and harsh environments.
ACKNOWLEDGMENTS
T.Y. Tsui thanks the Canadian Natural Sciences and Engineering Research Council (NSERC) Discovery, NSERC Research Tools and Instruments, and the Canada Foundation for Innovation for the financial support of this work.