


1. Introduction
Sustainable solutions that enhance productivity and resilience while reducing greenhouse gas (GHG) emissions in agriculture remain a key policy objective in developing regions. Climate-smart agriculture (CSA) is one approach that reflects an ambition to improve the integration of agriculture development and climate responsiveness. It aims to simultaneously achieve productivity increases as well as adaptation and mitigation goals while maximizing synergies and minimizing potential trade-offs (Bazzana, Foltz, and Zhang, Reference Bazzana, Foltz and Zhang2022; FAO, 2010; Lipper et al., Reference Lipper, Thornton, Campbell, Baedeker, Braimoh, Bwalya, Caron, Cattaneo, Garrity, Henry, Hottle, Jackson, Jarvis, Kossam, Mann, McCarthy, Meybeck, Neufeldt, Remington, Sen, Sessa, Shula, Tibu and Torquebiau2014). Conservation Agriculture (CA), which involves minimal soil disturbance, crop rotation, and permanent soil cover (FAO, 2015) and biochar are among the innovations earmarked to promote sustainable agricultural development. Evidence has shown that CA can positively contribute to increasing crop productivity, resilience, and mitigation (e.g.,(Corbeels, Thierfelder, and Rusinamhodzi, Reference Corbeels, Thierfelder, Rusinamhodzi, Farooq and Siddique2015; Gonzalez-Sanchez et al., Reference Gonzalez-Sanchez, Veroz-Gonzalez, Conway, Moreno-Garcia, Kassam, Mkomwa, Ordoñez-Fernandez, Triviño-Tarradas and Carbonell-Bojollo2019; Martinsen et al., Reference Martinsen, Shitumbanuma, Mulder, Ritz and Cornelissen2017; Thierfelder et al., Reference Thierfelder, Chivenge, Mupangwa, Rosenstock, Lamanna and Eyre2017)). Likewise, biochar offers numerous benefits in sustainable agriculture by improving soil health and crop productivity, mitigating climate change, and promoting the efficient use of resources (Campion et al., Reference Campion, Bekchanova, Malina and Kuppens2023; Namatsheve et al., Reference Namatsheve, Martinsen, Obia and Mulder2024; Schmidt and Wilson, Reference Schmidt and Wilson2012; Schmidt et al., Reference Schmidt, Kammann, Hagemann, Leifeld, Bucheli, Sánchez Monedero and Cayuela2021; Sparrevik et al., Reference Sparrevik, Lindhjem, Andria, Fet and Cornelissen2014). The combination of CA and biochar can form important pillars for sustainable agriculture (Cornelissen et al., Reference Cornelissen, Martinsen, Shitumbanuma, Alling, Breedveld, Rutherford, Sparrevik, Hale, Obia and Mulder2013; Martinsen et al., Reference Martinsen, Mulder, Shitumbanuma, Sparrevik, Børresen and Cornelissen2014; Obia et al., Reference Obia, Cornelissen, Martinsen, Smebye and Mulder2020). Benefits attached to CA and biochar have increased policy attention and interest in smallholder farming systems, particularly in SSA, but have not necessarily achieved high adoption rates (Giller et al., Reference Giller, Witter, Corbeels and Tittonell2009; Andersson and D’Souza, Reference Andersson and D’Souza2014; Brown, Nuberg, and Llewellyn, Reference Brown, Nuberg and Llewellyn2017).
A significant challenge within the agricultural economics literature revolves around trying to explain why adoption rates of beneficial technologies such as CA and biochar remain low despite their potential for yielding high returns for resources invested (the adoption puzzleFootnote 1 ). Valuable insights from the behavioral and experimental agricultural economics literature acknowledge that where investment returns of potentially beneficial technologies such as CA and biochar are uncertain or conditional on certain factors (e.g., access to complementary inputs, land tenure arrangements, and weather conditions), risk aversion preferences can play a crucial role (Holden and Quiggin, Reference Holden and Quiggin2017; Kremer, Rao, and Schilbach, Reference Kremer, Rao and Schilbach2019; Pandey, Reference Pandey2004; Visser et al., Reference Visser, le Roux, Mulwa, Tibesigwa and Bezabih2024). Literature on CA and biochar also reports that resource constraints and land tenure arrangements, among other factors, can limit uptake (Andersson and D’Souza, Reference Andersson and D’Souza2014; Campion et al., Reference Campion, Bekchanova, Malina and Kuppens2023; Fridahl et al., Reference Fridahl, Haikola, Rogers, Hansson, Leal Filho, Luetz and Ayal2021; Giller et al., Reference Giller, Witter, Corbeels and Tittonell2009; Pannell, Llewellyn, and Corbeels, Reference Pannell, Llewellyn and Corbeels2014). Furthermore, the nature and magnitude of benefits associated with these technologies can vary significantly among individual farmers and their specific contexts (ibid). Adoption of these technologies is, hence, risky, potentially limiting the willingness of risk-averse smallholder farmers to adopt them and reap the full benefits.
Land tenure arrangements and weather shocks pose significant risks to land-based adaptive investments such as CA and biochar in developing regions. On the one hand, land tenure arrangements are linked to land use behavior, with insecure land tenure arrangements usually linked to disinvestments and poor land use practices that can lead to land degradation (Abdulai, Owusu, and Goetz, Reference Abdulai, Owusu and Goetz2011; Besley, Reference Besley1995; Pedersen et al., Reference Pedersen, Spichiger, Alobo, Kidoido, Bashaasha and Munk Ravnborg2012; Place, Reference Place2009). On the other hand, crop production in developing regions, including Uganda, is rainfed and risky, as covariate weather shocks such as droughts and floods greatly affect food production (BFS/USAID, 2017; World Bank, 2021). In Uganda, an estimated 0.1% of cultivated land is under irrigation, making agriculture vulnerable to climate change (BFS/USAID, 2017). Weather shocks also influence technology adoption by shaping both ex-ante (preventive) and ex-post (responsive) risk management strategies by farmers (Angelsen and Dokken, Reference Angelsen and Dokken2018; Dercon, Reference Dercon2004; Makate et al., Reference Makate, Angelsen, Holden and Westengen2022). Although the uptake of innovative technologies may reduce the risk of adverse outcomes and improve livelihood outcomes, their implementation and effectiveness could be limited if there is a strong link between land tenure security, exposure to weather shocks, individual risk preferences, and their adoption. The interaction between different sources of risk (e.g., land tenure security and weather shocks) and individual risk preferences is poorly understood (Visser et al., Reference Visser, le Roux, Mulwa, Tibesigwa and Bezabih2024) and a better understanding of this interaction can enhance our comprehension of the adoption puzzle and suggest possible ways forward.
This study aimed to answer two research questions: (i) Do drought shocks and insecure land tenure show an association with risk aversion in rural Uganda? and (ii) What is the relationship between risk aversion, land tenure, drought shocks, and the adoption of climate-smart innovations in Uganda? To answer these research questions, the study used data from multiple sources, including household and plot-level data from randomized experiments covering 442 farmers and 927 plots, farm-specific weather data, and risk preferences data from an incentivized economic field experiment. This inquiry is important as the association between shocks and risk aversion can potentially reduce investments in agriculture, reinforcing the adoption puzzle (Brick and Visser, Reference Brick and Visser2015; Suri and Udry, Reference Suri and Udry2022), which in turn may perpetuate poverty traps (Barrett et al., Reference Barrett, Carter and Chavas2019; Dercon, Reference Dercon2004). Thus, the study provides novel insights in several ways.
First, while a growing body of research highlights that household risk preferences are not stable and can be influenced by covariate and idiosyncratic shocks (e.g.,(Brunnermeier and Nagel, Reference Brunnermeier and Nagel2008; Cameron and Shah, Reference Cameron and Shah2015; Di Falco and Vieider, Reference Di Falco and Vieider2022; Drichoutis and Nayga Jr, Reference Drichoutis and Nayga2022; Eckel, El-Gamal, and Wilson, Reference Eckel, El-Gamal and Wilson2009; Finger, Wüpper, and McCallum, Reference Finger, Wüpper and McCallum2023; Sahm, Reference Sahm2012)), most of this work focuses on developed countries or regions outside of Africa (see Liebenehm, Schumacher, and Strobl (Reference Liebenehm, Schumacher and Strobl2024) for an overview on thisFootnote 2 ). Moreover, findings in the existing literature remain ambiguous, underscoring the need for context-specific research to enhance understanding. For example, shocks in varying contexts have been found to increase risk aversion (Cameron and Shah, Reference Cameron and Shah2015; Di Falco and Vieider, Reference Di Falco and Vieider2022), reduce risk aversion (Eckel, El-Gamal, and Wilson, Reference Eckel, El-Gamal and Wilson2009; Finger, Wüpper, and McCallum, Reference Finger, Wüpper and McCallum2023; Holden and Tilahun, Reference Holden and Tilahun2024; Liebenehm, Schumacher, and Strobl, Reference Liebenehm, Schumacher and Strobl2024), or have no effect at all (Brunnermeier and Nagel, Reference Brunnermeier and Nagel2008; Drichoutis and Nayga Jr, Reference Drichoutis and Nayga2022; Sahm, Reference Sahm2012). The main mechanisms mentioned in this strand of literature to explain changes in risk preferences following shocks vary but mainly include changes in income positions, emotions, life situations, and optimism towards current and future income. However, the diverse outcomes and driving factors across contexts underscore the need to understand risk preferences in specific local contexts, particularly in under-researched regions like Uganda.
Second, the literature on risk preferences and agricultural technology adoption in developing countries is inconclusive, although most studies suggest that farmers’ risk aversion typically results in lower adoption rates for new technologies (Binswanger, Reference Binswanger1980; Hill, Reference Hill2009; Liu and Huang, Reference Liu and Huang2013; Ngoma et al., Reference Ngoma, Mason-Wardell, Samboko and Hangoma2019; Wik et al., Reference Wik, Aragie Kebede, Bergland and Holden2004). Some studies, however, suggest that risk aversion plays an insignificant role (Barham et al., Reference Barham, Chavas, Fitz, Salas and Schechter2014; Engle-Warnick, Escobal, and Laszlo, Reference Engle-Warnick, Escobal and Laszlo2006), or can even encourage the uptake of risk-reducing technologies (Belissa, Lensink, and Van Asseldonk, Reference Belissa, Lensink and Van Asseldonk2020; Brick and Visser, Reference Brick and Visser2015; Holden and Quiggin, Reference Holden and Quiggin2017; Liu and Huang, Reference Liu and Huang2013). This contradiction in the effects of risk aversion also calls for more context-relevant research that considers how risk preferences interact with local contextual factors, such as tenure arrangements and external shocks, to shape specific CSA technology adoption behavior in Uganda. We form our a priori expectations based on the first strand of literature and general models of adoption under uncertainty and learning by doing (e.g., Conley and Udry (Reference Conley and Udry2010) and Feder, Just, and Zilberman (Reference Feder, Just and Zilberman1985)), which predicts that more risk-averse farmers may postpone new practices or combinations of practices when early returns are unknown and less certain.
Finally, while the general literature in developing countries and studies conducted in Uganda recognize the connection between land tenure arrangements and disinvestment in land-based ventures (Abdulai, Owusu, and Goetz, Reference Abdulai, Owusu and Goetz2011; Besley, Reference Besley1995; Pedersen et al., Reference Pedersen, Spichiger, Alobo, Kidoido, Bashaasha and Munk Ravnborg2012; Place, Reference Place2009), the evidence remains mixed. Notably, no prior research has specifically examined the role of land tenure in shaping the adoption of CA and biochar combinations in Uganda. This study aimed to fill this gap by explaining disparities in CA and biochar investments across Uganda’s varied land tenure systems, private (freehold and leasehold), mailo, and customary, each of which carries distinct use rights and risks (Bashaasha, Reference Bashaasha2011; Musinguzi et al., Reference Musinguzi, Huber, Kirumira and Drate2021; Pedersen et al., Reference Pedersen, Spichiger, Alobo, Kidoido, Bashaasha and Munk Ravnborg2012; Walker et al., Reference Walker, Alix-Garcia, Bartlett, Van Den Hoek, Friedrich, Murillo-Sandoval and Isoto2023). In addition, the study examined how individual risk preferences and weather shocks interact with these tenure systems and how these interactions are associated with investments in CSA. The various systems of land tenure, including their history, evolution, prevalence, and associated risks and security,Footnote 3 are elaborately explained in the SI (text A, table A1). Customary tenure allows land use without formal titles, and rights are often guided by tradition. Freehold tenure grants exclusive ownership rights, while leasehold involves time-bound rental agreements of up to 99 years. Mailo tenure is a hybrid system unique to Uganda, with overlapping and often undocumented rights between owners and occupants (Pedersen et al., Reference Pedersen, Spichiger, Alobo, Kidoido, Bashaasha and Munk Ravnborg2012).
Overall, the aim of the study was not merely to confirm existing results in the literature but to highlight the important policy implications the study bears. Understanding the motivations and risk attitudes of farmers to adopt sustainable farming practices is considered crucial for policymakers who aim to increase adoption (Villacis, Bloem, and Mishra, Reference Villacis, Bloem and Mishra2023). By highlighting how the dynamics discussed earlier in the text play out within Uganda’s specific context, this research offers actionable insights for designing policies that can promote the uptake of climate-smart agricultural practices and enhance farmers’ adaptive capacity amid growing uncertainty in rainfall patterns.
2. Research methodology
2.1. Theoretical framework
Understanding smallholder farmer technology adoption decisions can be improved by considering a combination of structural factors (e.g., land tenure and resource constraints), behavioral factors (e.g., risk preferences), and environmental risks (e.g., drought shocks)(Bridle et al., Reference Bridle, Magruder, McIntosh and Suri2020; Feder, Just, and Zilberman, Reference Feder, Just and Zilberman1985; Holden and Quiggin, Reference Holden and Quiggin2017; Ngoma et al., Reference Ngoma, Mason-Wardell, Samboko and Hangoma2019; Suri and Udry, Reference Suri and Udry2022; Velandia et al., Reference Velandia, Rejesus, Knight and Sherrick2009). These diverse yet interconnected drivers of adoption are acknowledged in theoretical approaches used to study decisions under risk exposure and risk preferences.
First, expected utility theory predicts that smallholder farmers, when faced with production or market risks, make adoption decisions that maximize both profits and expected utility (Feder, Just, and Zilberman, Reference Feder, Just and Zilberman1985). Under this theory, farmers adopt CSA practices or combinations thereof only when perceived benefits outweigh perceived costs (ibid). Early studies applying expected utility theory showed that the likelihood of technology adoption decreases as risk aversion increases (Binswanger and Sillers, Reference Binswanger and Sillers1983; Binswanger, Reference Binswanger1980; Just and Zilberman, Reference Just and Zilberman1988).
Behavioral economic theories, however, acknowledge that smallholder adoption decisions may diverge from complete rationality due to bounded rationality, bounded willpower, and bounded selfishness (Kahneman and Tversky, Reference Kahneman, Tversky, MacLean, Ziemba and Hackensack2013; Kremer, Rao, and Schilbach, Reference Kremer, Rao and Schilbach2019; Visser et al., Reference Visser, le Roux, Mulwa, Tibesigwa and Bezabih2024). Bounded rationality implies that farmers often operate under cognitive and informational constraints, leading them to seek satisfactory rather than optimal solutions (Holden and Quiggin, Reference Holden and Quiggin2017; Kahneman and Tversky, Reference Kahneman, Tversky, MacLean, Ziemba and Hackensack2013; Liu and Huang, Reference Liu and Huang2013). For example, risk-averse farmers may reject or delay uptake of beneficial CSA technologies, despite potential gains, because of uncertainty about outcomes (Ngoma et al., Reference Ngoma, Mason-Wardell, Samboko and Hangoma2019). Bounded selfishness implies that social preferences, such as reciprocity, fairness, or reputation, can influence adoption decisions beyond individual utility maximization, while bounded willpower predicts underinvestment in long-term CSA innovations when present-biased preferences dominate (e.g., farmers preferring immediate benefits) (Kahneman and Tversky, Reference Kahneman, Tversky, MacLean, Ziemba and Hackensack2013).
Both expected utility theory and behavioral economic theory recognize the importance of contextual factors in shaping decisions under risk. For instance, exposure to climate shocks such as droughts can heighten awareness of risk and motivate adoption of adaptation measures but may also constrain investment if liquidity or social protection is limited (Angelsen and Dokken, Reference Angelsen and Dokken2018; Dercon, Reference Dercon2004; Holden and Quiggin, Reference Holden and Quiggin2017; Makate et al., Reference Makate, Angelsen, Mulesa and Westengen2025). This implies that weather shocks may influence adoption through several mechanisms highlighted in this literature, including liquidity constraints that reduce farmers’ capacity to invest (Dercon, Reference Dercon2004; Holden and Quiggin, Reference Holden and Quiggin2017), psychological scarring that alters levels of risk aversion after adverse events (Finger, Wüpper, and McCallum, Reference Finger, Wüpper and McCallum2023; Holden and Tilahun, Reference Holden and Tilahun2024; Liebenehm, Schumacher, and Strobl, Reference Liebenehm, Schumacher and Strobl2024), and learning effects based on observed technology performance under extreme conditions (Holden and Quiggin, Reference Holden and Quiggin2017; Makate et al., Reference Makate, Angelsen, Holden and Westengen2023). In our context, we would expect the empirical patterns to reflect farmers’ preventive measures to mitigate future drought impacts, informed by their past experiences with shocks and contingent on the availability of resources, while acknowledging that other channels may also be at play.
Also, perceived benefits that are expected to outweigh costs to promote adoption under expected utility theory are said to be influenced by contextual factors, including tenure security, access to resources, and information, among others (Feder, Just, and Zilberman, Reference Feder, Just and Zilberman1985; Knowler and Bradshaw, Reference Knowler and Bradshaw2007; Pannell, Llewellyn, and Corbeels, Reference Pannell, Llewellyn and Corbeels2014). For example, insecure land tenure is associated with lower adoption or investment in CSA practices with future-yield benefits, reinforcing short-term decision-making (Abdulai, Owusu, and Goetz, Reference Abdulai, Owusu and Goetz2011; Besley, Reference Besley1995; Pedersen et al., Reference Pedersen, Spichiger, Alobo, Kidoido, Bashaasha and Munk Ravnborg2012; Place, Reference Place2009).
We use these insights to provide a theoretical basis for explaining how individual risk preferences, exposure to drought shocks, tenure security, and other contextual factors could interact to shape CSA adoption outcomes, particularly conservation agriculture and biochar, in Uganda. Minimum tillage (basins, riplines), biochar, and their combination differ in their complexity and knowledge intensity and in how they shape production risks (Giller et al., Reference Giller, Witter, Corbeels and Tittonell2009; Pannell, Llewellyn, and Corbeels, Reference Pannell, Llewellyn and Corbeels2014). Minimum tillage practices primarily reduce crop yield variance by improving soil moisture retention and buffering crops against drought stress. They also stabilize crop yields, which can make them particularly attractive to risk-averse farmers. In contrast, biochar and its combination with minimum tillage practices may entail higher upfront labor, input requirements, and knowledge demands (Campion et al., Reference Campion, Bekchanova, Malina and Kuppens2023; Pannell, Llewellyn, and Corbeels, Reference Pannell, Llewellyn and Corbeels2014), making them more investment-and learning-intensive and potentially less appealing under uncertainty or liquidity constraints. These different risk profiles could imply that drought shocks and risk preferences may encourage the adoption of moisture-conserving practices like basins while discouraging the uptake of more complex technologies that require experimentation and delayed benefits like biochar.
2.2. Empirical strategy
The empirical strategy investigated three main objectives: (i) generating key variables for the analysis, including farmers’ levels of risk aversion and their exposure to rainfall shocks, (ii) examining the correlation between recent drought exposure and land tenure type with risk aversion; and (iii) assessing how risk aversion, drought shocks, and plot tenure jointly correlate with the adoption of climate-smart agricultural innovations.
2.2.1. Estimating risk aversion
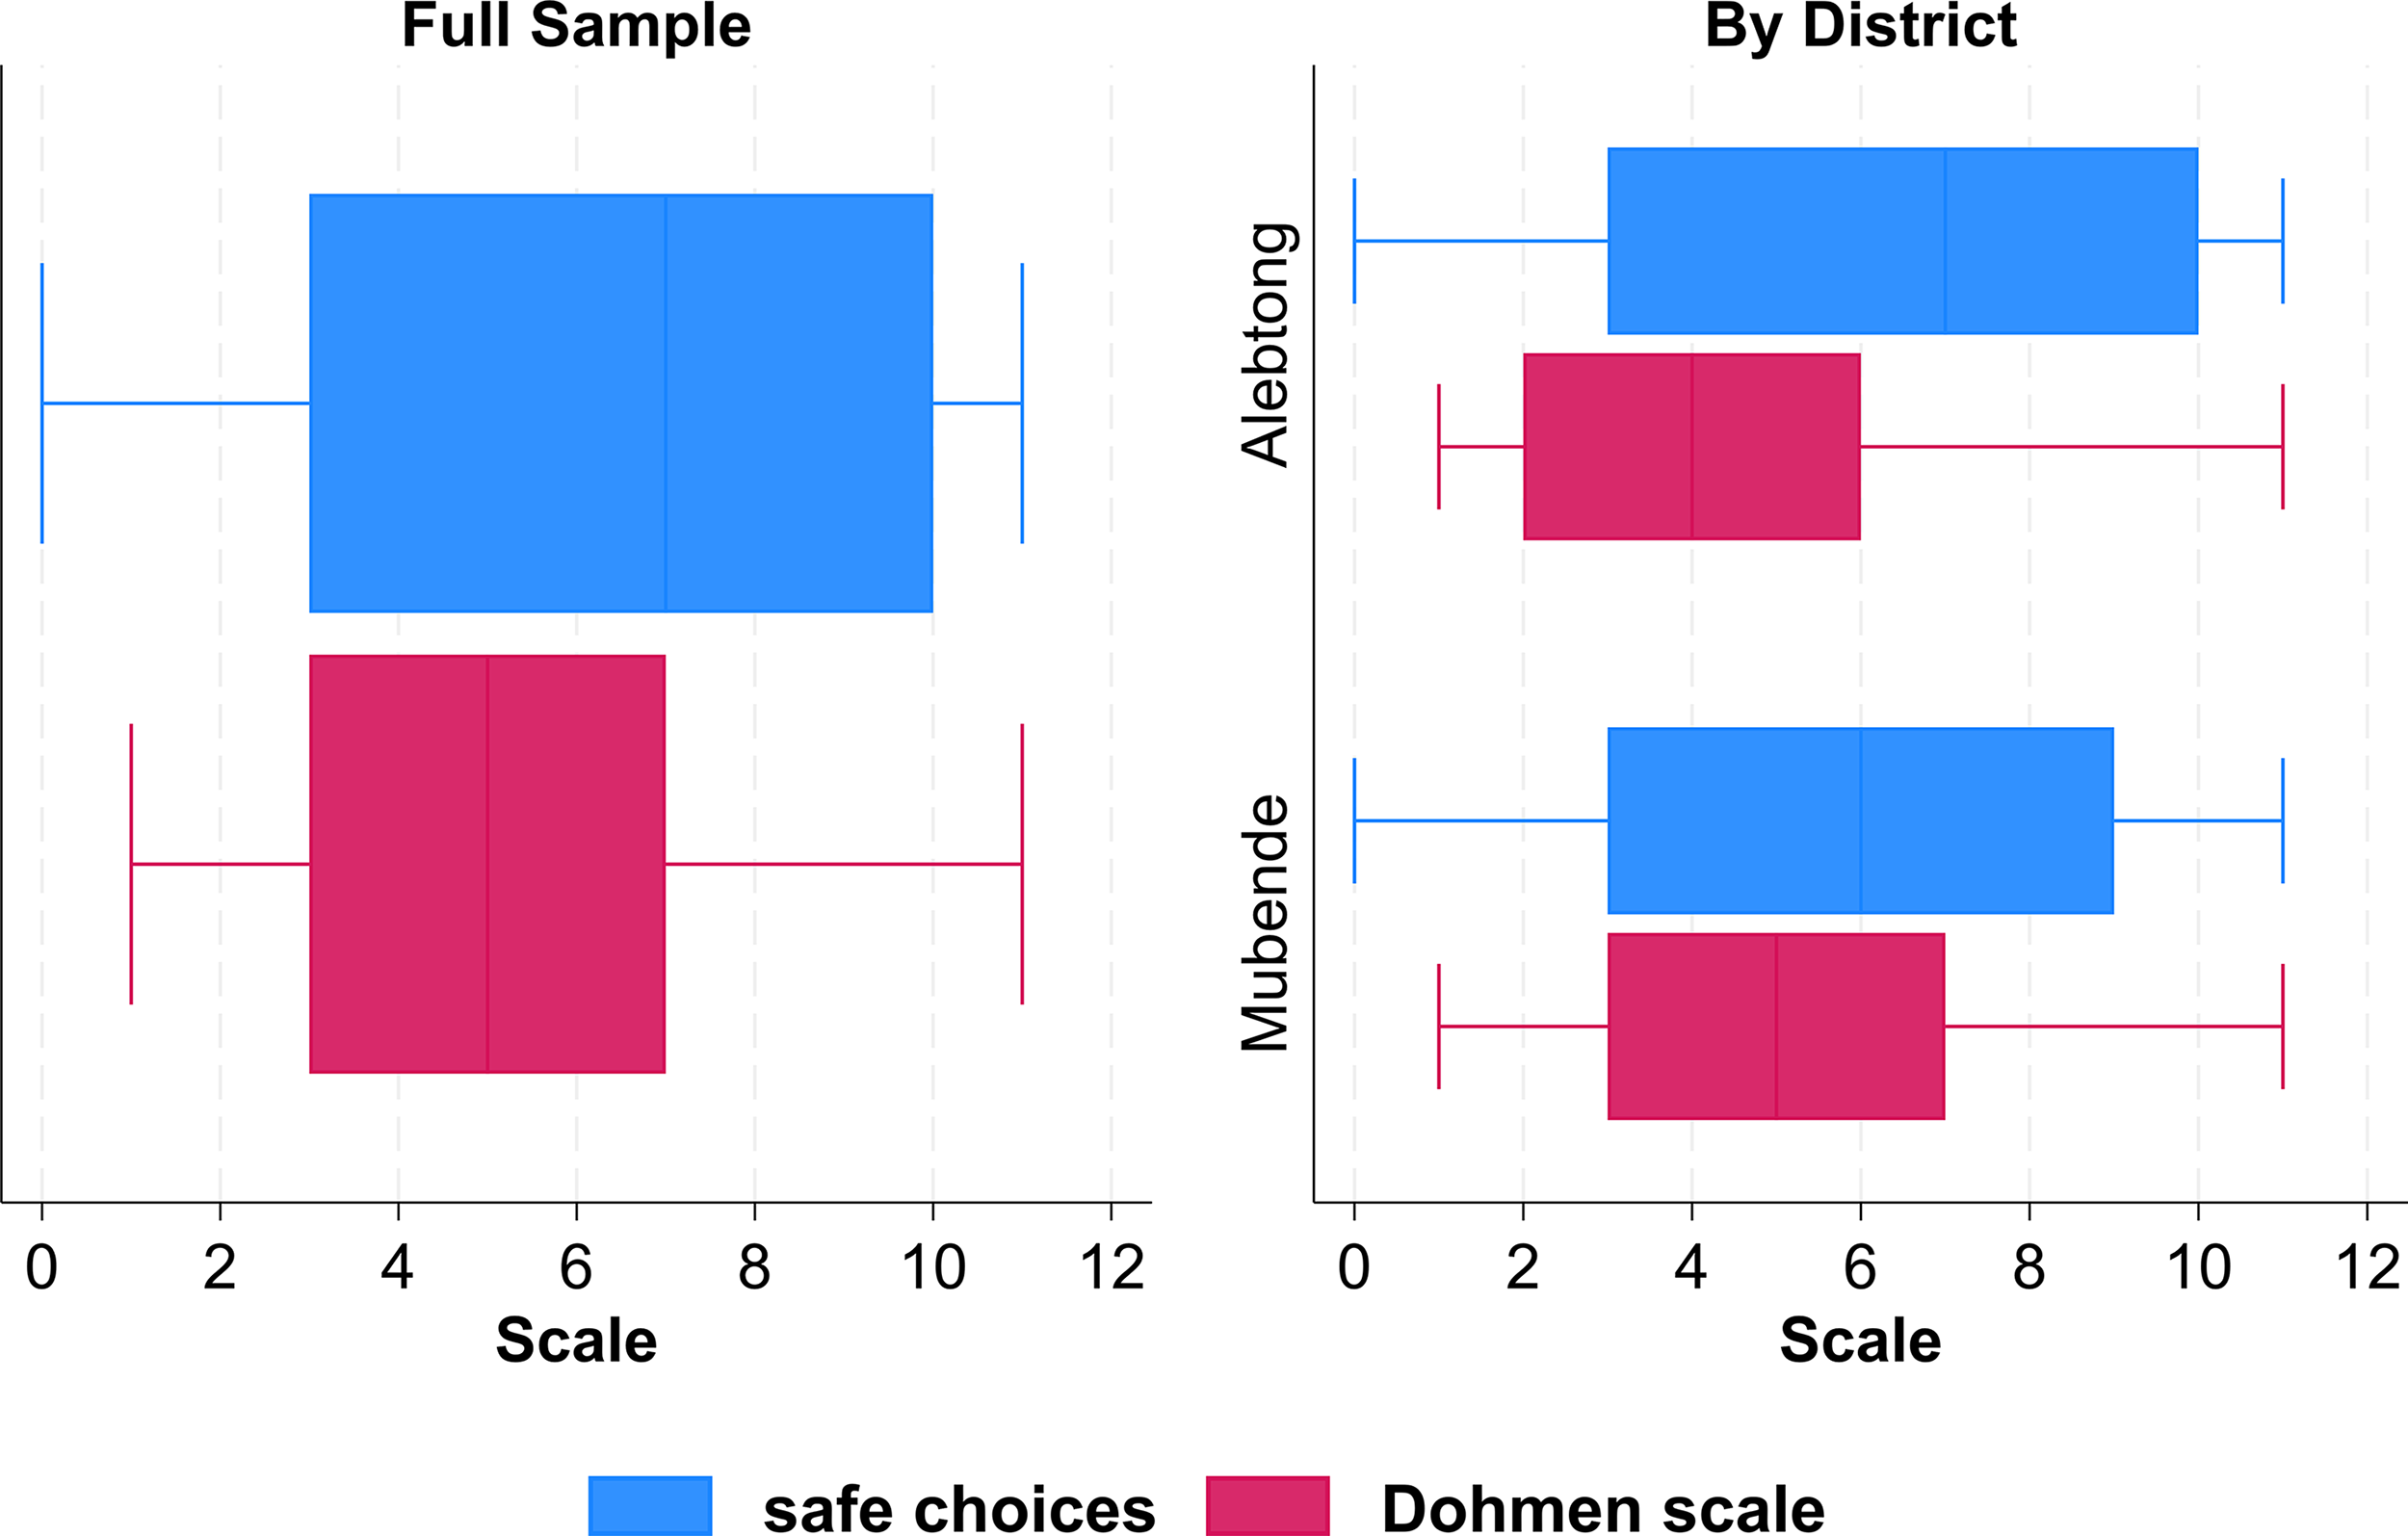
The study assessed risk aversion using two measures: (i) the number of safe choices made in the Holt and Laury (Reference Holt and Laury2002) risk experiment and (ii) the self-reported risk attitude measure based on the Dohmen et al. (Reference Dohmen, Falk, Huffman, Sunde, Schupp and Wagner2011) Likert scale. Combining these two measures provides a more robust and multidimensional assessment of risk preferences, capturing both objective and subjective dimensions of risk aversion. The coefficient of relative risk aversion (CRRA) for each individual, based on their switch point from a safe option to a risky option in the Multiple Price List (MPL) risk experiment, was also estimated to enable direct comparison of average risk aversion with previous studies. The CRRA was computed using the utility function V(w) = w 1 − φ /(1−φ), where w is the potential payoff and φ, is the risk aversion parameter (Pratt, Reference Pratt, Diamond and Rothschild1978). This approach follows prior research on CRRA estimation, particularly using the Holt and Laury (Reference Holt and Laury2002) method (e.g., (Belissa, Lensink, and Van Asseldonk, Reference Belissa, Lensink and Van Asseldonk2020; Holt and Laury, Reference Holt and Laury2002; Schleich et al., Reference Schleich, Gassmann, Meissner and Faure2019)). Figure 1 shows the distribution of the incentivized and self-reported measures of risk aversion. The correlation between the self-assessed and the objective measure of risk in our sample was about 0.35.
Distribution of (i) the average number of safe choices made in the Holt and Laury risk game and (ii) the self-reported risk attitude scores from Dohmen et al. (Reference Dohmen, Falk, Huffman, Sunde, Schupp and Wagner2011), shifted from a −10 to 0 scale to a 1–11 scale of increasing risk aversion, in the analyzed sample and by district.

2.2.2. Generating the standardized precipitation index (SPI)
This study used the Standardized Precipitation Index (SPI) to identify rainfall shocks. The SPI quantifies the deviation of rainfall from the long-term, location-specific average in terms of standard deviations, making it a robust measure for detecting anomalies such as rainfall shortages (referred to as “drought shocks” from this point forward) and rainfall excess (flood shocks). The SPI is endorsed by the World Meteorological Organization (WMO) for monitoring extreme climate events, as it effectively captures both wet and dry periods and can assess the severity of these events over different timescales. The SPI is spatially consistent, and it allows for meaningful comparisons of rainfall anomalies across diverse climates and agroecological zones, making it particularly useful for agricultural studies. While SPI is a widely accepted and reliable indicator of seasonal rainfall variability and shocks, its limitation lies in its exclusive focus on rainfall without considering other critical climate variables like temperature or potential evapotranspiration, which are essential for understanding broader climate change dynamics. Nonetheless, SPI remains a well-established metric for identifying rainfall shocks in agricultural contexts (e.g., (Liebenehm, Schumacher, and Strobl, Reference Liebenehm, Schumacher and Strobl2024; Makate et al., Reference Makate, Angelsen, Holden and Westengen2023; Michler et al., Reference Michler, Baylis, Arends-Kuenning and Mazvimavi2019)). The SPI for a specific period (t
n
), such as a season or a year, is calculated by standardizing the observed rainfall against long-term climatological data. The formula is expressed as
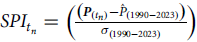 $SPI_{{t_{n}}}=\left({\left({\boldsymbol P}_{\left(t_{n}\right)}-\hat{P}_{\left(1990-2023\right)}\right) \over \sigma _{\left(1990-2023\right)}}\right)$
, where
P
(t
n
)
represents the total rainfall received during the selected period at a given location. The parameters and P̂
(1990−2023), and σ
(1990−2023) are the long-term mean and standard deviation of rainfall, respectively, calculated over a reference period (in this case, 1990–2023).
Given Uganda’s bimodal rainfall distribution, with two distinct rainy seasons each year, the SPI was calculated across multiple timescales: a 12-month period (January to December) to capture overall annual weather conditions and a 6-month scale, split into January to June and July to December, to reflect seasonal variability including the two main rainy seasons from March to May (long “MAM” rains) and September to November (short “SON” rains). For the analysis, the study primarily used the 12-month SPI but also examined season-specific SPI measures to assess whether drought shocks in one season were more strongly associated with farmer decision-making than those in the other.
The two measures of lagged rainfall shock variables were measured to examine their impact on household decisions: a 1-year lag (t-1) annual shock (January to December), rearrangedFootnote 4 to reflect increasing drought shock exposure, and a similar shock is defined for the most recent past seasonFootnote 5 (July to December). These lagged measures were used to capture recent drought exposure and to differentiate between shocks occurring at different times of the year. In supplementary analysis, we use a three-year lag of annual SPI to evaluate whether exposure to a more distant drought shock results in different implications for farmer adoption of CSA behavior. Our focus did not require crop-stage–specific drought indicators, as the behavioral mechanisms of interest – such as liquidity constraints following a difficult year, potential shifts in risk perceptions, and anticipatory adjustments in technology adoption – are likely shaped by broader, cumulative drought experiences rather than phenological shocks tied to specific crop growth stages. Figure 2 displays the average SPI(t-1) values in normalized standard deviations (z-scores), along with the historical mean and standard deviation of rainfall (1990–2023), categorized by period (January to June, July to December, and January to December) and district.
Average SPI(t-1) z-scores and historical rainfall statistics (in the analyzed sample) by period (Jan–Jun, Jul–Dec, Jan–Dec) and district. SD = standard deviation. The z-score here represents the unit for the normalized deviation of rainfall, indicating how many standard deviations a specific rainfall data point is from the mean.

The information presented in the figure revealed several notable insights: (i) Alebtong experienced both higher historical mean rainfall and greater variability compared to Mubende, (ii) rainfall in 2023 (January–December) and during the second season (July–December) was generally below the historical mean, while the first season (January–June) saw slightly above-average rainfall. This pattern indicated that below-normal rainfall conditions were more frequent in the studied areas, particularly during the second season (July–December).
2.2.3. Correlates of risk aversion
To investigate the determinants of risk aversion, the following linear regression model is estimated:
 $RA_{i}=\theta _{0}+\beta d_{it-1}+\vartheta X_{i}+\alpha R_{i}+\varepsilon _{i}$
Where RA i is the risk aversion measure for respondent i, captured through both the incentivized risk game (number of safe choices and CRRAFootnote 6 ) and the negative of the self-reported risk assessment score. The key independent variable d it − 1 is the 1-year lagged SPI, which captures recent past exposure to a drought shock. X i is a vector of individual and household characteristics (age, education, gender, household size, female ratio, livestock holdings, farm size, and land tenure). Covariate selection in equation 1 is guided by literature identifying farmer socioeconomic factors (e.g., age, education, gender, wealth), household attributes (e.g., composition and size), and covariate shocks (e.g., drought shocks) as key determinants of risk preferences (Dohmen et al., Reference Dohmen, Falk, Huffman, Sunde, Schupp and Wagner2011; Liebenehm, Schumacher, and Strobl, Reference Liebenehm, Schumacher and Strobl2024; Meissner et al., Reference Meissner, Gassmann, Faure and Schleich2023). We use the tropical livestock units (TLUs) metricFootnote 7 (Jahnke and Jahnke, Reference Jahnke1982) to convert different types of livestock into a standardized measure of total holdings. Land tenureFootnote 8 is represented by dummy variables for the different tenure categories, private (leasehold or freehold) and mailo, with customary tenure serving as the reference category. R i is a set of binary (dummy) variables, each representing a specific village, and ϵ i captures the variation in risk preferences that cannot be explained by the observed variables in the model. Equation (1) is estimated using a linear regression model via ordinary least squares (OLS) that reports robust standard errors to account for heteroscedasticity (Wooldridge, Reference Wooldridge2010). The analysis began with simpler specifications that excluded household control variables to isolate core relationships between hypothesized key variables (i.e., drought shocks and land tenure) and risk preferences, and it later incorporated full models with all relevant controls. This structured approach facilitated the assessment of both the sensitivity of the estimates to omitted variable bias and the likelihood of spurious correlations arising from potentially endogenous household covariates.
2.2.4. Correlation of risk aversion and risk exposure with adoption
The correlations between risk aversion and lagged drought shocks (as covariates) and the adoption intensity of climate-smart agricultural practices at the plot level were analyzed using fractional logit regression models (Papke and Wooldridge, Reference Papke and Wooldridge1996, Reference Papke and Wooldridge2008). Fractional logit models were considered appropriate because the dependent variables for CSA technology adoption (area shares allocated to the technology) are fractions bounded between 0 and 1. The basic specification used is as follows:
 $E(Ad_{ip}| V)={\rm G} (\delta +\theta RA_{i}+\tau d_{it-1}+\emptyset Z_{ip}+\vartheta X_{i}+\alpha R_{i}),$
Where Ad ip , denotes the observed fractional area share of plot p allocated to a CSA practice, G(.) is the logistic link function. RA i is the risk aversion variable, while in d it − 1 we include a measures of lagged climate shock (i.e., drought shockFootnote 9 ), Z ip captures plot-level characteristics (e.g., distance to plot (km) and plot area (ha)), and X i is a vector of household-level characteristics (e.g., age, gender of household head, livestock units, and social connections within the villageFootnote 10 ). Regional and treatment assignment fixed effects are controlled for using dummy variables for district Mubende and assignment to CA and biochar interventionFootnote 11 (R i ). Because plots are nested within households, standard errors are clustered at the household level. To aid interpretation, we compute average marginal effects (AMEs) of key explanatory variables, ∂E[Ad ip |V]/∂V k , which describe how small changes in V k , are associated with percentage-point changes in the expected adoption shares. Since the dependent variables are adoption shares bounded between 0 and 1, these marginal effects are interpreted as percentage-point changes in the expected share of cultivated area allocated to a given CSA practice associated with a one-unit change in the explanatory variable.
2.2.5. Heterogeneity analysis to include land tenure effects
Heterogeneity analyses were conducted to investigate how land tenure moderates the relationships between risk aversion, drought shocks, and technology adoption. Understanding these interactions is vital because, in theory, tenure security correlates with farmers’ willingness to invest in climate-smart agricultural innovations. Secure tenure may reduce the risks associated with technology adoption, while insecure tenure can amplify the correlation of risk aversion or shocks. In heterogeneity analyses, two interaction terms (RA i ×Tenure ip ) and (d it − 1 × Tenure ip ), were introduced in separate specifications as follows:
 $E(Ad_{ip}| V)={\rm G} (\delta +\gamma (RA_{i}\times {Tenure}_{ip})+\tau d_{it-1}+\emptyset Z_{ip}+\vartheta X_{i}+\alpha R_{i})$
 $E(Ad_{ip}| V)={\rm G} (\delta +\theta RA_{i}+\omega (d_{it-1}\times {Tenure}_{ip})+\emptyset Z_{ip}+\vartheta X_{i}+\alpha R_{i})$
These equations facilitate testing whether land tenure moderates the effects of risk aversion (eqn 3) and drought shocks (eqn 4) on CSA practice adoption. In other words, the aim was to (i) investigate whether risk aversion correlates with differential investments in CSA innovations across different land tenure regimes and (ii) examine how drought-induced risk potentially correlates with ex-post decisions to invest in CSA practices, depending on the security and type of land tenure on the plot.
2.2.6. Robustness analysis
The study conducted several sensitivity tests that provided confidence in the stability and validity of the main findings linking risk preferences and risk exposure to adoption. The first sensitivity analysis was conducted using an alternative measure of drought shock exposure by utilizing the SPI defined for the last season (July to December 2023) instead of the SPI calculated for the entire previous year (January to December 2023). Second, an analysis of the association between risk preferences and drought shocks on adoption was done using household-plot panel data covering multiple seasons and collected for a sub-sample of households post-baseline (from 2022 to 2024). This approach allowed for the observation of changes over time in relationships but was based on the strong assumption that individual household risk preferences remain stable across those years. Also, although time-variant socioeconomic factors not captured in this supplementary data could not be controlled for, the incorporation of year-to-year lagged drought shocks provided a better understanding of how these shocks correlated with subsequent CSA adoption decisions over time. In addition, we assess whether the tenure-related patterns depend on formal tenure categories by using plot acquisition status as a supplementary robustness check, distinguishing inherited, purchased, and rented plots. Rented plots are treated as a less secure form of land access relative to inherited or purchased plots. In addition, the self-reported measure of risk aversion was also used instead of the incentive risk measure in the main analysis, which linked risk aversion to CSA adoption to determine if similar conclusions were reached. We conducted several additional robustness analyses to assess the stability of our main correlations, including adding additional covariates (such as the heat-stress indicator and treatment-assignment fixed effects), complementing the intensive adoption outcomes with extensive adoption outcomes, and applying Conley (Reference Conley1999) spatial heteroskedasticity- and autocorrelation-consistent (HAC) standard errors, which adjust the standard errors to account for spatial dependence in covariate drought shocks. We retain household-clustered standard errors in the main fractional-logit models because adoption is measured at the plot level, with multiple plots observed for the same household. For the Conley spatial-HAC robustness check, we estimate linear adoption-share specifications using 50 km, 100 km, and 150 km cutoffs, allowing us to assess whether the results are sensitive to the spatial range of correlated drought shocks. The main insights from these robustness tests are summarized in the supplementary material, and the results consistently reflect the same relationships as those reported in the main analysis.
2.3. Data
The study used three different data sources, including (i) a household survey, (ii) a lab-in-the-field risk experiment, and (iii) longitudinal climate data.
2.3.1. Household survey data
The household survey data used in this study come from the endline survey of a randomized control trial (RCT) conducted in two districts of Uganda: Alebtong in Northern Uganda (Latitude 2.2450° N, Longitude 33.2767° E) and Mubende in Central Uganda (Latitude 0.5890° N, Longitude 31.3600° E). The baseline survey was conducted in May 2021, and an endline survey was carried out in July 2024. After the 2021 baseline survey, treatment-group households in both Mubende and Alebtong participated in a structured series of training sessions facilitated by field officers from Rural Enterprise Development Solutions (REDS Uganda), conducted between August 2021 and March 2022. The RCT was an information and training intervention implemented to build farmers’ capacity to adopt climate-smart agricultural practices. The curriculum covered (i) principles and core practices of CA; (ii) basin and rip-line preparation and planting techniques; (iii) weed management; (iv) pest and disease management; (v) post-harvest handling and storage; (vi) biochar production from locally available crop residues (for example, pigeon-pea stems); and (vii) biochar application and planting methods. Farmers in the CA group received training modules (i–v), while those in the CA + biochar group received the full curriculum (i–vii). We draw on cross-sectional data covering 442 households (210 from Mubende and 232 from Alebtong) and 927 plots,Footnote 12 which provides detailed information on crop production activities, from land preparation to harvest, as well as the use of various soil and land management practices, including planting basins, rip lines, crop residue retention, and biochar application. Within each district, four villages were randomly selected, and within each village, at least 50 households were targeted for interview. While the aim of the study was not to construct a district-representative sample, the demographic and agricultural characteristics of surveyed households are qualitatively comparable to district-level patterns observed in the Uganda LSMS-ISA panel surveys. The household survey was complemented with data from an incentivized field experiment designed to measure individual farmers’ risk preferences (more details below). The survey data captured a broad range of household characteristics, including demographic information of household heads, farming practices, and the adoption of agricultural technologies at the plot level. Technology adoptionFootnote 13 for household (i) on plot (p) is defined as the proportion of the household’s cultivated area dedicated to a specific technology, such as basins, rip lines, biochar application, or combinations like basins, rip lines, or minimum tillageFootnote 14 with biochar: Adoption ip = (Area under Technology ip )/(Total cultivated Area i ). Unconditional and conditional average shares of the household’s cultivated area allocated to each technology, measured at the endline survey, are presented in Table 2.
2.3.2. Lab-in-the-field risk experiment
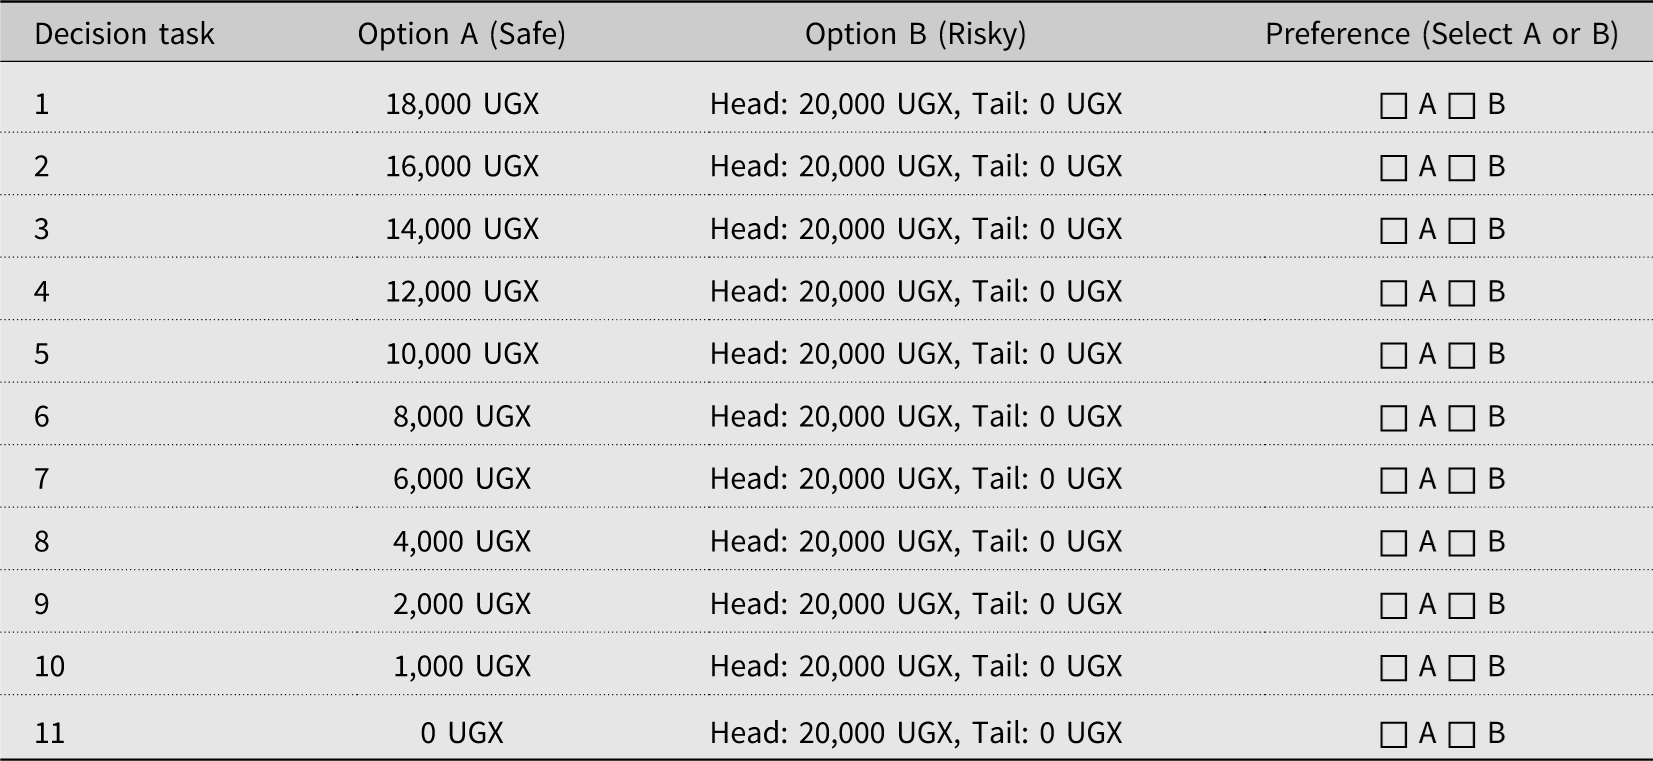
An incentivized lab-in-the-field risk experiment was conducted to elicit risk preferences among smallholder farmers. This experiment was embedded in the household survey and included all participating farmers. To achieve this, the MPL framework developed by Holt and Laury (Reference Holt and Laury2002) (“Holt and Laury mechanism”) was employed, where respondents made 11 sequential choices between a certain payoff and a lottery with a 50% probability of winning a higher amount or receiving nothing (Table 1).
Decision tasks, based on Holt and Laury (Reference Holt and Laury2002), summarized in a table format

Table 1. Long description
A table with 11 rows and 4 columns. The columns are labeled Decision task, Option A (Safe), Option B (Risky), and Preference (Select A or B). Each row presents a decision task with a corresponding safe option in UGX, a risky option with head and tail outcomes in UGX, and a preference selection between A and B. Row 1: Decision task 1, Option A 18,000 UGX, Option B Head: 20,000 UGX, Tail: 0 UGX, Preference A or B. Row 2: Decision task 2, Option A 16,000 UGX, Option B Head: 20,000 UGX, Tail: 0 UGX, Preference A or B. Row 3: Decision task 3, Option A 14,000 UGX, Option B Head: 20,000 UGX, Tail: 0 UGX, Preference A or B. Row 4: Decision task 4, Option A 12,000 UGX, Option B Head: 20,000 UGX, Tail: 0 UGX, Preference A or B. Row 5: Decision task 5, Option A 10,000 UGX, Option B Head: 20,000 UGX, Tail: 0 UGX, Preference A or B. Row 6: Decision task 6, Option A 8,000 UGX, Option B Head: 20,000 UGX, Tail: 0 UGX, Preference A or B. Row 7: Decision task 7, Option A 6,000 UGX, Option B Head: 20,000 UGX, Tail: 0 UGX, Preference A or B. Row 8: Decision task 8, Option A 4,000 UGX, Option B Head: 20,000 UGX, Tail: 0 UGX, Preference A or B. Row 9: Decision task 9, Option A 2,000 UGX, Option B Head: 20,000 UGX, Tail: 0 UGX, Preference A or B. Row 10: Decision task 10, Option A 1,000 UGX, Option B Head: 20,000 UGX, Tail: 0 UGX, Preference A or B. Row 11: Decision task 11, Option A 0 UGX, Option B Head: 20,000 UGX, Tail: 0 UGX, Preference A or B.
Descriptive statistics of variables used in the analysis

Table 2. Long description
A table comparing adoption rates and characteristics of agricultural practices in two regions, Alebtong and Mubende. The table has 30 rows and 12 columns. Columns are grouped into three sections: Pooled, Alebtong, and Mubende, each with mean, standard deviation (sd), and count. Row labels include various adoption metrics and household characteristics. Notable trends include higher adoption rates in Mubende for most practices compared to Alebtong. For example, basin share percentage is higher in Mubende (0.10) than in Alebtong (0.02). Similarly, biochar area percentage is higher in Mubende (0.16) than in Alebtong (0.04). Household characteristics such as age, gender, and education levels are also compared across the regions.
Count = number of plot observations; the pooled sample includes 442 households: 210 from Mubende and 232 from Alebtong districts.
The MPL method used closely followed established protocols from prior studies (e.g.,(Belissa, Lensink, and Van Asseldonk, Reference Belissa, Lensink and Van Asseldonk2020; Holt and Laury, Reference Holt and Laury2002; Schleich et al., Reference Schleich, Gassmann, Meissner and Faure2019)) with minimal adjustments to fit the local context. Each respondent was presented with 11 decision tasks (Table 1), where they had to choose between two options: Option A offered a certain payoff, from 18,000 Ugandan Shillings (UGX) in Decision 1 to 0 UGX in Decision 11, while Option B provided a 50-50 chance of winning 20,000 UGX or nothing. The probabilistic choice was implemented using a standard Ugandan shilling coin toss, with Heads yielding 20,000 UGX and Tails resulting in 0 UGX. After making their choices, respondents randomly picked one card from a set numbered 1 to 11, which determined the decision line used for actual payment to the respondent. For example, if a respondent selected Option A in Decision task 1, they received the sure amount (18,000 UGX). If they selected Option B in the same decision, a coin toss decided whether they received 20,000 UGX or nothing (Table 1). The average expected payoffs from the experiment, combined with a show-up fee of 2,000 UGX, were substantially higher than typical daily earnings in the study areas.
In addition to the incentivized (Holt and Laury) risk experiment, the study also incorporated a stated measure of risk aversion, developed by Dohmen et al. (Reference Dohmen, Falk, Huffman, Sunde, Schupp and Wagner2011). This measure has been validated in the literature as a reliable proxy for risk preferences, similar to incentivized methods (see Falk et al. (Reference Falk, Becker, Dohmen, Huffman and Sunde2023)). The survey asked respondents to rank themselves on an 11-point Likert scale in response to the question: “Are you generally a person who is fully prepared to take risks, or do you try to avoid taking risks? Please choose a number on a scale from 0 (unwilling to take risks) to 10 (fully prepared to take risks).” Details on the research protocol can be found in the supplementary material (section C).
2.3.3. Climate data
Georeferenced household location data were used to extract corresponding monthly rainfall data from the Climate Hazards Group InfraRed Precipitation with Station (CHIRPSFootnote 16 ) dataset (Funk et al., Reference Funk, Peterson, Landsfeld, Pedreros, Verdin, Shukla and Husak2015) and monthly temperature data from TerraClimate,Footnote 17 covering the period from January 1990 to July 2024. These data sets are used to define proxies for drought shocks and heat stress.
3. Results and discussion
3.1. Descriptive statistics
Table 2 presents the descriptive statistics for key variables used in the study. Across the full sample analyzed, adoption of individual CSA innovations was generally low, with cultivated plot area shares under these practices ranging from approximately 2% (rip line with biochar) to 19% (minimum/zero tillage practices) (Table 2). However, for farmers who did adopt these innovations, the share of cultivated land under CSA practices was substantially higher, ranging from 38 to 60%.
Among the sample of plots analyzed, the most common form of land tenure is customary tenure (64.9%), followed by Mailo tenure (27.1%) and private tenure (6.9%), consistent with trends recognized in the literature (Pedersen et al., Reference Pedersen, Spichiger, Alobo, Kidoido, Bashaasha and Munk Ravnborg2012). Regarding methods of land acquisition, most plots were inherited (60.6%), while 24.5% were bought and 14.9% were rented (SI Figure B2).
On average, cultivated plots were approximately 0.7 hectares in size and were located within reasonably close proximity to the household, with an average distance of 0.9 km (Table 2). Hence, households operate on small, manageable plots located reasonably near the homestead, which likely facilitates easier access for management.
Both incentivized (Holt and Laury) and self-reported measures indicated that, on average, farmers are risk-averse. Farmers chose 6 out of 11 safe options in the risk game on average, and their transformed self-reported risk scoreFootnote 18 averaged −6.3 on a scale from −10 (extremely risk-averse) to 0 (extremely risk-loving) (Table 2). The CRRA further confirms this, with a sample average of 0.82 on a scale from −1.73 (extremely risk-loving) to 3.73 (extremely risk-averse) (Table 2). Risk aversion levels were high and similar in both districts, with no significant differences observed, as indicated by the comparable distributions across districts (Figure 1). Farmers in Alebtong chose an average of 6.2 out of 11 safe options, with a risk attitude score of −6.5, while farmers in Mubende chose an average of 5.6 safe options, with a risk attitude score of −6.0 (Table 2). The average CRRA is 0.88 in Alebtong and 0.71 in Mubende, reflecting similar patterns of risk aversion across the districts.
On average, farmers in the analyzed sample were relatively young (44.8 years) and had a high level of education; 93% had attained at least primary education, with an average of about 7 years of schooling. Most households were male-headed (61%), and households had an average female member ratio of 31%. In addition, households reported an average of 8 social connections that the household can rely on for critical support in times of need within the village. In terms of assets, households own an equivalent of 3.6 mature cattle (2.5 TLUs) and cultivated farms averaging 1.7 hectares in size.
3.2. Correlations with risk aversion
The results reporting factors correlated with individual risk preferences are presented in Table 3. A 1-standard-deviation increase in drought shocks (t-1) was associated with significantly greater risk aversion, evidenced by an increase of 3 to 4 more safe choices in the incentivized risk game and a shift in the self-reported risk attitude scale by about 4 points toward being more risk-averse. This finding aligned with recent literature linking drought exposure to shifts in risk preferences, suggesting that farmers may become more cautious in their decision-making following a drought shock (e.g., (Cameron and Shah, Reference Cameron and Shah2015; Liebenehm, Schumacher, and Strobl, Reference Liebenehm, Schumacher and Strobl2024)). For instance, Liebenehm, Schumacher, and Strobl (Reference Liebenehm, Schumacher and Strobl2024), using data from both Thailand and Vietnam, found that rainfall shocks increased individuals’ risk aversion, with the largest increase observed among households that are net buyers of food commodities. Also, Cameron and Shah (Reference Cameron and Shah2015) found that rainfall shocks increased the risk aversion of selected individuals in rural Indonesia, as experiencing a natural disaster led people to perceive a greater risk of future disasters.
Factors explaining individual risk aversion preferences

Table 3 Long description
The table presents factors correlated with individual risk preferences, with six columns and twelve rows. The columns are labeled ‘Number of safe choices’, ‘Risk attitude scale’, and ‘Coefficient of Relative Risk Aversion (CRRA)’, each with two sub-columns. The rows include variables such as drought shock, private tenure, mailo tenure, age, education, gender, household size, female ratio, tropical livestock unit, and total farm size. Each cell contains numerical values and standard errors in parentheses. Notable trends include significant associations between drought shocks and increased risk aversion, as well as the impact of private tenure and age on risk preferences.
Notes: Robust standard errors in parentheses * p < 0.10, ** p < 0.05, *** p < 0.01; CRRA=Coefficient of relative risk aversion. Columns 1 and 2 use the number of safe choices as the dependent variable, Columns 3 and 4 use the Dohmen risk attitude scale, and Columns 5 and 6 use the Holt and Laury incentivized risk measure. All specifications are estimated using linear regression via ordinary least squares (OLS), with robust standard errors to account for heteroscedasticity.
In addition, having private tenure as the main form of land tenure within the household was associated with significantly lower levels of risk aversion compared to customary tenure, with farmers on private land making 1.7 fewer safe choices and scoring about 1.4 points lower on the self-reported risk aversion scale (Table 3). These results could suggest that the security provided by private tenure correlates with reduced farmers’ risk aversion, aligning with previous literature that links improvements in tenure security to lower perceived risks and improved investment in land (Deininger and Chamorro, Reference Deininger and Chamorro2004; Holden, Deininger, and Ghebru, Reference Holden, Deininger and Ghebru2011). The comparison between customary and mailo tenure showed no significant differences in correlation with risk aversion, which could imply that while private tenure security reduces risk aversion, mailo tenure might not provide a similar level of perceived security.
Furthermore, the results indicate that older farmers and female-headed households are more risk-averse than their younger and male-headed counterparts.
3.3. Risk aversion, risk exposure, and CSA adoption
Regarding the relationship between risk aversion and plot shares with CSA technologies (Figure 3), the study found risk aversion not to be a significant deterrent to adoption. Rather, a marginal one-unit increase in the number of safe choices made in the risk game was associated with + 0.5, + 0.3, and + 0.4 percentage point increases in the share of plot area devoted to basins, a combination of biochar with basins, and a combination of biochar and any minimum tillage practice, respectively (Figure 3). Contrary to the literature that found risk aversion to hinder CSA adoption (e.g., Ngoma et al. (Reference Ngoma, Mason-Wardell, Samboko and Hangoma2019)), risk aversion did not appear to be a barrier to CSA adoption in our study context. Rather, the observed increase in adoption of minimum tillage (i.e., basins) among more risk-averse farmers likely reflects their concern about negative outcomes, particularly the growing threat of rainfall shortages (droughts) relative to long-term rainfall patterns (Figure 2). Basins, as a key drought adaptation strategy, seem to offer these farmers a form of insurance against increased climate risk in drier conditions. This notion also aligns with previous studies that have found risk aversion to enhance the uptake of technologies seen by farmers as risk-reducing in the outcome domain (Belissa, Lensink, and Van Asseldonk, Reference Belissa, Lensink and Van Asseldonk2020; Hadera and Tadesse, Reference Hadera and Tadesse2023; Holden and Quiggin, Reference Holden and Quiggin2017; Liu and Huang, Reference Liu and Huang2013).
The relationship between risk aversion (measured by the number of safe choices made in the Holt & Laury risk game, left panel), drought shock z-score from the previous year (middle panel), and land tenure category (with customary tenure as the reference) on CSA adoption (proportion of land area under CSA innovations). The plot shows average marginal effects with 95 and 99% confidence intervals. The estimates are interpreted as percentage-point changes in the expected share of land area under each CSA technology associated with a one-unit increase in the number of safe choices, a one-standard-deviation increase in the lagged drought shock z-score, and private or Mailo tenure (relative to customary tenure).

In contrast to the pattern observed for risk preferences, exposure to drought shocks (t-1) was associated with lower adoption of CSA innovations at the plot level. A 1-standard-deviation increase in drought shocks (t-1) was associated with substantial percentage-point reductions in land allocated to CSA practices, with percentage-point decreases of −8.1 for basins, −7.7 for minimum tillage (practices in general), and −7.9 for biochar, and similar declines for combinations of biochar with basins (−8.7), rip lines (−2.2), and minimum tillage practices in general (−6.3) (Figure 3). These findings suggest that while CSA practices are designed to mitigate climate risks, severe drought shocks can significantly reduce farmers’ capacity to adopt or sustain them. This phenomenon is likely due to immediate resource constraints, such as depleted savings or diminished liquidity following a drought shock (Dercon, Reference Dercon2004), which limits investment in the necessary inputs for CSA adoption, such as herbicides, hired labor and tilling hoes. In rural settings where farmers are highly dependent on agriculture and lack access to insurance markets, such as the ones studied, the repercussions of a bad season exacerbate both ex-ante and ex-post responses to shocks, often leading to reduced adoption of beneficial technologies (Angelsen and Dokken, Reference Angelsen and Dokken2018; Dercon, Reference Dercon2004; Makate et al., Reference Makate, Angelsen, Holden and Westengen2022).
Formal land tenure category was not significantly associated with the observed disparities in CSA adoption at the plot level. However, plots under Mailo and private tenure showed higher expected adoption shares for the combination of biochar and minimum tillage, by 8.9 and 5.7 percentage points, respectively, relative to plots under customary tenure (Figure 3). These results should be interpreted with caution because tenure categories are unevenly distributed across districts in our sample. Customary tenure is concentrated in Alebtong, while Mailo and private tenure are concentrated in Mubende, where CSA adoption is also higher. Although the adoption models control for district fixed effects, the limited overlap in tenure categories across districts means that the tenure coefficients may partly reflect other district-level differences, including agroecology, market access, intervention implementation, institutional history, or unobserved farmer characteristics. With this caveat, the positive association between non-customary tenure categories and adoption of biochar with minimum tillage is consistent with the broader literature linking more secure land rights to investment in land-improving practices whose benefits accrue over time (Deininger and Mpuga, Reference Deininger and Mpuga2003; Holden, Deininger, and Ghebru, Reference Holden, Deininger and Ghebru2011; Pedersen et al., Reference Pedersen, Spichiger, Alobo, Kidoido, Bashaasha and Munk Ravnborg2012; Tesfay, Reference Tesfay2020). This interpretation is also consistent with the nature of biochar and minimum tillage as practices whose benefits for soil fertility, moisture retention, and crop performance may unfold over several seasons. Previous studies further show that biochar and related CSA practices can increase soil carbon content (Martinsen et al., Reference Martinsen, Munera-Echeverri, Obia, Cornelissen and Mulder2019; Munera-Echeverri et al., Reference Munera-Echeverri, Martinsen, Strand, Cornelissen and Mulder2020), making sustained adoption relevant not only for farm-level soil quality and resilience but also for broader climate mitigation objectives. Thus, strengthening tenure security, particularly where farmers face uncertainty over continued use of land, may therefore be one enabling condition for longer-horizon investments in such practices.
3.4. Heterogeneity analysis
The study also assessed whether risk preferences would lead to differential associations with CSA innovation adoption across land tenure regimes (customary vs. non-customary (private/mailo)) and ownership statuses (inherited/purchased vs. rented) (Figure 4). The results indicated that risk aversion was positively associated with increased adoption of basins, riplines, and the combination of biochar and minimum tillage practices on non-customary tenure plots. Similarly, on owned plots, an increase in risk aversion is associated with higher adoption shares for basins, riplines, and the combination of biochar with minimum tillage practices (Figure 4). These results suggest that farmers with relatively more secure tenure or ownership status (compared to renting status) are more likely to adopt CSA innovations (using riplines or basins with or without biochar), as they anticipate long-term benefits that outweigh the risks associated with these investments.
Heterogeneity: summary plot showing whether risk preferences, measured as the number of safe choices made in the Holt & Laury risky game, is associated with differential CSA adoption on plots in different regimes of land tenure (customary vs non-customary (private/mailo)) or with differing ownership status (owned vs rented). Shown are average marginal effects with 95 and 99% confidence intervals. The estimates are interpreted as percentage-point changes in the expected share of land area under CSA adoption associated with a one-unit increase in the number of safe choices made in the Holt and Laury risk game.

Prioritizing investments on owned or securely tenured plots makes sense because secure tenure lowers the risks of expropriation, incentivizing long-term investments in land-improving technologies (Besley, Reference Besley1995; Pedersen et al., Reference Pedersen, Spichiger, Alobo, Kidoido, Bashaasha and Munk Ravnborg2012; Place, Reference Place2009).
The analysis also revealed important heterogeneity in the association between drought shocks and CSA adoption across tenure and ownership categories (Figure 5). While drought shocks were associated with reduced adoption shares across both rented and owned plots as well as plots under customary and non-customary tenure, the negative correlations were more pronounced on plots under customary tenure. Specifically, investments in rip lines, biochar-rip line combinations, and biochar with minimum tillage were lower on customary tenure plots compared to non-customary (private or mailo) tenure.
Heterogeneity: summary plot showing whether drought shock z-score (t-1) is associated with differential CSA adoption across land tenure regimes (customary vs. non-customary (private/Mailo)) and ownership statuses (owned vs. rented). Shown are the average marginal effects along with their 95 and 99% confidence intervals. The estimates are interpreted as percentage-point changes in the expected share of land area under CSA adoption associated with a one-standard-deviation increase in the lagged drought shock z-score(t-1).

These results highlighted the vulnerability of farmers under customary tenure, where insecure land rights can discourage long-term investments, particularly under drought shocks. Prioritizing investments on relatively more secure plots is crucial, as secure tenure not only increases farmers’ confidence in realizing long-term returns but also enhances their resilience to shocks (Abdulai, Owusu, and Goetz, Reference Abdulai, Owusu and Goetz2011; Deininger and Jin, Reference Deininger and Jin2006).
4. Conclusion and policy implications
This study addressed two main research questions: (i) Do drought shocks and insecure land tenure show an association with risk aversion in rural Uganda? and (ii) What is the relationship between risk aversion, land tenure, drought shocks, and the adoption of climate-smart innovations in Uganda? The study relied on data from multiple sources, including household and plot-level data, farm-specific weather data, and risk preferences data from an incentivized economic field experiment, to answer these research questions. Findings from this study lead to clear conclusions and policy implications.
Heightened risk aversion is a defining characteristic among smallholder farmers in rural Uganda, with recent drought shocks associated with intensified risk aversion, while access to relatively more secure forms of land tenure, such as private land tenure, is associated with reduced risk aversion. Older farmers and female-headed households displayed heightened risk aversion compared to their younger and male-headed household counterparts. Risk aversion did not correlate with reduced CSA adoption; rather, higher risk aversion correlated with greater uptake of risk-reducing practices such as basins and basins plus biochar. Planting basins mitigate drought-related losses by enhancing water retention and crop establishment and, since they require no specialized equipment, remain accessible to resource-constrained farmers. Biochar, on the other hand, not only improves water retention but also addresses challenges related to soil fertility, decreases the chance of low crop yields, and is made from locally available organic residues. Hence, framing such CSA practises as climate risk management options may be associated with greater uptake in drought-prone, low-soil-fertility areas, especially among risk-averse farmers, while positioning them as pro-poor solutions.
Drought shocks, however, remain a formidable barrier to CSA adoption, as they are associated with reduced land areas allocated to CSA practices and biochar. Drought shocks deplete household resources, forcing farmers to prioritize immediate survival needs over long-term investments in CSA. This phenomenon can potentially create a negative feedback loop where reduced adoption of CSA technologies weakens the farming system’s ability to withstand future shocks, leading to further declines in productivity and income. Over time, this cycle may entrench smallholder farmers in poverty traps as they struggle to escape a pattern of reactive coping strategies that undermine resilience. Breaking this cycle necessitates timely interventions such as drought relief, productive social safety nets, and financial instruments like drought insurance with minimal basis risk, which can stabilize farming systems and sustain CSA adoption during and after shocks.
The results on land tenure suggest that uncertainty over continued access to land may constrain farmers’ willingness to allocate land and labor to longer-horizon CSA practices, especially biochar and minimum tillage combinations, whose benefits for soil fertility, moisture retention, and productivity are expected to accrue over time. In Uganda’s context, where customary land tenure systems still dominate and are perceived as less secure than other forms of tenure (e.g., private), tenure reforms that improve de facto tenure security – such as clearer documentation and accessible dispute-resolution mechanisms – are likely to reduce perceived exposure to land-related risks.
Overall, the results point to potential multiple structural and behavioral factors shaping farmers’ investment decisions under uncertainty. Because smallholders face several concurrent risks (including climatic variability and land-tenure–related uncertainty), effective enabling conditions are likely to be multifaceted. Consistent with our findings, relevant areas could include (i) measures that enhance (de facto) tenure security, (ii) interventions that ease liquidity constraints or provide support during adverse shocks, and (iii) information and extension services that frame CSA practices within a broader risk-management context. Policies that bundle tenure reforms with complementary financial tools (e.g., affordable credit, productive safety nets) and targeted information/extension may help address both structural and behavioral barriers and support CSA adoption at scale.
Despite conducting several robustness checks that increase confidence in the observed associations between CSA adoption, lagged drought exposure, land tenure characteristics, and individual risk preferences, the study is not without limitations. The context-specific nature of the data restricts the extent to which the results can be generalized beyond the study areas. Reliance on farmer self-reports introduces potential measurement error, which may bias coefficient estimates. In addition, because risk preferences are elicited at endline, it is possible that they partially reflect farmers’ prior experiences with CSA adoption, introducing a potential source of endogeneity through reverse causality. The estimated associations between risk preferences and CSA adoption should, therefore, not be interpreted as evidence that risk preferences determined adoption decisions. A further limitation concerns the interpretation of tenure categories. Tenure type is strongly correlated with district in the study sample: customary tenure is concentrated in Alebtong, while Mailo and private tenure are concentrated in Mubende. Although the models include district controls, the limited overlap in tenure categories across districts restricts our ability to separate tenure-related associations from other district-level factors, including agroecology, market access, intervention implementation, and institutional history. Consequently, the results should be interpreted as indicative correlations. Nonetheless, the findings underscore the interplay between structural and behavioral factors in shaping CSA adoption, particularly in relation to CA and biochar.
Future work employing larger, repeated, nationally representative, and more geographically diverse samples would be needed to assess whether similar patterns hold under different agroecological, market, climate-risk, and tenure conditions. For example, studies should assess whether bundled reforms (e.g., tenure security, extension, and affordable finance) are associated with sustained CSA adoption under varying climate stresses.
Supplementary material
The supplementary material for this article can be found at https://doi.org/10.1017/aae.2026.10057.
Acknowledgements
During preparation of this manuscript, the authors used Grammarly and built-in AI language tools to assist with language editing and consistency checks. All content was subsequently reviewed and edited as necessary by the authors, who take full responsibility for the accuracy and integrity of the manuscript.
Author contribution
Conceptualization, C.M, G.C, J.M, V.M, Ø.N.H; Methodology, C.M, G.C, J.M, V.M; Formal Analysis, C.M.; Data Curation, C.M; Writing – Original Draft, C.M, Writing – Review and Editing, C.M, G.C, J.M, V.M, Ø.N.H; Supervision, G.C, J.M, V.M, Ø.N.H; Funding Acquisition, G.C, J.M, V.M, Ø.N.H.
Financial support
Norwegian Research Council (NRC)-funded project, “Climate Smart Innovations in Agriculture in Uganda: Improved Food Security, Livelihoods, and Soil Carbon” (#302713). Additional support was also obtained from the “Climate Smart Agriculture in Sub-Saharan Africa” program (NORHED II NMBU, 2021-2026, QZA-21/0182) under the Norwegian Programme for Capacity Development in Higher Education and Research for Development (NORHED II), funded by the Norwegian Agency for Development Cooperation (NORAD).
Data availability statement
The findings from this study are supported by data, available at https://doi.org/10.18710/FE2PWG, DataverseNO, V1.
Competing interests
The authors declare no conflict of interest.



 Open access

