INTRODUCTION
Chagas disease (American trypanosomiasis), caused by the protozoan Trypanosoma cruzi (Kinestoplastida, Trypanosomatidae), is one of the most significant health problems in Latin America both for its high morbidity/mortality rate and for its difficult control because of the natural transmission through haematophagous triatomine insects (Organización Mundial de la Salud, 2010). As a consequence of migration waves in recent decades, the infection has considerably expanded from rural endemic areas to urban centres. The incorporation into cities of infected individuals – most asymptomatic and unaware of their infected condition – increases the risk of congenital or transfusion transmission. The so-called urban Chagas, involving only the human population, is an emerging problem in Latin American cities and in more than a dozen non-endemic countries in the developed world (Organización Mundial de la Salud, 2010; Kirchhoff, Reference Kirchhoff2011; Perez-Molina et al. Reference Perez-Molina, Perez-Ayala, Parola, Jackson, Odolini and Lopez-Velez2011).
The natural evolution of the disease has been divided into three stages: acute (which lasts about 2 months), chronic indeterminate (which has variable duration) and chronic with determinate pathology (which, depending on the severity of the disease, can last from several days to several years) (Dias, Reference Dias1995; World Health Organization, 2002; Storino, Reference Storino and Storino2010a ). In the acute stage, parasitaemia is high in the peripheral blood and, therefore, the risk of transmission is higher. The acute phase is recognized in only 5% of all individuals who acquire the infection, since only a minimal proportion of infected individuals develop symptoms and specific signs that allow making a diagnosis (World Health Organization, 2002; Sosa-Estani, Reference Sosa-Estani and Silveira2007). Most chagasic people ignore their status because they either had no symptoms at the beginning of the disease or experienced benign forms that evolved naturally and spontaneously. Therefore, almost all the infected individuals enter the chronic indeterminate stage. Detection of infection at this stage is limited because: (i) it is characterized by the absence of symptoms, (ii) the level of blood parasitaemia is low, and thus it is diagnosed by serological methods that are not always available, and (iii) Chagas is a disease that many physicians even in endemic countries do not have in mind (Freilij et al. Reference Freilij, Biancardi, Lapeña, Ballering, Moscatelli, Altcheh and Silveira2007). It is estimated that one-third of individuals in the chronic indeterminate stage evolve towards the chronic with determinate pathology stage, a period in which the most obvious manifestations of the disease, such as chronic chagasic myocarditis, megaesophagus and megacolon, chronic encephalitic lesions (with parasitism) or damage to the respiratory system (pulmonary infarction), develop. These manifestations have high morbidity and mortality and usually affect infected individuals in the productive stage of their lives (Kirchhoff, Reference Kirchhoff, Guerrant, Waker and Weller1999; Lazzari, Reference Lazzari and Silveira2007; Storino, Reference Storino and Storino2010b ). It may take more than 20 years from the time of the original infection until these manifestations arise. Besides, they almost always have an evolving nature, becoming worse with age, and causing irreversible damage and even death (World Health Organization, 2002; Carod-Artal et al. Reference Carod-Artal, Vargas, Melo and Horan2003). Although the individuals going through this last stage of the infection have a lower level of parasitaemia, they can transmit the infection.
The antiparasitic drugs available are used mostly at the acute stage and the first years of the chronic indeterminate stage. Evidence about its action at the chronic with pathology stage is still controversial (Perez-Molina et al. Reference Perez-Molina, Perez-Ayala, Moreno, Fernández-Gonzalez, Zamora and López-Velez2009; Jackson et al. Reference Jackson, Alirol, Getaz, Wolff, Combescure and Chappuis2010; Muñoz et al. Reference Muñoz, Murcia and Segovia2011).
Several efforts have been made to model Chagas disease, focusing on the human population. Most of these works considered the infected individuals into, at most, two clinical stages (Busenberg and Vargas, Reference Busenberg and Vargas1991; Velasco-Hernández, Reference Velasco-Hernández1991, Reference Velasco-Hernández1994; Canals and Cattan, Reference Canals and Cattan1992; Das and Mukherjee, Reference Das and Mukherjee2006; Cruz-Pacheco et al. Reference Cruz-Pacheco, Esteva and Vargas2012), whereas Inaba and Sekine (Reference Inaba and Sekine2004) stratified the infected population by the age of the infection. All of these works have focused on rural Chagas and are therefore based on vector-borne transmission. Some of these models (Busenberg and Vargas, Reference Busenberg and Vargas1991; Velasco-Hernández, Reference Velasco-Hernández1991, Reference Velasco-Hernández1994; Inaba and Sekine, Reference Inaba and Sekine2004) also considered transfusion transmission and Busenberg and Vargas (Reference Busenberg and Vargas1991) added congenital transmission. In another work, Martorano Raimundo et al. (Reference Martorano Raimundo, Massad and Yang2010) postulated and analysed a model which was limited to congenital Chagas, because they argued that there was no vector-borne and transfusion transmission in Brazil and thus they only considered women and children.
Here, we present and analyse a deterministic mathematical model with the aim to describe the dynamics of the disease. For this reason we derived: (i) the next-generation matrix, K, deducing expressions which allow estimating the number of new infections generated by an infected individual in a totally susceptible population through each route of transmission at each disease stage; (ii) the basic reproduction number of the infection, R 0, to assess the effect of the introduction of an infected individual in a totally susceptible population; and (iii) explicit formulae from the number of infected humans in an initial urban outbreak. The model and analysis proposed were applied to Buenos Aires city (Argentina), because (i) it is assumed to be free of triatomines, (ii) there is available information about the values of the parameters, and (iii) it presents a constant flow of infected individuals from endemic areas, such as Northern Argentine provinces and neighbouring countries, including Bolivia and Paraguay.
MATERIALS AND METHODS
The model
The population is partitioned into four compartments: susceptible individuals (H S ) and individuals at the acute stage (H A ), the chronic indeterminate stage (H I ), and the chronic with determinate pathology stage (H P ), being H=H S +H A +H I +H P . As usual, the letters for the stages not only indicate the stage, but also the size of the subpopulation at that stage. For brevity, we denoted subpopulation sizes omitting time. Hence, for example, H S (t) is written as H S . We assumed the following:
-
(i) All the rates are per capita per unit time (day), except for migrations, which are crude rates.
-
(ii) We considered immigrations (i) and emigrations (e) of all individuals except for H A , because of the short time period of this stage as compared to the rest, denoted m HSi , mHIi, mHPi, mHSe, mHIe and m HPe .
-
(iii) b HS , bHI and b HP are the birth rates of children from H S , HI and H P mothers, respectively; q H is the probability of congenital transmission and is assumed to be the same for all the stages, being p H the probability that a mother infected with T. cruzi does not transmit the infection to her child by the congenital route (that is, p H = 1−q H ). We considered H A to give births to no children because, again, of the short time of this stage.
-
(iv) The mean number of blood transfusions per unit time from H A , HI and H P individuals are denoted e A , eI and e P , respectively, and the corresponding probabilities of an individual to become infected by blood transfusion are f A , fI and f P . Then, a A = (e A )(f A ), a I = (e I )(f I ) and a P = (e P )(f P ) are the transmission rates by transfusion from H A , HI and H P individuals, respectively. Hence, [a A HA (t)+a I HI (t)+a P HP (t)]H S (t)/H S (t)H(t)/H(t) expresses the input of individuals infected by blood transfusion per unit time.
-
(v) Only H A and H I individuals may become cured, with c A and c I rates, respectively.
-
(vi) r AI and r IP are the transition rates from H A to H I and from H I to H P , respectively.
-
(vii) Finally, we denoted d HS , dHA, dHI and d HP the mortality rates for H S , HA, Hi and H p individuals, respectively.
To express temporal changes in the number of individuals in the different compartments caused by the disease, we formulated our model according to the following system of ordinary differential equations (equation 1).
 $$\eqalign{& \displaystyle{{dH_S (t)} \over {dt}} = (m_{HSi} - m_{HSe} ) + \Bigg[ {b_{HS} - d_{HS}} \cr&\hskip46 { - \displaystyle{{a_A H_A (t) + a_I H_I (t) + a_P H_P (t)} \over {H(t)}}} \Bigg] H_S (t)\cr &\hskip44 + c_A H_A (t) + (b_{HI} p_{H} + c_{I} )H_I (t)\cr &\hskip44 + b_{HP} p_{H} H_{P} (t) \cr & \displaystyle{{dH_A (t)} \over {dt}} = \displaystyle{{a_A H_A (t) + a_I H_I (t) + a_P H_P (t)} \over {H(t)}} H_S (t)\cr &\hskip44 - \left( {c_A + d_{HA} + r_{AI}} \right)H_A (t) + b_{HI} q_{H} H_I (t)\cr &\hskip44 + b_{HP} q_{H} H_P (t) \cr & \displaystyle{{dH_I (t)} \over {dt}} = (m_{HIi} - m_{HIe} ) + r_{AI} H_A (t)\cr &\hskip42 - (c_I + d_{HI} + r_{IP} )H_I (t) \cr & \displaystyle{{dH_P (t)} \over {dt}} = (m_{HPi} - m_{HPe} ) + r_{IP} H_I (t) - d_{HP} H_P (t)} $$
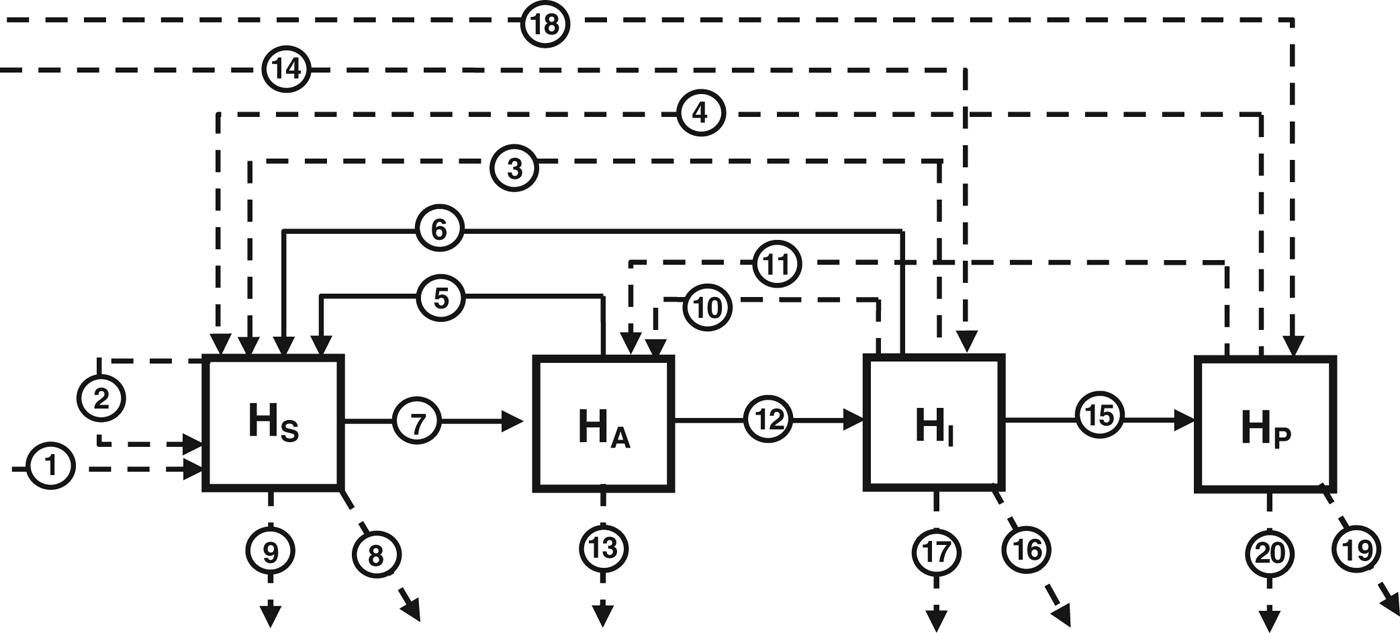
Figure 1 illustrates the model structure.
Diagram of the infection dynamics of the proposed model. Letters for the stages not only indicate the stage, but also the size of the subpopulation in that stage susceptible (H S), individuals transiting the acute stage (H A), the chronic indeterminate stage (H I) and the chronic with determinate pathology stage (H P). Dotted lines indicate birth, death or migration. Solid lines indicate movements of individuals from an epidemiological stage to another. 1: Immigration of susceptible individual; 2: Birth of susceptible individual to a susceptible mother; 3: Birth of susceptible individual to a mother in the chronic indeterminate stage; 4: Birth of susceptible individual to a mother in the chronic with determinate pathology stage; 5: Cure of individual in the acute stage; 6: Cure of individual in the chronic indeterminate stage; 7: Evolution of a susceptible individual to the acute stage by blood transfusion; 8: Emigration of susceptible individual; 9: Mortality of susceptible individual; 10: Birth of infected individual to a mother in the chronic indeterminate stage; 11: Birth of infected individual to a mother in the chronic with determinate pathology stage; 12: Evolution of individual from the acute stage to the chronic indeterminate stage; 13: Mortality of individual in the acute stage; 14: Immigration of individual in the chronic indeterminate stage; 15: Evolution of individual from the chronic indeterminate stage to the chronic with determinate pathology stage; 16: Emigration of individual in the chronic indeterminate stage; 17: Mortality of individual in the chronic indeterminate stage; 18: Immigration of individual in the chronic with determinate pathology stage; 19: Emigration of individual in the chronic with determinate pathology stage; 20: Mortality of individual in the chronic with determinate pathology stage.

Basic reproduction number (R 0 ) and next-generation matrix ( K )
The next-generation matrix (K) method is a mathematical method to analyse systems in which different classes of individuals capable of infecting others interact and in which the infectious agent has various routes of transmission (Diekmann et al. Reference Diekmann, Heesterbeek and Metz1990; Heesterbeek and Dietz, Reference Heesterbeek and Dietz1996; Van den Driessche and Watmough, Reference Van den Driessche and Watmough2002; Heffernan et al. Reference Heffernan, Smith and Wahl2005). The basic reproduction number R 0 can be estimated from K.
It is assumed that the population can be classified into compartments in which individuals are indistinguishable from one another. It is also assumed that the parameters do not depend on the time spent in a compartment. The model is based on a system of ordinary differential equations describing the evolution of the number of individuals in each compartment. It is assumed that m of the n compartments (m>1) consist of infected individuals and that the remaining ones correspond to non-infected individuals. The system of differential equations for the model of transmission of the disease (epidemiological model), which models the exchange rates of x i (where x i ⩾0, the number of individuals in compartment i), can be written as:
 $$\displaystyle{{dx_i} \over {dt}} = f_i ({\bf X}) = F_i ({\bf X}) - Y_i ({\bf X})\quad i = {\rm 1}, \ldots, m$$
 $${\bf f}({\bf X}) = \left( {\matrix{ {f_1 ({\bf X})} \cr. \cr. \cr. \cr {f_m ({\bf X})} \cr}} \right)\quad {\bf X} = \left( {\matrix{ {x_1} \cr. \cr. \cr. \cr {x_m} \cr}} \right)\quad Y_i ({\bf X}) = Y_i^ - - Y_i^ + $$
where: F i (X): rate of occurrence of new infections in compartment i, Y i +: rate of transfer within the i-th compartment to other forms, Y i −: rate of transfer out of the i-th compartment.
Note that F i (X) must include only new infections that are appearing, but must not include terms which describe the transfer of infected individuals from an infected compartment to another. F and Y are matrices m×m valued at the equilibrium point free of infection, E 0:
 $${\bf F} = \left[ {\displaystyle{{\partial F_i ({\bf E}_0 )} \over {\partial x_j}}} \right]\quad {\bf Y} = \left[ {\displaystyle{{\partial Y_i ({\bf E}_0 )} \over {\partial x_j}}} \right]\quad i,j = {\rm 1}, \ldots, m$$
The matrix of the next generation is obtained as a product of F (matrix of new infected individuals) and Y −1 (transfers in and out of a compartment), i.e. K = FY −1. For its interpretation, we considered a disease-free population with an infected individual introduced into compartment k of the population. The interpretation of the (i, j) cell of matrix F, when it corresponds to individuals of the same population, is the rate by which new infections are produced in compartment i by infected individuals in compartment j. The (j, k) cell of Y−1 is the average time during which the infected individual introduced into compartment k remains in compartment j during his lifetime. Thus, the (i, k) cell of K = FY −1 denotes the expected number of new infections in compartment i produced by the infected individual originally introduced into compartment k, during the entire period of infectivity. It is thus established that:
 $$R_0 = \rho ({\bf K})$$
where ρ(K) is the spectral radius (dominant eigenvalue) of matrix K (Diekmann et al. Reference Diekmann, Heesterbeek and Metz1990; Heesterbeek and Dietz, Reference Heesterbeek and Dietz1996; Van den Driessche and Watmough, Reference Van den Driessche and Watmough2002; Heffernan et al. Reference Heffernan, Smith and Wahl2005).
In the model of Chagas transmission proposed here, there are four compartments, three of which (H A , HI and H P ) are of infected individuals. In this model, K has the following form
 $${\bf K} = \left[ {\matrix{ {N_{HA \to HA}} & {N_{HI \to HA}} & {N_{HP \to HA}} \cr {N_{HA \to HI}} & {N_{HI \to HI}} & {N_{HP \to HI}} \cr {N_{HA \to HP}} & {N_{HI \to HP}} & {N_{HP \to HP}} \cr}} \right]$$
where N j →i represents the expected number of individuals belonging to stage i infected by one individual belonging to stage j entering in a totally susceptible population, during its entire period of infectiousness.
We define – see equation (equation 1):
 $$\eqalign{F_1 = & \displaystyle{{a_A H_A + a_I H_I + a_P H_P} \over H}H_S + b_{HI} q_{H} H_I \cr & + b_{HP} q_{H} \quad F_2 = 0\quad F_3 = 0} $$
 $$\eqalign{ & Y_1 = (c_A + d_{HA} + r_{AI} )H_A \cr & Y_2 = - r_{AI} H_A + (c_I + d_{HI} + r_{IP} ) H_I \cr & Y_3 = - r_{IP} H_I + d_{HP} H_P} $$
So
 $$\eqalign{{\bf F} = \left[ {\matrix{ {a_A} & {a_I + b_{HI} q_{H}} & {a_P + b_{HP} q_{H}} \cr 0 & 0 & 0 \cr 0 & 0 & 0 \cr}} \right],\quad {\bf Y} = \left( {\matrix{ {c_A + d_{HA} + r_{AI}} & 0 & 0 \cr { - r_{AI}} & {c_I + d_{HI} + r_{IP}} & 0 \cr 0 & { - r_{IP}} & {d_{HP}} \cr \Rightarrow {\bf Y}^{ - 1} = \left[ {\matrix{ {\displaystyle{1 \over {c_A + d_{HA} + r_{AI}}}} & 0 & 0 \cr {\displaystyle{{r_{AI}} \over {(c_A + d_{HA} + r_{AI} )(c_I + d_{HI} + r_{IP} )}}} & {\displaystyle{1 \over {c_I + d_{HI} + r_{IP}}}} & 0 \cr {\displaystyle{{r_{AI} r_{IP}} \over {(c_A + d_{HA} + r_{AI} )(c_I + d_{HI} + r_{IP} )d_{HP}}}} & {\displaystyle{{r_{IP}} \over {(c_I + d_{HI} + r_{IP} )d_{HP}}}} & {\displaystyle{1 \over {d_{HP}}}} \cr}} \right]}$$
Note that since the entries of matrices F and Y are constant values, due to the formulation of our model, it is not necessary to find an equilibrium point free of infection.
Now, we obtain the K = FY −1 operator as
 $${\bf K =} \left( {\matrix{ {k_{11}} & {k_{12}} & {k_{13}} \cr 0 & 0 & 0 \cr 0 & 0 & 0 \cr}} \right)$$
where
 $$\eqalign{k_{11} = & \displaystyle{{a_A} \over {(c_A + d_{HA} + r_{AI} )}}\cr & + \displaystyle{{(a_I + b_{HI} q_{H} )r_{AI}} \over {(c_A + d_{HA} + r_{AI} )(c_I + d_{HI} + r_{IP} )}} \cr & + \displaystyle{{(a_P + b_{HP} q_{H} )r_{AI} r_{IP}} \over {(c_A + d_{HA} + r_{AI} )(c_I + d_{HI} + r_{IP} )d_{HP}}}} $$
 $$k_{12} = \displaystyle{{a_I + b_{HI} q_{H}} \over {(c_I + d_{HI} + r_{IP} )}} + \displaystyle{{(a_P + b_{HP} q_{H} )r_{IP}} \over {(c_I + d_{HI} + r_{IP} )d_{HP}}} $$
 $$k_{13} = \displaystyle{{a_P + b_{HP} q_{H}} \over {d_{HP}}} $$
These K entries represent the following expected numbers: k 11: Expected number of individuals that one typical H A infects through its infectious lifetime in a totally susceptible population. The first term stands for the number of new infected individuals generated by a typical H A (only by blood transfusion, according to model assumptions), 1/(c A +r AI +d HA ) being the mean sojourn time at this stage. The second term stands for the number of new infected individuals horizontally and vertically generated by an individual initially at the acute stage during the time he/she spends at the chronic indeterminate stage. More specifically, r AI /(c A +r AI +d HA ) stands for the fraction of H A that evolve to the chronic indeterminate stage, and 1/(c I +r IP +d HI ) is the mean lapse during which the individual stays at that stage. Similarly, the third term is the product of three factors: the infectivity per unit time of an H P denoted (a P +b HP qH ), the fraction of the initially infected individuals surviving until that stage given by r AI rIP /[(c A +r AI +d HA )(c I +r IP +d HI )], and the average infectivity period of an individual at that stage, 1/d HP .
Similarly, k 12 denotes: the expected number of individuals that one individual at the chronic indeterminate stage of the disease infects through its infectious lifetime, in a totally susceptible population, and k 13 is the expected number of individuals that one individual at the chronic with pathology stage infects through its infectious lifetime, in a totally susceptible population.
R 0 can be derived from K. In this model, R 0 coincides with k 11
 $$R_0 = \displaystyle{\eqalign{& a_A d_{HP} (c_I + d_{HI} + r_{IP} ) + (a_I + b_{HI} q_{H} )r_{AI} d_{HP} \cr &\hskip40 + (a_P + b_{HP} q_{H} )r_{AI} r_{IP}} \over {(c_A + d_{HA} + r_{AI} )(c_I + d_{HI} + r_{IP} )d_{HP}}} $$
Initial disease outbreak
We analysed the initial dispersion of the infection in urban centres or areas without triatomines. Initially, the population is practically constant and almost all individuals are susceptible, allowing the approximation H S/H = 1. There is not enough time to reach the chronic with determinate pathology stage.
In this way, the system which governs the initial dispersion of the infection is reduced to
 $$\eqalign{\displaystyle{{dH_S (t)} \over {dt}} =\hskip2pt & (m_{HSi} - m_{HSe} ) + (b_{HS} - d_{HS} )H_S (t) \cr &+ (c_A - a_A )H_A (t) + (b_{HI} p_{H} + c_I - a_I )H_I (t) \cr \displaystyle{{dH_A (t)} \over {dt}} =\hskip2pt & \left( {a_A - c_A - d_{HA} - r_{AI}} \right)H_A (t)\cr & + (b_{HI} q_{H} + a_I )H_I (t) \cr \displaystyle{{dH_I (t)} \over {dt}} =\hskip2pt & (m_{HIi} - m_{HIe} ) + r_{AI} H_A (t) - (c_I + d_{HI} )H_I (t).} $$
To find the solution, we write this system as:
 $$\eqalign{\displaystyle{{dH_S (t)} \over {dt}} =\hskip2pt & A + B{\kern 1pt} H_S (t) + C \cdot H_A (t) + L \cdot H_I (t) \cr \displaystyle{{dH_A (t)} \over {dt}} =\hskip2pt & E \cdot H_A (t) + F \cdot H_I (t) \cr \displaystyle{{dH_I (t)} \over {dt}} =\hskip2pt & G + J \cdot H_A (t) + K \cdot H_I (t)} $$
where
 $$\eqalign{ & A = m_{HSi} - m_{HSe}, \quad B = b_{HS} - d_{HS}, \quad C = c_A - a_A, \cr &\quad L = b_{HI} p_{H} + c_I - a_I, \quad E = a_A - c_A - d_{HA} - r_{AI}, \cr &\quad F = b_{HI} q_{H} + a_I, \quad G = m_{HIi} - m_{HIe}, \quad J = r_{AI} \cr &\quad {\rm and}\quad K = - c_I - d_{HI}} $$
Using the formulae
 $$\eqalign{\omega = & \displaystyle{1 \over {2\sqrt {(E - K)^2 + 4FJ} \;(KE - FJ)}}, \cr \alpha = & \displaystyle{1 \over 2}\left( {E + K + \sqrt {(E - K)^2 + 4FJ}} \right)} $$
 $$\eqalign{\beta = \displaystyle{1 \over 2}\left( {E + K - \sqrt {(E - K)^2 + 4FJ}} \right), \cr \quad \gamma = (E - K)(KE - FJ)H_A (0) \cr + 2F(KE - FJ)H_I (0) + FG(E + K)} $$
 $$\delta = (EK - FJH_A (0) - FG)\sqrt {(E - K)^2 + 4FJ}, \quad \phi = \displaystyle{{FG} \over {KE - FJ}}\quad \eta = \displaystyle{1 \over F}$$
 $$\theta = 1 - E\quad {\rm and}\quad \tau = \displaystyle{{EFG} \over {KE - FJ}}$$
we obtain the expressions for the numbers of acute and chronic indeterminate individuals in the initial outbreak,
 $$H_A (t) = \omega \left[ {e^{\alpha \,t} (\gamma + \delta ) - e^{\beta \,t} (\gamma - \delta )} \right] + \phi $$
 $$H_I (t) = \eta \left\{ {\omega \theta \left[ {\alpha \,e^{\alpha \,t} (\gamma + \delta ) - \beta \,e^{\beta \,t} (\gamma - \delta )} \right] - \tau} \right\}$$
The expressions (equations 4 and 5) can be used in non-endemic areas in which there is an initial dispersion of the infection, with the aim to estimate the number of infected individuals in the early years of the outbreak.
RESULTS
Parameter estimations for Buenos Aires city
We assumed that Buenos Aires city is inhabited by 3 million inhabitants (Ministerio de Salud de la Nación, 2009), 111 000 (3·7%) of whom are infected with T. cruzi. The latter is the average between prevalence in blood donors in the city (2·94%) (Centro Nacional Red de Laboratorios, 2007), and prevalence in pregnant women (4·4%) (Ministerio de Salud de la Nación, 2006). It is further assumed that, initially, 90% of the infected individuals are in the indeterminate chronic stage and that the remaining 10% are in the chronic with determinate pathology. The unit time considered for the estimations of the parameters was one day.
Migrations
According to census data, there were 253 677 immigrants and 254 522 emigrants in Buenos Aires city in a lapse of 5 years (Censo Nacional de Población, Hogares y Viviendas, 2001). The prevalence rate in Argentina is estimated at 4·1%, whereas that in Bolivia and Paraguay, which provide an important flow of immigrants to the city, has been estimated at 6·8 and 2·5%, respectively (Organización Mundial de la Salud, 2006). In this application, we assumed that 5% of immigrants are infected with T. cruzi. Therefore, m HSi = 132·051041, m HIi = 6·255049, m HPi = 0·695005, m HSe = 134·303938, m HIe = 4·644155 and m HPe = 0·516017.
Birth rates and congenital transmission
According to official data, the daily birth rate per capita in Buenos Aires is 0·000041 (Ministerio de Salud de la Nación, 2009). Congenital transmission varies between 2·5 and 11% (de Rissio et al. Reference de Rissio, Scollo and Cardoni2009; Freilij et al. Reference Freilij, Biancardi, Lapeña, Ballering, Moscatelli, Altcheh and Storino2010). For this work, the congenital transmission rate was estimated at an intermediate value of q H = 0·06; therefore, p H = 0·94. It is expected that women with Chagas disease have a lower fertility rate than non-infected ones. This assumption is based on the fact that nests of amastigotes, probably responsible for a significant number of abortions, have been found in chagasic placentas of women (Bittencourt, Reference Bittencourt1976). In countries like Argentina, Brazil and Chile, the mortality caused by congenital infection is low (less than 2%) (Moya et al. Reference Moya, Basso and Moretti2005), whereas that in Bolivia varies between 2–12% (Carlier and Torrico, Reference Carlier and Torrico2003). Here we considered the birth rate of infected women to be about 98% of the birth rate of susceptible women. We also considered that in the last stage of the disease, the birth rate is half of the corresponding rate in the chronic indeterminate stage. Therefore, b HS = 0·000041, b HI = 0·000040, b HP = 0·000020, q H = 0·06 and p H = 0·94.
Transmission by blood transfusion
According to official data, around 85 000 people donate blood annually in the city (http://www.agn.gov.ar/informes/informesPDF2013/2013_041.pdf). In a population of 3 million people, the average number of transfusions per year per capita is estimated at 0·028, that is 0·000077 transfusions per day per capita. In this way, and considering that 10% of chagasic donors are in the chronic with determinate pathology stage, e A = 0·000013, e I = 0·000077 and e P = 0·000008. The estimated risk of transmission per unit of blood contaminated with T. cruzi varies from 12 to 25% (Schmunis, Reference Schmunis1999; World Health Organization, 2002; Moncayo and Ortiz, Reference Moncayo and Ortiz2006). Because there is more peripheral blood parasitaemia in the acute stage, it is assigned the highest percentage. Thus, a A = (0·000013)(0·25) = 0·000003, a I = 0·000077)(0·12) = 0·000009 and a P = (0·000008)(0·12) = 0·000001.
Cure rates
The acute stage is only recognized in about 5% of all individuals who acquired the infection (World Health Organization, 2002; Sosa-Estani, Reference Sosa-Estani and Silveira2007). At this stage, any treatment with available drugs has an effectiveness of over 70% and almost 100% when treating newborns infected by their mother (Médicos sin Frontera, 2005; Freilij et al. Reference Freilij, Biancardi, Lapeña, Ballering, Moscatelli, Altcheh and Storino2010). In this work, we considered that 5% of acute patients are recognized and that they reach 80% of cure. About 63% of efficacy has been verified in 3–4 years in children at the beginning of the chronic indeterminate stage under treatment (Andrade et al. Reference Andrade, Zickei, de Oliviera, Almeida y Silva, Luquetti, Travassos, Almeida, Andrade, Andrade and Martelli1996; Sosa-Estani et al. Reference Sosa-Estani, Segura, Ruiz, Velazquez, Porcel and Yampotis1998). About 37% of chronic indeterminate individuals have been found to be negative for T. cruzi antibodies over 16 years (Fabbro, Reference Fabbro2007). Therefore, it is considered that the possibility of cure at this stage is 13% per year on average. Given the difficulties in the detection of the infection at this stage and that the possibility of cure decreases with age, only 5% of detection of chagasic individuals is proposed. The latter is based on the fact that in Argentina only 5–10% of newborns are diagnosed as chagasic, this being the age group in which it is easiest to detect (Gürtler et al. Reference Gürtler, Segura and Cohen2003; de Rissio et al. Reference de Rissio, Scollo and Cardoni2009). Therefore, c A = 0·000667 and c I = 0·000018.
Transitions among disease stages
It is estimated that about 95% of acute cases are unrecognized and undiagnosed (Sosa-Estani, Reference Sosa-Estani and Silveira2007; Storino, Reference Storino and Storino2010a ) and that 2–5% of the chronic indeterminate individuals evolve to the chronic with determinate pathology stage annually (Storino, Reference Storino and Storino2010b ). So, considering the mean value, we have r AI = 0·015833 and r IP = 0·000096.
Mortality rates
According to official data (Ministerio de Salud de la Nación, 2009), there were 32 074 deaths in the city in 2008, the total population being 3 042 581 people. According to the same source, 391 deaths by Chagas were reported in the country in the same year. This number is so low that it does not influence the result of the death rate of susceptible individuals. It is estimated that mortality in the acute stage ranges from 2 to 3% (World Health Organization, 2002; Albajar-Viñas et al. Reference Albajar-Viñas, Villa, Morote, Bernal, Bulla, Rodrigues Coura and Silveira2007). The indeterminate chronic stage has low mortality rates similar to those of the susceptible population (Storino et al. Reference Storino, Jörg and Auger2003; Lazzari, Reference Lazzari and Silveira2007). In the chronic with determinate pathology stage, the risk of death among chagasic individuals increases with age when the clear manifestations of Chagas disease appear, in which case it is about 10% annually (Manzullo and Dairraidou, Reference Manzullo and Dairraidou1991), to which we must add the mortality from other causes. Thus, d HS = 0·000029, d HA = 0·000446, d HI = 0·000029 and d HP = 0·00303.
Estimations of the K entries and R0 for Buenos Aires city
According to the estimation of parameters, we have
 $${\rm K} = \left( {\matrix{ {0 \cdot 079215} & {0 \cdot 084594} & {0 \cdot 007261} \cr 0 & 0 & 0 \cr 0 & 0 & 0 \cr}} \right)$$
Below, we explain the numerical value of each non-zero element of this matrix.
 $$\eqalign{k_{11} = & \displaystyle{{a_A} \over {c_A + d_{HA} + r_{AI}}} + \displaystyle{{(a_I + b_{HI} q_{H} )r_{AI}} \over {\left( {c_A + d_{HA} + r_{AI}} \right)\left( {c_I + d_{HI} + r_{IP}} \right)}} \cr & + \displaystyle{{(a_P + b_{HP} q_{H} )r_{AI} r_{IP}} \over {\left( {c_A + d_{HA} + r_{AI}} \right)\left( {c_I + d_{HI} + r_{IP}} \right)d_{HP}}} \cr = & 0 \cdot 000177 + 0 \cdot 074484 + 0 \cdot 004554 = 0 \cdot 079215} $$
The expected number of new infected individuals generated by an individual at the acute stage (according to the assumptions of the model, only by blood contaminated with T. cruzi) introduced into a totally susceptible population is equal to 0·000177; the expected number of new infected individuals generated, either by transfusion or by the congenital route, by an individual initially at the acute stage during the time he/she is in the chronic indeterminate stage is 0·074484. Finally, the expected number of new acute individuals generated, either by transfusion or by the congenital route, by an individual who survived the acute and chronic indeterminate stages and is at the chronic with determinate pathology stage during the time he/she remains at this stage is 0·004554. Therefore, if an acute individual enters a population of susceptible individuals he/she generates an average of 0·079215 infected individuals during all his/her infectivity time.
 $$\eqalign{k_{12} = & \displaystyle{{a_I + b_{HI} q_{H}} \over {c_I + d_{HI} + r_{IP}}} + \displaystyle{{(a_P + b_{HP} q_{H} )r_{IP}} \over {\left( {c_I + d_{HI} + r_{IP}} \right)d_{HP}}} \cr = & 0 \cdot 079720 + 0 \cdot 004874 = 0 \cdot 084594} $$
If an individual at the chronic indeterminate stage is introduced into a totally susceptible population, he/she will generate an average of 0·07972 acute individuals, either by transfusion or by the congenital route; whereas during the chronic with determinate pathology, he/she will generate an expected number of 0·004874 infected individuals. Therefore, if an individual at the chronic indeterminate stage is introduced in a totally susceptible population, then it is expected that he/she will generate 0·084594 new cases over his/her entire period of infectivity.
 $$a_{13} = \displaystyle{{a_P + b_{HP} q_{H}} \over {d_{HP}}} = 0 \cdot 007261$$
An individual who enters a totally susceptible population when he/she is at the chronic with determinate pathology stage will generate an average of 0·007261 acute individuals.
The value of the basic reproduction number is given by the expression k 11, so
 $$R_0 = 0 \cdot 079$$
Since R 0 is <<1, if the net flow of migration of infected individuals is considered null, the infection will tend to disappear from the population.
Sensitivity of R0 to variations in the parameters of K
The sensitivity matrix of K (Caswell, Reference Caswell2001) is
 $${\bf S} = \left( {\matrix{ 1 & 0 & 0 \cr {1 \cdot 067904} & 0 & 0 \cr {0 \cdot 091658} & 0 & 0 \cr}} \right)$$
The value 1 in the sensitivity of the cell (1·1) is due to the fact that R 0 coincides exactly with the value of that cell in K. Sensitivities are also observed representing hypothetical changes in R 0 that might result if certain elements of K could change, even when those changes are not really possible in a single generation. The corresponding matrix of elasticities of R 0 (De Kroon et al. Reference De Kroon, Plaisier, Van Gronendael and Caswell1986; Caswell, Reference Caswell2001; Hartemink et al. Reference Hartemink, Randolph, Davis and Heesterbeek2008) is
 $${\bf E} = \left[ {\matrix{ 1 & 0 & 0 \cr 0 & 0 & 0 \cr 0 & 0 & 0 \cr}} \right]$$
The latter matrix reflects the fact that proportional changes in R
0 are entirely attributable to proportional changes in the cell (1·1) in K, which coincides with the value R
0. All other elements of E are zero because of the corresponding zero sensitivities (elements of the second and third column) or because of the null cells in K (recall that
 $E_{a_{ij}} = {{(k_{ij}} / {R_0}} )s_{ij} $
).
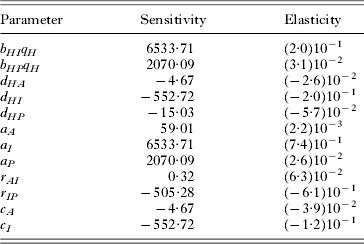
Table 1 shows the sensitivities and elasticities of R 0 to changes in the parameters involved in its expression. The magnitude of R 0 shows high sensitivity to parameters related to transmission from individuals at the chronic indeterminate stage. The main changes in R 0 result from proportional changes in parameters corresponding to transmission by transfusion of T. cruzi from individuals at the chronic indeterminate stage, such that it changes 50% of its estimated value, i.e. it takes a value between 0·050 and 0·10. It should be noted that if the parameters related to mortality of individuals increase at any stage of infection, the cure of individuals at the acute and chronic indeterminate stages and the evolution from the chronic indeterminate to the chronic with determinate pathology (showing the importance of the chronic indeterminate stage) will result in decreases in R 0 and vice versa.
Sensitivities and elasticities of R 0 to changes in the parameters

Numerical solution of the mathematical model
Unable to find explicit solutions of the system of differential equations (1) that mathematically express the dynamics of the disease according to the model proposed, we ran a numerical solution, using the Runge-Kutta-Fehlberg 4th–5th order method (Forsythe et al. Reference Forsythe, Malcolm and Moler1977).
The time unit used in the resolution is one day and the time horizon is 100 years. We consider that the city has 3 million inhabitants, 111 000 (3·7%) of whom are chagasic. It is further assumed that initially, 90% (99 900 individuals) of the individuals infected with T. cruzi are at the chronic indeterminate stage and that the remaining 10% (11 100 individuals) are at the chronic stage with determinate pathology.
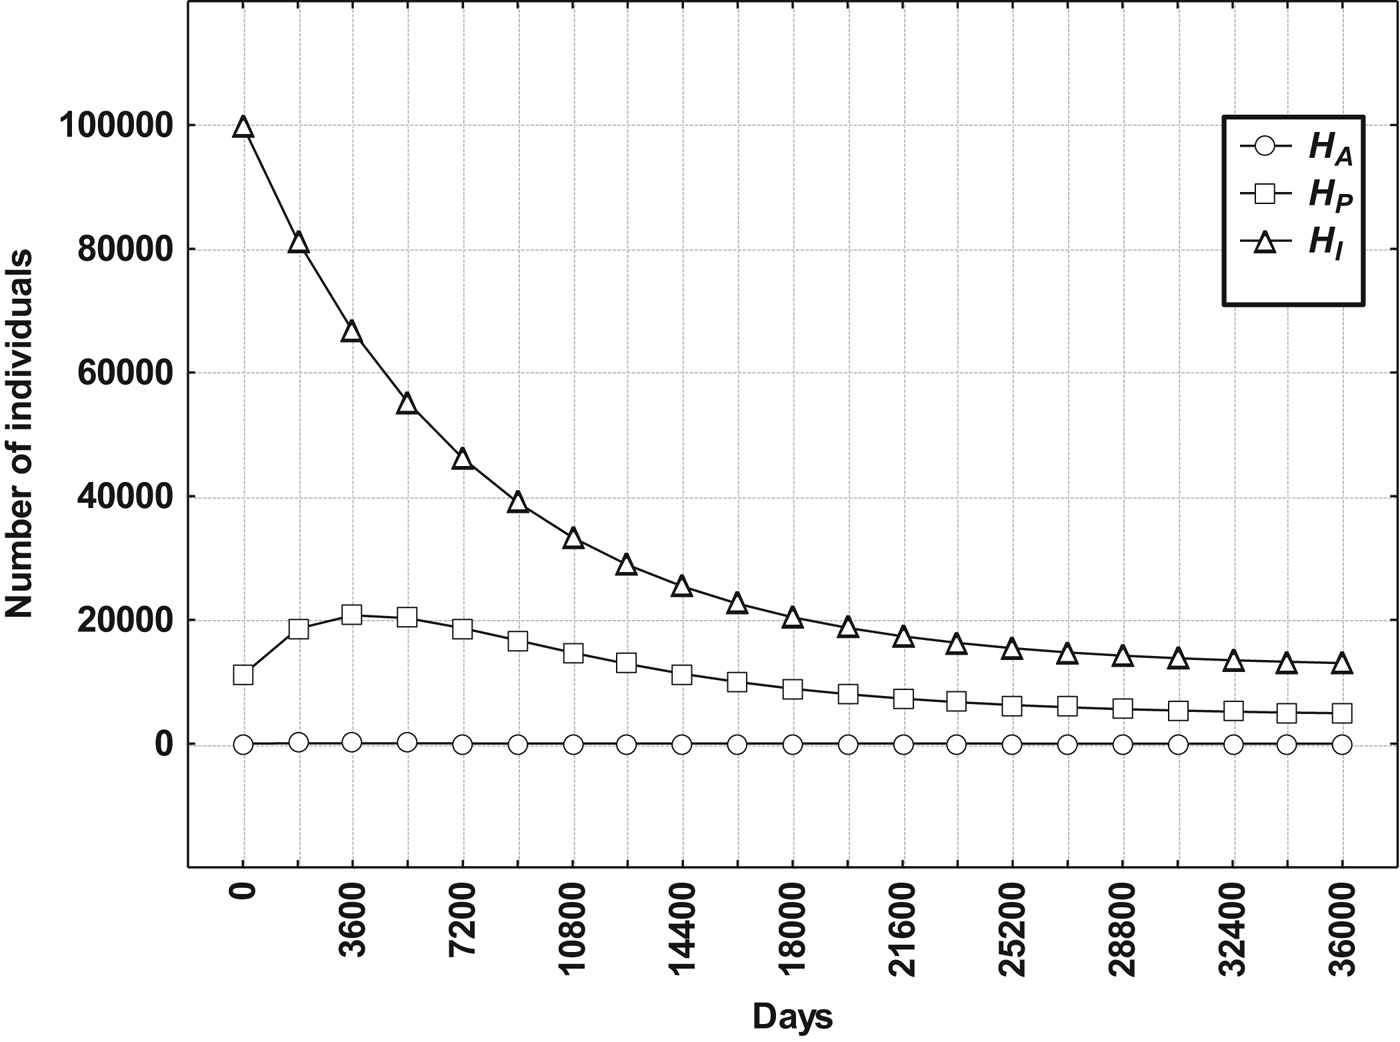
Figure 2 displays the dynamics of infected individuals according to the model proposed.
Dynamics of infected individuals predicted by the model in Buenos Aires city. Letters indicate the size of the subpopulation of individuals at the acute stage (H A), individuals at the chronic indeterminate stage (H I) and individuals at the chronic with determinate pathology stage (H P).

The population of Buenos Aires tends to an endemic equilibrium point in which the number of infected individuals is set to the approximate values: H * A = 9, H * I = 12 241 and H * P = 4469, although the number of susceptible individuals grows. These quantities are obtained from the numerical solution of the system considering longer times. Also, these values satisfy the equations of system (1) in an endemic equilibrium point.
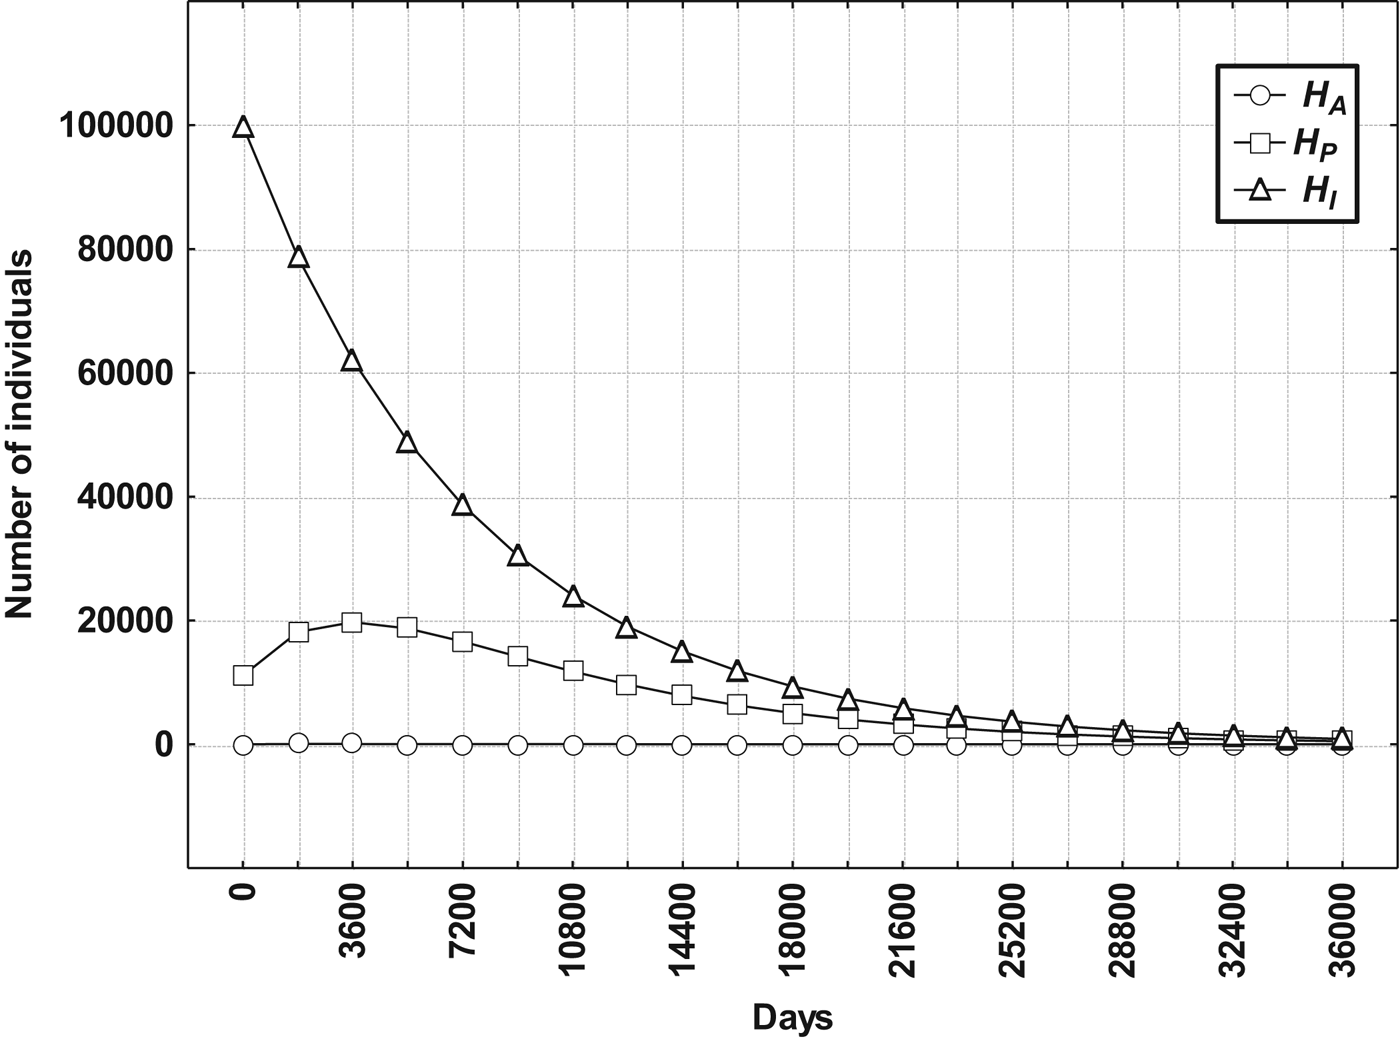
For comparison, Fig. 3 shows the dynamics of the disease in infected individuals in Buenos Aires, under the assumption that the flow of migration of infected individuals is zero. In this situation, we found that the number of individuals infected with T. cruzi decreases more rapidly. Moreover, we estimated that 244 years from the start, the numbers at any stage of infection are lower than 1, which is coincident with the value R 0 = 0·079: if migration of infected individuals is not considered, the infection slowly disappears from the population.
Dynamics of infected individuals in Buenos Aires city according to the model proposed if the flow of migration of infected individuals is zero. Letters indicate the size of the subpopulation of individuals at the acute stage (H A), individuals at the chronic indeterminate stage (H I), and individuals at the chronic with determinate pathology stage (H P).

Therefore, assuming that the other parameters are at the same values, the endemic level is produced by migration of infected individuals, with the number of infected immigrants exceeding the number of infected emigrants.
DISCUSSION
Using a mathematical model that takes into account the three clinical stages of the disease, here we evaluated some of the most important aspects of the dynamics of Chagas disease in a scenario without the presence of triatomines. Due to recent trends in migration, there are millions of people from Chagas endemic areas now living in places without the presence of triatomines, including thousands of people with T. cruzi infection. The lack of control in blood banks and pregnant women has caused the spread of the disease in American, European, Australian and Japanese cities (Gascon et al. Reference Gascon, Bern and Pinazo2010; Organización Mundial de la Salud, 2010; Kirchhoff, Reference Kirchhoff2011). The problem is under-diagnosis. More epidemiological data are thus necessary to estimate the magnitude of a problem of great relevance for public health and health resource planning (Yadon and Schmunis, Reference Yadon and Schmunis2009; Perez-Ayala et al. Reference Perez-Ayala, Perez-Molina, Norman, Navarro, Monge-Mallo, Flores, Cañavate and Lopez-Velez2011; World Health Organization, 2011). The number of infected individuals is estimated between 300 000 and 1 000 000 in the USA, at least 5500 in Canada, between 1000 and 3000 in Australia, and 3000 in Japan (World Health Organization, 2009; Yadon and Schmunis, Reference Yadon and Schmunis2009; Rodriguez Coura and Albajar-Viñas, Reference Rodriguez Coura and Albajar Viñas2010; Schmunis and Yadon, Reference Schmunis and Yadon2010; Barry et al. Reference Barry, Weatherhead, Hotez and Woc-Colburn2013). Regarding Europe, the World Health Organization has recently reported that the current number of infected people exceeds 80 000 (World Health Organization, 2009).
To better understand the behaviour of the dynamics of the disease, we used the next-generation matrix method, which allows estimating R 0. It is not a surprise that the value of R 0 coincides with that of the element k 11 of K, which denotes the expected number of new infections generated by an infected individual initially at the acute stage, when introduced into a totally susceptible population, throughout his/her period of infectivity. This is because each of the three terms in k 11 indicates the number of new infections generated by this individual at different stages of the disease. Considering the expression of R 0 (equation 3), the disease can be sustained by the vertical and horizontal transmission in humans, even in the absence of the vector (Fig. 2) during a long period.
In Brazil, a country free of vector-borne transmission, it was estimated that there were 1 800 000 infected individuals in 2007, with a near-zero incidence (sporadic cases under 100 per year). This population, which has become contaminated via the vectorial route, can still become infected through the transfusion or congenital routes. It has been estimated that an infected continent that can transmit the infection will exist until 2050 (Luquetti, Reference Luquetti and Silveira2007; Massad, Reference Massad2008).
It is important to show that in the model that defines the dynamics of the disease (equation 1), the migration parameters are expressed as independent quantities, while in the rest of the processes the parameters multiply the variables studied (i.e. the numbers in the different compartments). Therefore, the parameters that correspond to migrations are not involved in the derivates determining the components of K. This is reflected in the formula of R 0 involving no parameter related to migration.
The model was applied to Buenos Aires city, which is supposed to be free of triatomines but with an important migration of individuals from endemic areas, such as Northern Argentine provinces and neighbouring countries as Bolivia and Paraguay.
A part of the investigation of a natural system is related to the estimated values of its parameters. In the development of this work, we explained in detail how we obtained the value of each of the parameters selected to analyse the model. In this effort, we integrated the most relevant information produced in the study area in recent years, as well as the latest official data available.
We showed the importance of the chronic indeterminate stage with respect to the other two stages. Thus, it is expected that if an individual at the acute stage is introduced into a totally susceptible population, 94% (0·074484/0·079215 in the element k 11 of the K) of the new infections will be generated while he/she is at the chronic indeterminate stage. Similarly, if a chronic indeterminate individual is introduced into a totally susceptible population 94% (0·079720/0·084594 in k 12) of new infections will be generated when he/she is at that stage.
There are at least two reasons why an acutely infected individual entering a population causes a lower number of secondary cases than an individual in the chronic indeterminate stage: (i) there is a decrease in the number of infective individuals due to mortality. It is estimated that there is 2–3% mortality during this period (World Health Organization, 2002; Albajar-Viñas et al. Reference Albajar-Viñas, Villa, Morote, Bernal, Bulla, Rodrigues Coura and Silveira2007); and (ii) there is a decrease in the number of infective individuals due to treatment with drugs. The only existing treatment with antiparasitic drugs is effective in the acute phase and in the early days of the chronic indeterminate stage (Freilij et al. Reference Freilij, Biancardi, Lapeña, Ballering, Moscatelli, Altcheh and Storino2010; Pinazo et al. Reference Pinazo, Guerrero, Posada, Rodriguez, Soy and Gascon2012). Instead, the chronic indeterminate stage has low mortality rates comparable to those of the general population (World Health Organization, 2002; Storino et al. Reference Storino, Jörg and Auger2003; Lazzari, Reference Lazzari and Silveira2007).
We estimated R 0 = 0·079. It should be remembered that this value is obtained from K and that the calculation does not involve the migration parameters. As R 0 turns out to be much lower than 1, we conclude that the infection will tend to disappear slowly and gradually from the population without considering the flow of migration of infected individuals.
The largest sensitivities of R 0 correspond to the parameters related to congenital and transfusion transmission from individuals at the chronic indeterminate stage (with identical values). The largest elasticities are those corresponding to the transmission of T. cruzi from humans at the chronic indeterminate stage, indicating that estimates of the number of individuals at this stage of the disease should be accurate. It should be noted that the increase in the values of parameters of mortality associated with individuals at any stage of infection, cure of individuals at the acute and chronic indeterminate stages and evolution from the acute to the chronic indeterminate stage will result in decreases in R 0 and vice versa.
We performed the numerical resolution of the system of differential equations by describing the dynamics of infection in the city. At first, the number of chronic indeterminate individuals decreases, not only by the favourable effect of the treatment but also by other causes of removal, such as emigration or mortality or the progression of the disease, thus increasing the number of individuals at the chronic with specific pathology stage. The number of individuals at the chronic with determinate pathology stage increased during the first 10 years of the numerical resolution possibly because of the evolution of the disease in the first chronic indeterminate individuals, but then decreased, possibly because of the decrease in the number of chronic indeterminate individuals, and finally stabilized. We conclude that according to the estimated parameters and initial values of the number of infected and susceptible individuals and the real flow of migration, an endemic disease is established by the constant immigration of individuals infected with T. cruzi. Although the proportion of people infected with T. cruzi decreases from 3·7% initially to 0·4% in 100 years, this decrease could have been due to (a) dilution due to the increase in the number of susceptible individuals, (b) the effect of cure of individuals who are in the acute and chronic indeterminate stages, (c) emigration or mortality and (d) the fact that the parameters of immigration of individuals infected with T. cruzi are expressed as independent quantities, while in the rest of the processes the parameters multiply the numbers in the different compartments (these constant values were obtained from official data when it was considered that the population of the city was 3 million inhabitants). The important conclusion here is the establishment of a stable number of about 16 700 infected individuals.
It is worth noting the importance of the time horizon of the numerical resolution. If this time were only 10 years, we would think of the number of individuals at the chronic with determinate pathology stage as an increasing function, whereas if this time were 20 years, one may think that the number of all infected individuals, including those at that stage, would tend to zero. But if the time horizon is extended, it is envisioned that the number of individuals at the chronic with determinate pathology stage will reach a maximum around 10 years, and then decrease and stabilize, and that the number of individuals in the other two clinical stages will also be stabilized.
Considering that there is no flow of migration of infected people, the system shows that the infection tends to disappear, because after 244 years the number of individuals at each stage of the disease is lower than one. In other words, as expected, there is a tendency to extinction of the infection, but this model shows that the parasite can remain active for up to 244 years. So, in public health, the development of effective programmes to diagnose, treat and prevent the disease is needed.
These results confirm the need to consider the three stages of infection in humans and that the chronic indeterminate stage is the most influential in the dynamics of the disease. Importantly, the number of infected cases generated by an individual at the acute stage would be similar to that generated by an individual at the chronic indeterminate stage, thus showing the importance of the chronic indeterminate stage in the generation of new infected individuals. The influence of immigration of infected individuals in cities such as Buenos Aires, in the course of the dynamics of infection, is ascertained, resulting in a stable endemic level or in the disappearance of the infection, depending on the presence of migration of infected individuals (the number of infected immigrants exceeding that of infected emigrants).
Blood transfusion transmission in our work was modelled by assuming that blood donors are randomly chosen from the total population. For instance, migrants of endemic areas, children and old people are considered as anybody else. Of course, this is an unrealistic assumption, but we used it for simplification. On the other hand, inter-human transmission has practical implications in non-endemic areas where there are concentrations of immigrants from endemic areas. Since recent immigrants tend to concentrate in regions with strong ethnic identities, inter-human transmission in such regions may become high enough to sustain a geographically localized endemic level. To take account of demographic variation, it would be necessary to introduce additional differential equations in the model. Although this would produce more accurate results, there are no actual estimations of the parameters entering the new equations. So, we would obtain a more complicated model without the benefit in description.
Given the social vulnerability of infected people – usually immigrants of endemic areas, asymptomatic, unaware of their status and consequently untreated – it is necessary to design and implement public health programmes to detect and assess the risk introduced by a specific group of blood donors and women of child-bearing age by using serological testing and pathogen inactivation procedures (Gascon et al. Reference Gascon, Bern and Pinazo2010; Jackson and Chappuis, Reference Jackson and Chappuis2011). This is not only to reduce the harm in affected people and the social costs of the disease but also to reduce the risk of transmission to the local population (World Health Organization, 2009, 2011).
Finally, the analyses performed and the results obtained in this work can describe qualitatively and quantitatively the impact of the presence of infected individuals in the dynamics of the disease in a setting without the presence of triatomines. It is noted that the analysis can be applied to other cities or areas outside endemic areas, even of other continents.
FINANCIAL SUPPORT
This research received no specific grant from any funding agency, commercial or not-for-profit sectors.