Implications
A better knowledge of the rumen microbiome may help us to understand, and eventually modulate, the effect of nutrition on milk fat production and quality. This work was conducted to evaluate the effect of two sources of dietary lipids: soybean oil (SO, an unsaturated source) and hydrogenated palm oil (HPO, a saturated source) on bacterial populations and the fatty acid (FA) profile of ruminal digesta. Contents of C15:0 iso, C18:11 trans-11 and C18:2 cis-9, trans-11 were increased by SO. Supplementation with SO or HPO (2.7% dry matter (DM)) did not affect ruminal fermentation parameters, whereas HPO can increase loads of ruminal Prevotella bryantii.
Introduction
Dietary polyunsaturated fatty acids (PUFA) have toxic effects on ruminal microorganisms, therefore, lipid supplementation often leads to changes in ruminal microbial populations and shifts in ruminal fermentation parameters (Zhang et al., Reference Zhang, Guo, Yuan, Wu, Wang, Liu and Zhu2008). Rumen microbes attempt to detoxify PUFA by biohydrogenation (Maia et al., Reference Maia, Chaudhary, Bestwick, Richardson, McKain, Larson, Graham and Wallace2010). Biohydrogenation pathways require an initial hydrolysis of ingested dietary glyceride by microbial lipases/esterases causing the release of FA (Prive et al., Reference Prive, Newbold, Kaderbhai, Girdwood, Golyshina, Golyshin, Scollan and Huws2015) at this stage; Anaerovibrio lipolytica is recognized as one of the major species involved in lipid hydrolysis in ruminants (Prive et al., Reference Prive, Kaderbhai, Girdwood, Worgan, Pinloche, Scollan, Huws and Newbold2013). Wallace et al. (Reference Wallace, Chaudhary, McKain, McEwan, Richardson, Vercoe, Walker and Paillard2006) proposed that Butyrivibrio genus contained the main bacterial species involved in the biohydrogenation process. However, Huws et al. (Reference Huws, Kim, Lee, Scott, Tweed, Pinloche, Wallace and Scollan2011) demonstrated that as yet uncultured bacteria belonging to the genera Prevotella and Anaerovoax, and unclassified Ruminococcaceae and Clostridiales may play more important roles in ruminal biohydrogenation.
It is known that cellulolytic bacteria (Fibrobacter succinogenes, Ruminococcus flavefaciens, Ruminococcus albus and Butyrivibrio fibrisolvens) are important in the biohydrogenation process of dietary sources of PUFA (Potu et al., Reference Potu, AbuGhazaleh, Hastings, Jones and Ibrahim2011). Also, Butyrivibrio proteoclasticus has been reported to be the principal rumen bacteria involved in biohydrogenation of C18:1 FA (Boeckaert et al., Reference Bligh and Dyer2008). On the other hand, P. bryantii has been described as a ruminal bacterium that is involved in oligosaccharolytic and xylanolytic activities (Tajima et al., Reference Tajima, Aminov, Nagamine, Matsui, Nakamura and Benno2001) and also Prevotella spp. has been reported as resistant to inhibitory effects of dietary PUFA (Huws et al., Reference Huws, Edwards, Kim and Scollan2010).
Supplementing dairy cow diets with SO can increase milk bioactive FA such as C18:1 trans-11 (Allred et al., Reference Amann, Ludwig and Schleifer2006; Vargas-Bello-Perez et al., Reference Vargas-Bello-Perez, Fehrmann-Cartes, Iniguez-Gonzalez, Toro-Mujica and Garnsworthy2015a). Also, SO has been shown to reduce cellulolytic bacteria, protozoal populations and total concentration of volatile fatty acids (VFA) (Yang et al., Reference Yang, Bu, Wang, Hu, Li, Wei, Zhou and Loor2009). On the other hand, hydrogenated vegetable oils have been used to increase the energy content of dairy cow diets in housed (Kargar et al., Reference Kargar, Ghorbani, Alikhani, Khorvash, Rashidi and Schingoethe2012) and pasture systems (Schroeder et al., Reference Schroeder, Gagliostro, Becu-Villalobos and Lacau-Mengido2002) without effect on milk composition (Vargas-Bello-Perez et al., Reference Vargas-Bello-Perez, Iniguez-Gonzalez, Fehrmann-Cartes, Toro-Mujica and Garnsworthy2015b).
To our knowledge, no study on the effect of dietary HPO on ruminal bacterial populations in dairy cows has been published. Also, animal trials reporting use of oils and their effect on rumen microbiome have less risk of bias compared with in vitro studies. Therefore, the aim of this study was to make a quantitative analysis of bacterial populations involved in ruminal biohydrogenation (F. succinogenes, B. proteoclasticus and A. lipolytica) and P. bryantii (one of the most predominant ruminal bacteria) in dairy cows fed different vegetable oils (SO as an unsaturated source and HPO as a saturated source). The effect of fat supplements on the FA profile of ruminal digesta was another objective. Our hypothesis was that supplementation with saturated v. unsaturated oils would have different effects on bacterial populations that were or were not involved in biohydrogenation.
Material and methods
Animals and treatments
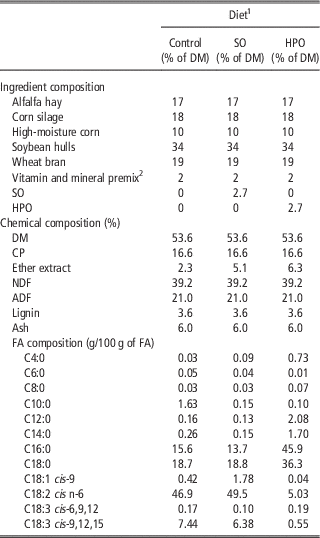
Three non-lactating Holstein cows (684.7±84.7 kg BW) fitted with ruminal cannulae no. 3C (Bar Diamond Inc., Boise, ID, USA) were used in a 3×3 Latin square design with three periods consisting of 21 days. Cows were fed to satisfy the requirements of a dry cow in the last trimester of gestation consuming 10 kg DM daily (National Research Council, 2001). Dietary treatments (Table 1) were a basal diet (Control) containing 56% forage and 44% concentrate ratio with no fat supplement, and fat-supplemented diets containing SO (170 g/day per cow=2.7% DM) and HPO (170 g/day per cow=2.7% DM). The amounts of oil used were similar to those reported to alter rumen FA in previous studies (Yang et al., Reference Yang, Bu, Wang, Hu, Li, Wei, Zhou and Loor2009; Vargas-Bello-Perez et al., Reference Vargas-Bello-Perez, Fehrmann-Cartes, Iniguez-Gonzalez, Toro-Mujica and Garnsworthy2015a). The most important FA in dietary oils were as follows: SO contained (g/100 g) 25 of C18:1 cis-9 and 51 of C18:2 cis n-6, whereas HPO contained 47 of C16:0 and 43 of C18:0. Oils were administrated separately and mixed manually into the daily total mixed ration (TMR) for each cow. Animals were housed in individual stalls (2.4×6 m) and had free access to fresh water. Animal care and procedures were carried out according to the guidelines of the Animal Care and Use Committee of the Pontificia Universidad Católica de Chile.
Ingredients and chemical compositions of control, soybean oil (SO) and hydrogenated palm oil (HPO) diets

DM=dry matter; FA=fatty acids.
1 Control=basal diet/no fat supplement; SO=basal diet+170 g/day per cow of SO; HPO=basal diet+170 g/day per cow of HPO.
2 Contained per kg: 25 000 mg of P; 80 000 mg of Ca; 25 000 mg of Mg; 1612 mg of S; 300 000 IU of vitamin A; 50 000 IU of vitamin D3 ; 1600 IU of vitamin E.
Samples
On the last day of each 21-day period, samples of whole ruminal digesta were collected from the anterior, dorsal and mid-ventral regions of the rumen at 0900 h (2 h post feeding) and were squeezed through three layers of cheesecloth. A quantity of 10 ml of residual ruminal fluid was immediately used to determine pH by using a pH meter (PP-201; GOnDO Electronic, Taipei, Taiwan), 10 ml were kept for NH3–N analysis (Bal et al., Reference Bal, Shaver, Jirovec, Shinners and Coors2000) and another 10 ml were preserved for VFA determination by adding 1 ml of 25% metaphosphoric acid. Samples were frozen (−20°C) for later analysis. The VFA measurement were performed by gas chromatograph (GC-2010, Shimadzu Scientific Instruments, Columbia, MD, USA) equipped with a 30-m wall-coated open-tubular fused-silica capillary column (Stabilwax-DA; 30 m×0.32 mm i.d., 0.25 µm film thickness; Restek, Bellefonte, PA, USA). Oven temperature was programmed for 145°C for 2 min and then increased from 145°C to 220°C at 4°C/min. The injector and flame ionization detector were maintained at 250°C and 300°C, respectively. Following pH determination, the strained ruminal fluid was centrifuged for 10 min at 3000×g at room temperature. The supernatant was discarded and the residue was stored at −20°C until microbiology analysis.
DNA extraction
Samples from each cow and every period were weighed (240±12 µg) and deposited in 1.5 ml Eppendorf tubes. Subsequently, 300 µl of phosphate-buffered saline solution were added and mixed to homogenize the sample. DNA was obtained by incubating the sample for 30 min at 37°C with lysozyme (1 μg/μl) and then for 30 min at 37°C with proteinase K (0.1 mg/ml). DNA extraction was performed using the PowerSoil DNA Isolation Kit (MO BIO Laboratories Inc., Carlsbad, CA, USA) according to the manufacturer’s recommendations.
Quantitative PCR conditions
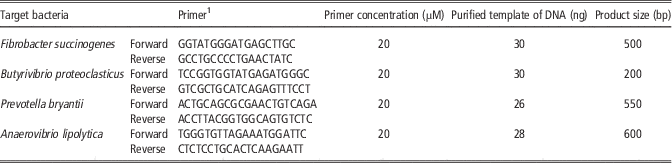
Primers (forward and reverse) used to target bacterial species of interest are described in Table 2. Primers for A. lipolytica (Tajima et al., Reference Tajima, Aminov, Nagamine, Matsui, Nakamura and Benno2001), F. succinogenes (Tajima et al., Reference Tajima, Aminov, Nagamine, Matsui, Nakamura and Benno2001), B. proteoclasticus (Huws et al., Reference Huws, Edwards, Kim and Scollan2010) and P. bryantii (Tajima et al., Reference Tajima, Aminov, Nagamine, Matsui, Nakamura and Benno2001) were those reported in previous research. Once obtained, the primers were tested for specificity using the probe match function at the Ribosomal Database Project (RDP; https://rdp.cme.msu.edu/probematch/search.jsp), as described by Huws et al. (Reference Huws, Lee, Muetzel, Scott, Wallace and Scollan2007). The oligonucleotides from each target bacteria were synthetized from Integrated DNA Technologies (Coralville, IA, USA). These primers were also analyzed for the requirements necessary for real-time PCR.
PCR primers and template DNA for detection of ruminal bacteria

1 F. succinogenes, P. bryantii and A. lipolytica primers were described by Tajima et al. (Reference Tajima, Aminov, Nagamine, Matsui, Nakamura and Benno2001), whereas B. proteoclasticus primers were described by Huws et al. (Reference Huws, Edwards, Kim and Scollan2010).
Real-time PCR quantification (qPCR) of total ruminal bacteria and bacterial species of interest was performed on a Rotor Gene 6000 (Corbett Life Science, Brisbane, Australia). Quantification of total ruminal bacteria was accomplished by qPCR amplifying the V3–V4 region of the 16S ribosomal RNA (rRNA) gene using the conserved bacterial domain-specific primers 341f (5'-CCTACGGGAGGCAGCAG-3') and 788r (5'-GGACTACCAGGGTATCTAA-3'). PCR reactions were carried out in quadruplicate and in 10 μl final volume containing 1 μl of extracted DNA (1 : 1000 dilution), 25 pmol/µl of each primer, DNAse-free water and 2×LightCycler® 480 DNA Master SYBR Green I (Roche Applied Science, Mannheim, Germany). PCR conditions started with an initial denaturation at 95°C for 5 min, followed by 50 cycles of denaturation at 95°C for 10 s, annealing at 60°C for 10 s and extension at 72°C for 15 s. The reaction mixture for quantification of specific bacteria consisted of 1 μl of DNA template, 20 pmol/µl of each specific primer described in Table 2, DNAse-free water and 2×LightCycler® 480 DNA Master SYBR Green I. The PCR program was similar to total bacterial quantification, except for annealing temperature. Annealing for A. lipolytica and B. proteoclasticus was performed at 62°C, and F. succinogenes and P. bryantii’s annealing was performed at 60°C. Specificity of qPCR reactions was confirmed by analyzing the temperature characteristics of melting curves – increase of temperature from 72°C to 95°C, holding 1 s on the first step and 5 s on next steps.
The number of copies of the target bacterial 16S ribosomal DNA (rDNA) were determined by the serial dilution of purified genomic DNA extracted from ruminal samples, with the objective to construct specific calibration curves, and thus calculate the concentration of total and target bacteria in samples. The bacterial concentrations were calculated considering the rRNA operon copy number of each bacterial genome described in GenBank as follows: F. succinogenes, three copies (Accession number CP001792.1); P. bryantii, four copies (Accession number NZ_AUKF00000000.1); B. proteoclasticus, six copies (Accession number NZ_JHWL00000000.1) and A. lipolytica, one copy (Accession number NZ_JHYA00000000.1). The qPCR efficiencies for bacterial species of interest were obtained using standard dilution curves in quadruplicate of A. lipolytica, F. succinogenes, B. proteoclasticus and P. bryantii 16S rDNA, respectively. The qPCR efficiencies were calculated according to the equation: E=[(10(1/slope))−1]. Standard curves were generated using relative concentration v. the threshold cycle (Ct). The qPCR efficiencies (E) were calculated from the given slopes (M) in a Rotor Gene 6000 software. Based on the slopes of the standard curves, the qPCR efficiencies ranged from 80% to 97%. The transcripts studied showed high linearity: R 2>0.99.
In addition, to check the expected sizes of each PCR product, the amplicons were visualized by electrophoresis on a 1% (w/v) agarose gel which was stained using ethidium bromide and Lambda DNA/HindIII marker was used to compare the 16S rDNA amplification fragments.
Sequence analysis
To verify the correct amplification in the qPCR assays of specific bacteria, the PCR products were sequenced using the Macrogen USA (Rockville, MD, USA) sequencing service. The 16S rDNA sequences were compared with the available databases using the Basic Local Alignment Search Tool (http://blast.ncbi.nlm.nih.gov/Blast.cgi) and aligned with reference sequences using Sequence Match function at the RDP (https://rdp.cme.msu.edu/seqmatch/seqmatch_intro.jsp) to determine the approximate phylogenetic affiliations.
Fatty acid analysis
Lipids from oils, diets and ruminal digesta were extracted with chloroform/methanol (2 : 1, v/v) by the method of Bligh and Dyer (Reference Bessa, Maia, Jeronimo, Belo, Cabrita, Dewhurst and Fonseca1959) and trans-esterified with sodium methoxide according to the method of Christie (Reference Christie1982) using a methylation reagent (1.75 ml methanol : 0.4 ml of 5.4 mol/l sodium methylate) and a termination reagent (1 g oxalic acid/30 ml diethyl ether) according to Chouinard et al. (Reference Chouinard, Corneau, Saebo and Bauman1999). All chemicals and solvents used for this method were of analytical grade. A Gas Chromatography (GC) system (GC-2010) equipped with a 100-m column (Rt-2560 column 100 m×0.32 mm×0.20 µm column; Restek, Bellefonte, PA, USA) was used. The GC conditions were as follows: the oven temperature was initially set at 110°C for 4 min after injection, and then increased to 240°C (20°C/min) with equilibration time of 2 min. The inlet and flame ionization detector temperatures were 260°C, the split ratio was 15 : 1 and a 2 µl injection volume was used. The H2 carrier gas flow to the detector was 40 ml/min, airflow was 400 ml/min and the flow of N makeup gas was 25 ml/min. FA peaks were identified by using a fatty acid methyl ester standard (FAME, Supelco 37 Component FAME mix; Supelco, Bellefonte, PA, USA).
Statistical analysis
Bacterial qPCR data were log10-transformed to attain normality. Data were analyzed as a 3×3 Latin square design using the GenStat (12th edition) statistical package (VSN International Ltd, Oxford, UK). Fixed effects were experimental periods and treatments, and the random effect was the cow. When significant treatment effects were detected, means were separated using Tukey’s test. Probability of P<0.05 was used to determine significant differences among means.
Results
Ruminal fermentation parameters and ruminal bacteria quantification
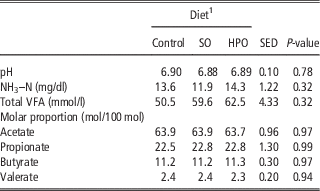
Cows consumed all their individual allocation of TMR (10 kg DM/cow per day) with no feed refusals. Rumen digesta pH, NH3–N and total VFA were similar for the three dietary treatments and averaged 6.9, 13.3 mg/dl and 57.5 mmol/l, respectively. Molar proportions (mol/100 mol) of individual VFA were comparable across dietary treatments and averaged 63.8 for acetate, 22.7 for propionate, 11.2 for butyrate and 2.4 for valerate (Table 3).
Ruminal pH, NH3–N and volatile fatty acids (VFA) from cows fed control, soybean oil (SO) and hydrogenated palm oil (HPO)

1 Control=basal diet/no fat supplement; SO=basal diet+170 g/day per cow of SO; HPO=basal diet+170 g/day per cow of HPO.
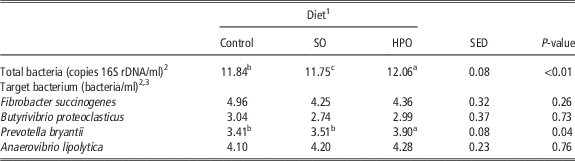
In this study, ruminal bacterial populations involved in lipid metabolism were quantified by qPCR (Table 2). The obtained PCR products were checked by expected size and sequenced. All the PCR products corresponded to the expected size: F. succinogenes (500 bp), B. proteoclasticus (200 bp), P. bryantii (550 bp) and A. lipolytica (600 bp) (not shown) and the sequences corresponded to the target organism. Compared with control, total bacteria (copies of 16S rDNA/ml) was decreased (P<0.05) by SO and increased (P<0.05) by HPO. The load of target bacteria (bacteria/ml) was similar for all dietary treatments and averaged: 4.52 for F. succinogenes, 2.92 for B. proteoclasticus and 4.19 for A. lipolytica (Table 4). However, the load of P. bryantii was increased (P<0.05) by HPO but not by SO.
Quantification of ruminal bacteria by PCR from cows fed control, soybean oil (SO) and hydrogenated palm oil (HPO)

rDNA=ribosomal DNA.
a,b,cMeans in the same row with different superscripts are different (P<0.05).
1 Control=basal diet/no fat supplement; SO=basal diet+170 g/day per cow of SO; HPO=basal diet+170 g/day per cow of HPO.
2 Log10.
3 Based on ribosomal operon copy number.
Fatty acid composition of ruminal digesta
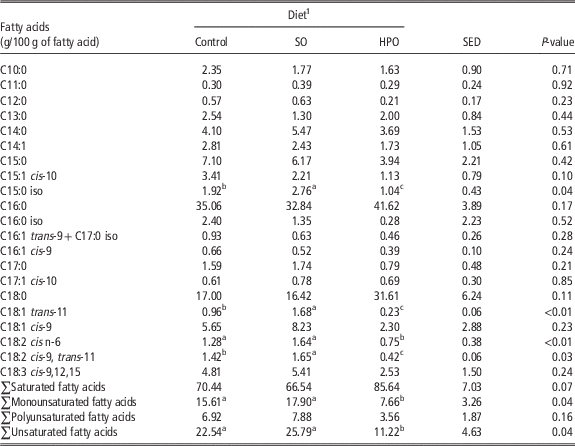
Data from the FA composition of ruminal digesta are shown in Table 5. The most abundant FA in ruminal digesta regardless of dietary treatment were (g/100 g) as follows: C14:0 (4.4), C15:0 (5.7), C16:0 (36.5), C18:0 (21.7), C18:1 cis-9 (5.4) and C18:3 cis-9,12,15 (4.3). Compared with control and SO, HPO decreased (P<0.05) C18:2 cis n-6 (1.28 and 1.64 v. 0.75 g/100 g) and total contents of monounsaturated (15.61 and 17.9 v. 7.66 g/100 g) and unsaturated (22.54 and 25.79 v. 11.22 g/100 g) FA in ruminal digesta. Also, compared with control and HPO, SO increased (P<0.05) contents (g/100 g) of C15:0 iso (1.92 and 1.04 v. 2.76), C18:1 trans-11 (0.96 and 0.23 v. 1.68) and C18:2 cis-9, trans-11 (1.42 and 0.42 v. 1.65). Dietary treatments did not affect contents (g/100 g) of the following FA: C10:0, C11:0, C12:0, C13:0, C14:0, C14:1, C15:0, C15:1 cis-10, C16:0, C16:0 iso, C16:1 trans-9+C17:0 iso, C16:1 cis-9, C17:0, C17:1 cis-10, C18:0, C18:1 cis-9 and C18:3 cis-9,12,15.
Fatty acid composition of ruminal digesta from cows fed control, soybean oil (SO) and hydrogenated palm oil (HPO)

a,b,cMeans in the same row with different superscripts are different (P<0.05).
1 Control=basal diet/no fat supplement; SO=basal diet+170 g/day per cow of SO; HPO=basal diet+170 g/day per cow of HPO.
Discussion
In this study, ruminal pH and NH3–N were not affected by dietary treatments, this partly agrees with the studies by Yang et al. (Reference Yang, Bu, Wang, Hu, Li, Wei, Zhou and Loor2009) who did not report ruminal pH changes when cows were fed SO and linseed oil, but did observe increases in ruminal NH3–N concentration. Benchaar et al. (Reference Benchaar, Romero-Perez, Chouinard, Hassanat, Eugene, Petit and Cortes2012) reported no effect on pH, VFA and NH3–N when dairy cows were supplemented with linseed oil at 2%, 3% and 4% DM. In the present study, lack of difference in ruminal fermentation parameters may be due to the amount (almost 3% of DM) of oil incorporated into the basal diet. Differences from other studies such as Yang et al. (Reference Yang, Bu, Wang, Hu, Li, Wei, Zhou and Loor2009), on the effect dietary oils on ruminal fermentation parameters in dairy cows may be explained by the amount of dietary oil and the forage source used, for example, VFA patterns were not affected when cows were supplemented with linseed oil (3% DM) on a hay-based diet (Ueda et al., Reference Ueda, Ferlay, Chabrot, Loor, Chilliard and Doreau2003), whereas on a corn silage-based diet they were changed (Doreau et al., Reference Doreau, Aurousseau and Martin2009).
The chemical configuration of dietary lipids is associated with their effects on ruminal microorganisms. For example, PUFA are more toxic for biohydrogenating bacteria (e.g. B. fibrisolvens) than monoenoic FA (Lourenco et al., Reference Lourenco, Ramos-Morales and Wallace2010). Consequently, SO, which is a rich source of C18:2 cis n-6, is expected to have strong negative effects on ruminal bacterial populations; this agrees in part with the reduction of total bacteria (copies of 16S rDNA/ml) caused by SO treatment observed in this study. During rumen byohydrogenation, C18:2 cis n-6 yields several intermediate compounds until reduction to C18:0 (Castagnino et al., Reference Castagnino, Messana, Fiorentini, De Jesus, Vito, Carvalho and Berchielli2015). In the present study, C18:1 trans-11 and C18:2 cis-9, trans-11 (biohydrogenation intermediate isomers) were increased in rumen contents with SO compared with control and HPO. This is important for milk production because those FA can escape from the rumen and be secreted in milk as shown by Bu et al. (Reference Bu, Wang, Dhiman and Liu2007) who observed increases in the C18:1 trans-11 and C18:2 cis-9, trans-11 concentrations of milk fat when dairy cows were supplemented with vegetable oils and oilseeds rich in C18:2 cis n-6.
Increases of C15:0 iso provoked by SO are particularly interesting, as branched-chain FA have been suggested to reflect rumen function (e.g. ruminal fermentation pattern) and also contribute to the formation of the main odd- and branched-chain FA in milk (Vlaeminck et al., Reference Vlaeminck, Fievez, Cabrita, Fonseca and Dewhurst2006). The odd- (C15:0 and C17:0) and branched- (C13:0 iso, C14:0 iso, C15:0 iso, C16:0 iso, C17:0 iso, C18:0 iso, C13:0 anteiso, C15:0 anteiso, C17:0 anteiso) chain fatty acids (OBCFA) profile of the rumen bacteria appears to be largely determined by the FA synthase activity of the microorganism rather than by the precursor availability (Vlaeminck et al., Reference Vlaeminck, Fievez, Cabrita, Fonseca and Dewhurst2006). Consequently, variation in the OBCFA profile leaving the rumen is expected to mirror changes in the relative abundance of specific bacterial populations in the rumen rather than an altered bacterial FA synthesis. In this study, supplementation with SO may have influenced the FA synthase activity of ruminal microorganisms, specifically from Prevotella spp. and B. fibrisolvens (Fievez et al., Reference Fievez, Colman, Castro-Montoya, Stefanov and Vlaeminck2012). It has been suggested that higher proportions of iso-FA in solid-associated bacteria reflect their enrichment in cellulolytic bacteria (e.g. B. fibrisolvens), whereas higher proportions of anteiso-C15:0 in liquid-associated bacteria might indicate their enrichment in pectin- and sugar-fermenting bacteria (e.g. Prevotella spp.) (Bessa et al., Reference Boeckaert, Vlaeminck, Fievez, Maignien, Dijkstra and Boon2009).
Normally in dairy cow diets, ruminal biohydrogenation of C18:2 cis n-6 varies between 70% and 95%, indicating that with the exception of diets containing marine lipids C18:0 is the major FA escaping from rumen (Shingfield et al., Reference Shingfield, Bonnet and Scollan2013). In the present study, this was corroborated by the FA profile of rumen digesta where C16:0 and C18:0 were the most predominant saturated FA (especially in HPO). Also, in the present study, HPO decreased ruminal C18:2 cis n-6, which may be explained by the levels of C18:2 cis n-6 in the HPO diet which was notably lower than control and SO.
It has been recognized that cellulolytic bacteria can be affected by dietary supplementation of lipids with high concentrations of PUFA (Paillard et al., Reference Paillard, McKain, Chaudhary, Walker, Pizette, Koppova, McEwan, Kopecny, Vercoe, Louis and Wallace2007). This is explained by factors such as disruption of microbial cell membranes and cell function caused by PUFA and lipid coating of feed particles (especially fibrous components) and bacteria (Yang et al., Reference Yang, Bu, Wang, Hu, Li, Wei, Zhou and Loor2009). The antimicrobial effect of lipids in the rumen is related to the cytotoxic effects of FA on membrane function of eukaryotic cells (Maia et al., Reference Maia, Chaudhary, Bestwick, Richardson, McKain, Larson, Graham and Wallace2010). Long-chain unsaturated FA appear to be more toxic to ruminal bacteria as they can attach to lipid bilayers in bacterial membranes (because of their hydrophobic and amphiphilic nature). The longer the chains, and the more double bonds, the easier it is for FA to attach and destroy membranes of bacteria (Zheng et al., Reference Zheng, Liu, Yao, Yuan, Ye, Ye and Wu2005).
Although, Prevotella spp. has been reported to be resistant to dietary PUFA (Huws et al., Reference Huws, Edwards, Kim and Scollan2010), in this study, P. bryantii load was increased by HPO (a saturated source), which agrees in part with the study by Choi et al. (Reference Choi, Park, Hwang, Sohn, Kwak, Cho and Choi2013) who reported that C16:0 and C18:0 have less antibacterial effect than PUFA (HPO diet contained 46 g of C16:0 and 36 g of C18:0 per 100 g of total FA). In concordance with that, it has been reported that consumption of animal fats (mainly saturated FA) has been associated with the presence of Prevotella and Bacteroides (Tremaroli and Bäckhed, Reference Tremaroli and Backhed2012). Another possible explanation for increased Prevotella with the HPO diet may be the interaction of a saturated lipid source and a substrate (our basal diet comprised of 56% forage and 44% concentrate ratio). The Prevotella spp. are the dominant bacteria in the rumen (Stevenson and Weimer, Reference Stevenson and Weimer2007) and their ruminal populations vary according to different substrates, for example, on a hay diet, Prevotella ruminicola is predominant, whereas on a grain diet P. bryantii is predominant (Tajima et al., Reference Tajima, Aminov, Nagamine, Matsui, Nakamura and Benno2001). Our results are similar to those reported by Rico and Harvatine (Reference Rico and Harvatine2013), who fed dairy cows with a control diet composed of 60% forage and 40% concentrate and a low-fiber diet supplemented with 3 g/100 g of SO, later the authors Rico et al. (Reference Rico, Preston, Risser and Harvatine2015) studied the ruminal microbiome and found that the abundance of P. bryantii was lowered in the control diet.
This study used qPCR to analyze bacterial concentrations using their DNA and did not use isolation from pure cultures. Compared with culture-dependent studies, our results may be more precise because we avoided ‘plate count anomaly’ and the use of laborious protocols to isolate the target bacterial populations (Amann et al., Reference Allred, Dhiman, Brennand, Khanal, McMahon and Luchini1995). The primers used in this study were previously validated (Tajima et al., Reference Tajima, Aminov, Nagamine, Matsui, Nakamura and Benno2001; Huws et al., Reference Huws, Edwards, Kim and Scollan2010). Furthermore, the primers were checked using the probe match tool in the RDP (Huws et al., Reference Huws, Lee, Muetzel, Scott, Wallace and Scollan2007; Cole et al., Reference Cole, Wang, Fish, Chai, McGarrell, Sun, Brown, Porras-Alfaro, Kuske and Tiedje2014). One interesting point is that the sum of the selected bacterial populations corresponded to half of the total bacterial, and this observation was independent of the diet used. Therefore, more studies should be performed to obtain a clear picture of the changes in ruminal bacterial populations; a metagenomic approach could provide a deeper composition of ruminal populations.
Conclusions
In conclusion, supplementation with SO or HPO (2.7% DM) did not affect ruminal fermentation parameters, whereas HPO can increase loads of ruminal P. bryantii. Also, results observed in our target bacteria may have depended on the degree of saturation of dietary oils.
Acknowledgments
This study was funded by a research grant from FONDECYT 11121142 and 1140734 (Fondo Nacional de Desarrollo Científico y Tecnológico, Chile). The authors thank Juanita Clavijo, Jorge Manzor and Pamela Alvarez for their technical assistance and Fundación Agro U.C. for the animal facilities and assistance in obtaining research data.