





1. Introduction
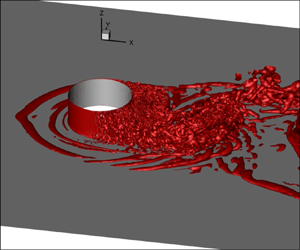
Flow past a circular cylinder has been of great interest to the fluid mechanics community. It is useful in many engineering and scientific applications. Several researchers have carried out experimental and computational studies to understand the flow (Williamson Reference Williamson1996b). The flow is governed by the Reynolds number ( $Re$) which is defined as
 $Re={\rho U_{\infty } D}/{\mu }$, where
 $\rho$ is the fluid density,
 $U_{\infty }$ is the free stream velocity,
 $D$ is the diameter of the cylinder and
 $\mu$ is the coefficient of dynamic viscosity of the fluid. The flow is steady up to
 $Re\approx 47$. In this regime two counter-rotating standing vortices are observed in the wake of the cylinder. The flow loses its stability via Hopf bifurcation and becomes unsteady beyond
 $Re\approx 47$ (Mathis, Provansal & Boyer Reference Mathis, Provansal and Boyer1984; Sreenivasan, Strykowski & Olinger Reference Sreenivasan, Strykowski and Olinger1987; Kumar & Mittal Reference Kumar and Mittal2006). In this regime, alternate vortices form in the near wake and shed downstream (Kumar & Mittal Reference Kumar and Mittal2006; Chopra & Mittal Reference Chopra and Mittal2019).
Three-dimensionality sets in the flow at  $Re\approx 180$ via mode-A instability (Williamson Reference Williamson1992, Reference Williamson1996a; Behara & Mittal Reference Behara and Mittal2010). The shear layer separating from either shoulder of the cylinder undergoes transition from a laminar to a turbulent state via the Kelvin–Helmholtz mode of instability. There is a large scatter in the data reported in the literature regarding the critical
 $Re$ for onset of shear layer instability. Bloor (Reference Bloor1964) reported that the critical
 $Re$ for onset of shear layer instability is approximately
 $1300$. Unal & Rockwell (Reference Unal and Rockwell1988) observed critical
 $Re$ to be approximately
 $1900$ and Gerrard (Reference Gerrard1978) found it to be much lower at
 $350$. Prasad & Williamson (Reference Prasad and Williamson1997) reported that the critical
 $Re$ is different for parallel and oblique shedding; it is
 ${\approx }1200$ for parallel shedding and
 ${\approx }2600$ for oblique shedding. Consistent with the observation by Bloor (Reference Bloor1964), they found the shear layer instability to be intermittent in nature. Kumar et al. (Reference Kumar, Kottaram, Singh and Mittal2009) carried out global linear stability analysis of flow past a cylinder with centreline symmetry. It was found that the shear layer becomes unstable due to convective instabilities for
 $Re$ beyond 54 for unbounded flow. The convective instabilities are sensitive to background disturbances. This explains the relatively large scatter in the experimental studies regarding the critical
 $Re$ for onset of the instability of the separated shear layers. The location in the wake where the shear layer undergoes transition moves upstream with increase in
 $Re$.
The instability of the separated shear layer, at large enough  $Re$, leads to transition of the boundary layer. This was demonstrated by Singh & Mittal (Reference Singh and Mittal2005) via two-dimensional, and later Behara & Mittal (Reference Behara and Mittal2011) with three-dimensional, simulations for flow past a cylinder. They showed that the shear layer instability causes the separated shear layer to roll into vortices. At the critical
 $Re$, these vortices are generated very close to the surface of the cylinder causing the separated shear layer to transition to a turbulent state. The turbulent shear layer reattaches to the surface of the cylinder at a downstream location. A laminar separation bubble (LSB) forms between the point of separation and reattachment of the boundary layer (Tani Reference Tani1964). The velocity profile of the reattached turbulent boundary layer shows a region of log layer similar to the one in the zero pressure gradient turbulent boundary layer over a flat plate (Singh & Mittal Reference Singh and Mittal2005; Cheng et al. Reference Cheng, Pullin, Samtaney, Zhang and Gao2017). The reattached turbulent boundary layer separates farther downstream. Compared with the separation of the laminar boundary layer, the delayed separation of the turbulent boundary layer leads to a very significant decrease in drag with increase in
 $Re$. This phenomenon is referred to as drag crisis (Landau & Lifshitz Reference Landau and Lifshitz1982). An interesting flow structure, other than LSB, has been reported in the flow past a cylinder. Son & Hanratty (Reference Son and Hanratty1969) measured velocity gradient at the surface of a cylinder in the subcritical regime. They observed a secondary recirculation bubble downstream of the separation point and referred to it as a secondary vortex (SV). The same was observed by Cheng et al. (Reference Cheng, Pullin, Samtaney, Zhang and Gao2017) from their wall resolved large eddy simulation (LES) in the subcritical regime. According to Cheng et al. (Reference Cheng, Pullin, Samtaney, Zhang and Gao2017), both SV and LSB are the outcome of secondary separation in the flow. The phenomenon of secondary separation occurs downstream of the laminar separation (LS) point and inside the wake separation bubble, in the case of SV. On the other hand, an LSB forms when the secondary separation moves upstream and outside of the primary wake separation bubble. They indicated that SV and LSB do not coexist. Ono & Tamura (Reference Ono and Tamura2008) carried out LES at
 $Re=6\times 10^5$ and observed that SV and LSB coexist in the flow. The SV forms between the separation and reattachment points of the LSB.
Bearman (Reference Bearman1969), Schewe (Reference Schewe1983) and Cadot et al. (Reference Cadot, Desai, Mittal, Saxena and Chandra2015) observed a two-step drag crisis in their respective experimental studies. In the first step, the boundary layer on one side of the cylinder undergoes transition. The flow attains a critical state on that side while it stays in a subcritical state on the other side. In the second step, the boundary layer transitions to a critical state on the other side as well. Behara & Mittal (Reference Behara and Mittal2011) carried out LES on a smooth cylinder and a cylinder with a trip. It was observed that the cylinder with a trip undergoes a two-step drag crisis, whereas, a smooth cylinder undergoes a single-step drag crisis. It was concluded that the two-step drag crisis observed in experiments is due to roughness or minor imperfections on the surface of the model.
Chopra & Mittal (Reference Chopra and Mittal2017) investigated the mechanism of drag crisis by carrying out three-dimensional numerical simulations. It was found that the flow is associated primarily with two states in the critical regime: the LSB and non-LSB states with relatively lower and higher  $C_D$, respectively. The time-averaged coefficient of drag depends on the intermittency factor of the LSB. The intermittency factor is defined as the fraction of time for which an LSB appears in the flow. Close to the onset of the critical regime the intermittency factor of LSB is low, indicating that LSB appears infrequently resulting in higher
 $C_D$. The intermittency factor of LSB increases with increase in
 $Re$, causing a corresponding decrease in
 $C_D$.
Roshko (Reference Roshko1961) and Achenbach (Reference Achenbach1968) classified the flow regimes based on the state of the boundary layer. In the subcritical regime, the boundary layer is laminar when it separates and the coefficient of drag ( $C_D$) is 1.2, approximately. This is followed by the critical regime, wherein an LSB forms and the
 $C_D$ reduces to a significantly low value of 0.3. Two sets of classification of the flow beyond the critical regime have been proposed. According to Roshko (Reference Roshko1961), the critical regime is followed by a supercritical regime. In this regime the LSB continues to exist and
 $C_D$ remains 0.3, approximately with increase in
 $Re$. This is followed by a transcritical regime, in which the LSB disappears and
 $C_D$ increases from 0.3 to 0.7 with an increase in
 $Re$. Achenbach (Reference Achenbach1968), on the other hand, proposed a slightly different nomenclature. The critical regime defined by Achenbach (Reference Achenbach1968) encompasses the critical and supercritical regimes defined by Roshko (Reference Roshko1961). This is followed by a supercritical regime where the LSB disappears, similar to the transcritical regime defined by Roshko (Reference Roshko1961). In the present study, we follow the terminology proposed by Roshko (Reference Roshko1961) for defining the various regimes. However, we adopt the methodology proposed by Schewe (Reference Schewe1983) for the classification of flow regimes based on variation of drag force (
 $F_x$) with
 $Re$. The
 $Re$ for the onset and end of the critical regime is identified via maxima and minima, respectively, in the variation of
 $F_x$ with
 $Re$. Schewe (Reference Schewe1983) showed that, unlike the classification based on
 $C_D$, the classification on the basis of
 $F_x$ is unambiguous.
The Strouhal number, the non-dimensional vortex shedding frequency, is defined as  $St={fD}/{U_{\infty }}$, where
 $f$ is the frequency of vortex shedding. It is approximately
 $0.2$ in the subcritical regime (Roshko Reference Roshko1961; Bearman Reference Bearman1969; Achenbach & Heinecke Reference Achenbach and Heinecke1981; Schewe Reference Schewe1983). Roshko (Reference Roshko1961), Bearman (Reference Bearman1969) and Szepessy & Bearman (Reference Szepessy and Bearman1992) estimated
 $St$ from the time variation of fluctuating velocity in the wake. Schewe (Reference Schewe1983) proposed that the time variation of the lift force experienced by the cylinder can be used to estimate
 $St$ when its power spectrum shows a single peak. The
 $St$ obtained from both techniques is in good agreement. Roshko (Reference Roshko1961) observed regular vortex shedding in the transcritical regime. According to Schewe (Reference Schewe1983), prior to Roshko's work it was believed that the wake is chaotic and periodic vortex shedding ceases beyond the critical regime. The
 $St$ was found to be approximately
 $0.27$ in the transcritical regime (Roshko Reference Roshko1961), larger than that in the subcritical regime. Bearman (Reference Bearman1969) and Schewe (Reference Schewe1983) reported that the
 $St$ corresponding to vortex shedding increases significantly in the critical and supercritical regimes. It experiences this increase via two jumps in correspondence with a two-step drag crisis. The first jump is from
 $0.2$ to
 $0.3$, approximately. The second jump is to a value
 $0.46$ as per Bearman (Reference Bearman1969) and to
 $0.48$ according to Schewe (Reference Schewe1983).
Szepessy & Bearman (Reference Szepessy and Bearman1992) carried out an experimental study to investigate the effect of aspect ratio ( $AR$) of the cylinder on its aerodynamic properties across the various flow regimes. The aspect ratio (
 $AR={L_z}/{D}$) is defined as the ratio of the span (
 $L_z$) of cylinder to its diameter. Moveable rectangular end plates, mounted on a cylinder with large span, were employed to vary the
 $AR$. It was found that the flow is fairly sensitive to the
 $AR$. In the subcritical regime, the root mean square (r.m.s.) of
 $C_L$ was found to be higher for small
 $AR$ as compared with that for large
 $AR$. In addition, its variation with
 $Re$, for all flow regimes, is relatively larger for cylinders with lower
 $AR$. It was also found that the r.m.s. of
 $C_L$ is sensitive to the intensity of vortex shedding and the vortex formation length. In a later study, via further experiments in the subcritical regime, Norberg (Reference Norberg2001) found that the r.m.s. of coefficient of lift (
 $C_{Lrms}$) is very low at the onset of shear layer instability and increases with increase in
 $Re$ beyond the onset. It was speculated that the decrease in vortex formation length might be responsible for the increase in
 $C_{Lrms}$ with
 $Re$. Similar to time-averaged
 $C_D$, r.m.s. of
 $C_L$ decreases with an increase in
 $Re$ in the critical regime (Schewe Reference Schewe1983; Szepessy & Bearman Reference Szepessy and Bearman1992; Cadot et al. Reference Cadot, Desai, Mittal, Saxena and Chandra2015; Rodríguez et al. Reference Rodríguez, Lehmkuhl, Chiva, Borrell and Oliva2015).
Szepessy (Reference Szepessy1993) investigated the effect of streamwise dimensions of rectangular end plates for  $4 \times 10^{3} \le Re \le 4.8 \times 10^4$. The height of the end plates was kept constant (
 $=7D$) in the experiments. A distance of
 $1.5D$ from the centre of the cylinder to the leading edge of plate and
 $3.5D$ from the trailing edge is sufficient to prevent flow disturbances from outside the plates affecting the vortex shedding on the cylinder. Plates with leading edge distance less that
 $0.6D$ lead to suppression of vortex shedding for
 $Re<1.0\times 10^4$. Horseshoe vortices form within the boundary layer on the end plates, upstream of the cylinder. However, they are weaker compared with the strength of vortices that are shed in the wake. The circulation of the largest horseshoe vortex was estimated to be approximately 10 %–20 % of that of the vortex associated with Kármán shedding. It is possible to design end plates that lead to minimal non-uniformity in spanwise pressure distribution. The leading and trailing edges for the optimal plate are located at
 $3.5D$ and
 $4.5D$, respectively, from the centre of the cylinder. The horseshoe vortices for well-designed end plates were found to have very weak influence on the vortex shedding, at least for cylinders of
 $AR$ larger than 2. Szepessy & Bearman (Reference Szepessy and Bearman1992) utilized the optimal sized end plates rectangular end plates in their experiments.
Another feature observed in the flow past a cylinder is the loss of temporal and spanwise regularity in vortex shedding in the higher  $Re$ end of subcritical regime. In their experiments to investigate the effect of
 $AR$ in the subcritical regime, Norberg (Reference Norberg1994) observed a bistable state for
 $AR<7$ wherein the flow switches between regular vortex shedding, referred to as ‘Strouhal mode’, and ‘irregular flow’. The
 $AR$ is manipulated by changing the distance between circular end plates. The vortex formation, during ‘irregular flow’ is interrupted by the axial flow moving in from the outer side of the plate due to the low pressure in the vortex formation region. The coefficient of base suction is lower in the irregular flow mode, compared with that in the regular vortex shedding mode. Szepessy & Bearman (Reference Szepessy and Bearman1992) observed bursts of weak vortex shedding in the time variation of pressure and velocity at
 $\mbox {{Re}}=1.3\times 10^5$. Similar bursts were observed in time variation of
 $C_L$ and
 $C_D$ by Schewe (Reference Schewe1983), Perrin et al. (Reference Perrin, Braza, Cid, Cazin, Chassaing, Mockett, Reimann and Thiele2008) and Desai, Mittal & Mittal (Reference Desai, Mittal and Mittal2020) in the subcritical regime. Szepessy & Bearman (Reference Szepessy and Bearman1992) found that the bursts appear when the vortex shedding is out of phase along the span of the cylinder. Szepessy (Reference Szepessy1994) reported that out of phase vortex shedding may be due to cellular structures along the span. Perrin et al. (Reference Perrin, Braza, Cid, Cazin, Chassaing, Mockett, Reimann and Thiele2008) referred to instances of weak shedding as ‘irregular shedding’ and those of strong shedding as ‘regular shedding’. They found that the vortex formation region enlarges during the irregular/weak vortex shedding.
In their direct numerical simulation of  $Re=3900$ flow past a circular cylinder, Lehmkuhl et al. (Reference Lehmkuhl, Rodríguez, Borrell and Oliva2013) observed low frequency oscillation of the region of vortex formation. The contraction is associated with large fluctuations in the shear layer and is referred to as the high energy mode. The low energy mode is during the expansion of the vortex formation region and is associated with relatively lower fluctuations in the shear layer. The LES of the
 $\mbox {{Re}}=1.3\times 10^5$ flow past a cylinder of
 $AR=9$ (Cao & Tamura Reference Cao and Tamura2015) shows that weak vortex shedding is associated with three-dimensional flow patterns which cause phase lag along the span, increase of vortex formation length, decrease in flapping of shear layers, and reduction of wake width. Szepessy & Bearman (Reference Szepessy and Bearman1992) observed that there is a correlation between
 $C_{Lrms}$ and spanwise coherence of vortex shedding. It was found that, the flow with relatively high
 $C_{Lrms}$ also has high spanwise coherence. The spanwise coherence was estimated using the two point pressure–velocity correlation coefficient. In a later study, Szepessy (Reference Szepessy1994) investigated the spanwise characteristics of vortex shedding in a high subcritical
 $\mbox {{Re}}=4.3\times 10^4$ using correlation coefficient based on two point pressure measurements.
Desai et al. (Reference Desai, Mittal and Mittal2020) carried out proper orthogonal decomposition (POD) of surface pressure measurements and two component particle image velocimetry (known as 2C PIV) data at the midspan of the cylinder. Their analysis shows that most of the energy is contained within antisymmetric and symmetric modes. The antisymmetric mode is associated with Kármán vortex shedding, while the symmetric mode is associated with expansion–contraction of vortex formation region. They found that the symmetric mode is responsible for instances of weak vortex shedding. The asymmetric mode is the dominant mode in the lower subcritical regime, but its energy content decreases with an increase in  $\mbox {{Re}}$. On the other hand, the energy content of the symmetric mode increases, with an increase in
 $\mbox {{Re}}$. The symmetric mode becomes the dominant mode beyond
 $\mbox {{Re}}=3.0\times 10^5$, and the vortex formation length increases with an increase in
 $Re$ causing
 $C_{Lrms}$ to decrease in the high subcritical regime.
We investigate the flow past a circular cylinder for  $2 \times 10^3 \le Re \le 4 \times 10^5$ spanning the subcritical, critical and supercritical regimes via LES. Cylinders of short span lengths,
 $L_z=1D$ and
 $3D$, are considered. The confinement effect of the end walls on the flow as well as the effect on it of the boundary layer on the end plates is studied. Results are compared with the available data from earlier experimental and numerical studies. The flow regimes are classified based on the nomenclature proposed by Roshko (Reference Roshko1961). The procedure adopted for the classification was originally proposed by Schewe (Reference Schewe1983) using force data from the laboratory measurements. We extend the method for application to non-dimensional data. The very significant effect of span length on the critical
 $Re$ for onset of drag crisis is demonstrated by using the results from present and earlier studies. Critical flow features like the SV and LSB are identified and their evolution with
 $Re$ is explored. The POD of the surface pressure data is utilized to identify the significant modes. The evolution of vortex shedding with
 $Re$ with respect to its strength and spanwise coherence is investigated. A triple decomposition of the pressure signal is utilized to filter out the contribution due to vortex shedding. This is used to estimate the correlation along the span, for various
 $Re$. The variation of vortex formation length (
 $L_f$) and local kinetic energy in the wake, with
 $Re$, is studied. In particular, the present study attempts to address the following questions.
(i) What is the extent of various flow regimes for a cylinder of small
 $AR$, compared with that of a large one?
(ii) How do LSB, SV and the related transition of the boundary layer evolve with increase in
$Re$?(iii) How does the peak suction and its location on the surface of the cylinder vary with
$Re$?(iv) How does vortex shedding change with an increase in
$Re$ in terms of its strength, regularity and spanwise correlation?(v) Do the antisymmetric and symmetric modes exist for low
$AR$? If yes, how do their contributions vary with $Re$?


2. Computational details
2.1. The governing equations
The equations governing the incompressible flow are
 \begin{gather} \left(\frac{\partial \boldsymbol{u}}{\partial t}+\boldsymbol{u} \boldsymbol{\cdot} \boldsymbol{\nabla} \boldsymbol{u} \right) - \boldsymbol{\nabla} \boldsymbol{\cdot} {\boldsymbol \sigma} = \boldsymbol{0}\quad \textrm{on}\ {\boldsymbol\varOmega} \times (0,t), \end{gather}
 \begin{gather}\boldsymbol{\nabla}\boldsymbol{\cdot}\boldsymbol{u} = 0 \quad \textrm{on}\ {\boldsymbol\varOmega} \times (0,t). \end{gather}
Here,  $\rho$ is the density of the fluid,
 $\boldsymbol {u}$ is the velocity vector and
 ${\boldsymbol \sigma }$ is the stress tensor. For a Newtonian fluid, the stress tensor is defined as
 \begin{equation} {\boldsymbol \sigma}={-}p \boldsymbol{I}+2\mu {\boldsymbol \epsilon} (\boldsymbol{u}), \end{equation}
where  $p$ is the pressure,
 $\mu$ is the coefficient of viscosity of the fluid and
 $\boldsymbol \epsilon$ is the strain rate defined as
 ${\boldsymbol \epsilon }=\frac {1}{2}((\boldsymbol {\nabla } \boldsymbol {u})+(\boldsymbol {\nabla }\boldsymbol {u})^\textrm {T})$.
Large eddy simulation, in conjunction with grids that have fine spatial resolution near the surface of the cylinder, is carried out to model the flows at moderate to large  $\mbox {{Re}}$. The sigma turbulence model (Nicoud et al. Reference Nicoud, Toda, Cabrit, Bose and Lee2011) is utilized to account for the subgrid scales in the flow. As per this model, the eddy viscosity is defined as
 $\mu _{SGS}=(C_m \varDelta )^2({\varPi _3(\varPi _1-\varPi _2)(\varPi _2-\varPi _3)}/{\varPi ^2_1})$. Here,
 $C_m$ is the model constant and its value, as proposed by Nicoud et al. (Reference Nicoud, Toda, Cabrit, Bose and Lee2011), is
 $1.35$. Additionally,
 $\varDelta$ is the subgrid characteristic length scale and
 $\varPi _1,\varPi _2,\varPi _3$ are the singular values of the velocity gradient tensor. Similar to that by Johari & Stein (Reference Johari and Stein2002), the model is implemented by modifying the coefficient of viscosity in (2.3). The coefficient of molecular viscosity is augmented with the eddy viscosity, i.e.
 $\mu$ is replaced with
 $\mu + \mu _{SGS}$.
2.2. The finite element formulation
A stabilized finite element formulation (Tezduyar et al. Reference Tezduyar, Mittal, Ray and Shih1992) is utilized to discretize the flow equations. The streamline-upwind/Petrov–Galerkin (known as SUPG) and pressure-stabilizing/Petrov–Galerkin (known as PSPG) (Tezduyar et al. Reference Tezduyar, Mittal, Ray and Shih1992) method is employed to stabilize the computations against possible numerical oscillations. Six-noded wedge elements, with equal-order interpolation for velocity and pressure, are used for spatial discretization. The second-order accurate-in-time, Crank–Nicholson scheme, is employed for time integration. The algebraic equation systems resulting from the finite-element discretization of the flow equations are solved using the matrix-free generalized minimal residual (known as GMRES) technique (Saad & Schultz Reference Saad and Schultz1986) in conjunction with diagonal preconditioners. The formulation is implemented on a distributed memory parallel system. Message passing interface (known as MPI) libraries have been used for interprocessor communication. For more details regarding the parallel implementation, the interested reader may refer to the work by Behara & Mittal (Reference Behara and Mittal2009). The same computational set-up has been successfully applied to solve various flow problems in past (Tezduyar et al. Reference Tezduyar, Mittal, Ray and Shih1992; Singh & Mittal Reference Singh and Mittal2005; Chopra & Mittal Reference Chopra and Mittal2017).
2.3. POD
Proper orthogonal decomposition of the pressure on the surface of the cylinder is utilized to identify the coherent structures in the flow. Proper orthogonal decomposition is a mathematical tool that extracts the coherent and energetically important structures from the snapshots of an unsteady phenomenon (Berkooz, Holmes & Lumley Reference Berkooz, Holmes and Lumley1993; Taira et al. Reference Taira, Brunton, Dawson, Rowley, Colonius, McKeon, Schmidt, Gordeyev, Theofilis and Ukeiley2017). In the present work, POD of the coefficient of pressure on the surface of the cylinder ( ${C}_P(\theta,t)$) is carried out. Here,
 $\theta$ is the azimuthal angle of a point on the surface of the cylinder. With the application of POD, the fluctuating surface pressure data can be represented as
 \begin{equation} {C}_P(\theta,t)=\bar{C}_P(\theta) + \sum_{k=1}^{M} a_k(t)\varPhi_k(\theta). \end{equation}
Here,  $\bar {C}_P(\theta )$ is the time-averaged coefficient of surface pressure and
 $M$ is the number of snapshots that are used for carrying out the POD. Additionally,
 $\varPhi _k(\theta )$ are the optimal spatial basis functions or modes and
 $a_k(t)$ are the corresponding expansion coefficients. The eigenfunctions or modes and their respective energies are obtained by performing singular value decomposition (known as SVD) of the covariance matrix (Chatterjee Reference Chatterjee2000; Taira et al. Reference Taira, Brunton, Dawson, Rowley, Colonius, McKeon, Schmidt, Gordeyev, Theofilis and Ukeiley2017). The modes are arranged in order of decreasing singular values. The singular values are square of eigenvalues and represent the energy associated with each mode.
2.4. Problem set-up
Figure 1 shows a schematic of the problem set-up. A cylinder, of diameter  $D$, spans the entire computational domain along the
 $z$-axis. The streamwise and cross-stream extent of the computational domain is
 $L_x=38D$ and
 $L_y=16D$, respectively. First, computations are carried out for
 $Re=3900$ to compare the present results with those from earlier studies. The span length for this case is identical to that used in the earlier studies (
 $L_z={\rm \pi} D$). The main computations are carried out for
 $2 \times 10^3 \le \mbox {{Re}} \le 4 \times 10^5$ and span lengths
 $L_z=1D$ and
 $3D$.
Flow past a circular cylinder: schematic of the computational domain and the boundary conditions.

We now describe the boundary conditions used in the present study. They are marked in figure 1. Uniform flow is prescribed on the inlet boundary. The stress vector at the outflow boundary, is specified to be zero. The ‘slip wall’ condition is assigned on the upper, lower and lateral boundaries; the velocity component normal to and the components of stress vector along the boundary are prescribed zero value. The no-slip condition on the velocity is applied on the cylinder surface. To simulate the conditions in the experiments, computations have also been carried out for cylinder with end plates. The end plates shown via the shaded surface in figure 1 are modelled by specifying a no-slip boundary condition on the velocity. The dimensions of end plates are identical to those used by Szepessy & Bearman (Reference Szepessy and Bearman1992) and Szepessy (Reference Szepessy1993) in experiments. The width,  $L_{px}$, of the end plate is
 $8D$, and their height,
 $L_{py}$, is
 $7D$. The leading- and trailing-edge of the plate is located at
 $3.5D$ and
 $4.5D$, respectively, from the centre of the cylinder. All results are expressed in terms of non-dimensional time. It has been non-dimensionalized with
 $D/U_\infty$. Time integration of the flow equations is carried out for longer duration for those
 $Re$, typically in subcritical regime, wherein the time variation of flow shows low frequency modulation owing to the expansion–contraction of the vortex formation region. Data for at least
 $60$ non-dimensional time units have been used to estimate the time-average and r.m.s. of various quantities presented in this work. The variation in the statistics by including data for only half the time duration is found to be less than
 $2\,\%$.
2.5. The finite element mesh and assessment of its adequacy
Figure 2 shows a two-dimensional section of the finite element mesh employed in the present study. It consists of 116 166 nodes and 231 484 triangular elements. It is similar to that used by Singh & Mittal (Reference Singh and Mittal2005) and Chopra & Mittal (Reference Chopra and Mittal2017). The mesh was found to be adequate to capture the boundary layer, its separation and transition of the separated shear layer and subsequently reattached boundary layer. The height of the element lying on the surface of the cylinder, normal to it, is  $5.0\times 10^{-6}D$.
Flow past a circular cylinder: two-dimensional section of finite element mesh in the  $x$–
 $y$ plane; (a) full view and (b) close-up view near the cylinder.

The number of elements along the surface of the cylinder is  $N_{\theta }=800$. The three-dimensional mesh is generated by stacking several copies of the two-dimensional mesh along the span. The element length along the span is constant and is
 $\varDelta _z=0.02D$ for both
 $L_z=1D$ and
 $L_z=3D$. With this resolution, the three-dimensional mesh for
 $L_z=1D$ consists of 5 924 466 nodes and 11 574 200 six-noded wedge elements, while that for
 $L_z=3D$ consists of 17 657 232 nodes and 34 954 084 elements.
The variation of  $y^+$ (
 $=yv^*/\nu$) corresponding to the first element height on the surface of the cylinder, for the time- and span-averaged flow for
 $Re=4.0\times 10^5$ and
 $L_z=1D$, is shown in figure 3. Here,
 $y$ is the distance of the field point from the surface of the cylinder and
 $v^*$ is the wall-friction velocity defined as
 $v^*=\sqrt {\tau _w / \rho }$, where
 $\tau _w$ is the shear stress at the wall. For reference, the skin friction coefficient,
 $C_f={\tau _w}/{\frac {1}{2}\rho U^2_{\infty }}$, for the time- and span-averaged flow is also shown. Figure 3 shows that
 $y^+$ is less than
 $0.14$, for the highest
 $Re$ considered in the present study, reflecting the adequacy of the mesh close to the surface of the cylinder. For the same flow, we estimate the Kolmogorov length scale as
 $\eta =({\nu ^3}/{\epsilon })^{{1}/{4}}$, where
 $\epsilon$ is the dissipation of the turbulent kinetic energy defined as
 $\epsilon =\nu \overline {({\partial u'_i}/{\partial x_j})({\partial u'_i}/{\partial x_j} + {\partial u'_j}/{\partial x_i} )}$. The quantities with overbar represent time-average, while those with prime denote the fluctuations with respect to the time-average. The average of the ratio of the element mesh size to
 $\eta$, on the surface of the cylinder, is found to be
 $3.15$ while it lies between
 $2.8$ and
 $40$ in the near wake (
 $x/D \le 5$).
The  $Re=4.0\times 10^5$ flow past a cylinder of
 $L_z=1D$: surface distribution of (a) skin friction coefficient; (b)
 $y^+$ corresponding to the element height of the mesh on the surface of the cylinder for the time- and span-averaged flow.

The adequacy of the spatial resolution of the finite element mesh, to resolve the flow structures, is checked by carrying out computations on meshes with enhanced resolution along the span and circumference of the cylinder. The study is presented in Appendix A. Section A.1 of Appendix A compares the results for  $Re=3.0\times 10^5$ with meshes corresponding to
 $N_{\theta }=800$ and
 $1600$. The spanwise and radial resolution is identical for the two meshes. This
 $Re$ lies in the supercritical regime and the flow exhibits both LSB and SV. The aerodynamic coefficients as well as the circumferential extent of the LSB and SV, from the two meshes, are in very good agreement.
The study related to the effect of spanwise resolution of the mesh is presented in § A.2 of Appendix A. Two meshes, with identical two-dimensional sections, with spanwise resolution corresponding to  $\varDelta _z=0.01D$ and
 $0.02D$ are considered for
 $L_z=1D$. Computations are carried out at three representative
 $Re$ that lie in the subcritical, critical and supercritical flow regime. The results from both meshes, for all three
 $Re$, are in good agreement. Based on the results from the convergence study, all computations with slip condition on velocity at the end walls are carried out with the mesh with
 $N_{\theta }=800$. Further validation of the mesh and the finite element implementation of the method are presented in Appendix B.
The mesh used for the computation of flow with end plates is described in Appendix C along with the details of the horseshoe vortices observed in the boundary layer on the end plates. A time step size  ${\rm \Delta} t=5 \times 10^{-4}$ is used for computations in the subcritical and critical regimes. To adequately resolve the time evolution of the flow structures, progressively smaller time step is utilized with increase in
 $Re$ beyond the critical regime. For example, the time step used for computations at
 $Re=3 \times 10^5$ is
 ${\rm \Delta} t = 1.25 \times 10^{-4}$ while it is
 ${\rm \Delta} t = 5 \times 10^{-5}$ at
 $Re=4 \times 10^5$. The effect of
 ${\rm \Delta} t$ on the flow at
 $Re=4 \times 10^5$ is presented in Appendix A.
3. Results
3.1. The effect of the boundary layer on the end walls
The effect of the boundary layer on the end walls is investigated by carrying out computations in the high subcritical regime, with and without the end plates for  $L_z=1D$. The comparison of the time-averaged coefficient of drag (
 $\overline {C}_D$), r.m.s. of coefficient of lift (
 $C_{Lrms}$), r.m.s. of coefficient of drag (
 $C_{Drms}$) and non-dimensional vortex shedding frequency obtained from the two sets of computations is presented in table 1. It is observed that the results from the two sets of boundary conditions are in good agreement and also close to the data reported by Szepessy & Bearman (Reference Szepessy and Bearman1992). Further comparison of the flows, for
 $Re=4.0\times 10^4$, obtained from computations with the two boundary conditions are presented in figure 4.
The  $L_z=1D$,
 $Re=4.0\times 10^4$ flow past a cylinder with and without end plates at the lateral boundaries: surface distribution of time- and span-averaged (a) coefficient of pressure (
 $\overline {C}_P$) and (b) skin friction (
 $\overline {C}_f$) for slip, no-slip conditions on the end plates and no-slip conditions on the end plates but excluding the sidewall boundary layer (BL) while span averaging. Shown in panel (c) is the spanwise variation of
 $\overline {C}_P$ at the shoulder (
 $\theta =90^{\circ }$) via broken line and base of the cylinder (
 $\theta =180^{\circ }$) via solid line. Streamlines for the time- and span-averaged are shown for (d) slip wall, (e) no-slip wall and (f) no-slip wall excluding the sidewall boundary layer while span averaging.

Flow past a circular cylinder of  $L_z=1D$ with and without end plates at the lateral boundaries: time-averaged coefficient of drag (
 $\overline {C}_D$); r.m.s. of coefficient of lift (
 $C_{Lrms}$) and non-dimensional vortex shedding frequency (
 $St$) at
 $Re=2.0\times 10^4$ and
 $4.0\times 10^4$. The abbreviation ‘S & B’ stands for Szepessy & Bearman (Reference Szepessy and Bearman1992); BC denotes boundary condition.

Two sets of results for a cylinder with no-slip sidewalls are shown in the figure. In the first set of results, referred to as ‘no-slip wall’, the flow is averaged over the entire span. Results are also shown for span averaging that excludes the regions corresponding to boundary layers on the sidewalls. This is referred to as ‘no-slip wall excluding sidewall boundary layer’. The time- and span-averaged streamlines as well as surface distribution of the coefficients of pressure ( $\overline {C}_P$) and skin friction (
 $\overline {C}_f$) for all the cases are in very good agreement. The time- and span-averaged streamlines as well as surface distribution of the coefficients of pressure (
 $\overline {C}_P$) and skin friction (
 $\overline {C}_f$) for all the cases are in very good agreement. The spanwise variation of time-averaged coefficient of pressure at shoulder (
 $\theta =90^{\circ }$) and base point (
 $\theta =180^{\circ }$), plotted in figure 4(c), confirms that the changes to the flow caused by the boundary layer on the end walls are very local and have little effect on the bulk of the flow. The displacement thickness (
 $\delta _1$) due to the boundary layer on the end wall at
 $(x/D, y/D)=(0, 3)$, estimated from the time-averaged velocity profile, is
 $0.0151 D$. This shows that the combined viscous region of the two end plates, for this
 $Re$, is restricted to a mere
 $3\,\%$ of the span which is expected to become even smaller for larger
 $Re$. For this reason, computations at larger
 $Re$ are carried out with slip boundary conditions on the lateral walls. The confinement effect of the lateral walls in restricting three-dimensionality of the flow will be investigated in a later section.
3.2. Time-averaged drag: variation with Re and classification of regimes
Figure 5 shows the variation of time-averaged coefficient of drag ( $\overline {C}_D$) with
 $Re$ for cylinder with span lengths,
 $L_z=1D$ and
 $3D$. Also shown is the data from earlier studies for various
 $L_z$. To enable further discussion, we first identify the various flow regimes. Achenbach (Reference Achenbach1968) classified the flow regimes based on variation of time-averaged coefficient of drag (
 $\overline {C}_D$) with
 $Re$. Later, Schewe (Reference Schewe1983) showed that the classification is unambiguous if carried out on the basis of the variation of drag force (
 $F_x$) with
 $Re$. The maxima and minima of
 $F_x$, respectively, correspond to the onset and end of the critical regime. We utilize the method proposed by Schewe (Reference Schewe1983). We recall that the mean drag force is related to the time-averaged coefficient of drag as
 $\overline {F}_x=\frac {1}{2} \rho U^2_{\infty } L_z D \overline {C}_D$. This expression may be rewritten, in terms of
 $Re$, as
 $\overline {F}_x=Q\overline {C}_D Re^2$, where,
 $Q={\mu ^2 L_z}/{2 \rho D}$. Here,
 $Q$ is a constant for a given physical model and fluid. Therefore, the variation of
 $\overline {F}_x$ can be studied via the variation of
 $\overline {C}_D Re^2$ and used for classifying the flow regimes.
Flow past a circular cylinder: variation of time-averaged coefficient of drag ( $\overline {C}_D$) with Reynolds number. The abbreviations are: EP, cylinder with side end plates; S & B, Szepessy & Bearman (Reference Szepessy and Bearman1992); S, Schewe (Reference Schewe1983); A, Achenbach (Reference Achenbach1968); L, Lehmkuhl et al. (Reference Lehmkuhl, Rodríguez, Borrell, Chiva and Oliva2014); C, Cheng et al. (Reference Cheng, Pullin, Samtaney, Zhang and Gao2017); B, Bearman (Reference Bearman1969) and D: Desai et al. (Reference Desai, Mittal and Mittal2020).

The onset of transition of boundary layer causes a reduction in drag with an increase in  $Re$, while its increase with a further increase in
 $Re$ marks the end of the transition.
We test the proposed scheme by applying it to the data from Schewe (Reference Schewe1983) for  $\overline {F}_x$ and
 $\overline {C}_D$. Figure 6(a) shows the variation of
 $F_x$ and
 $\overline {C}_D Re^2$ with
 $Re$ for the data reported by Schewe (Reference Schewe1983). Both variables show similar variation with
 $Re$, including the location of local maxima and minima. This confirms that
 $\overline {C}_D Re^2$ can indeed be used as a proxy for
 $\overline {F}_x$ for classifying the flow regime. Figure 6(b) shows the variation of
 $\overline {C}_D$ and
 $\overline {C}_D Re^2$ with
 $Re$ for the data from the present computations for
 $L_z=1D$. The flow regimes, namely subcritical, critical and supercritical are marked in the figure. It can be observed that
 $\overline {C}_D Re^2$ achieves a local maxima at
 $Re=1 \times 10^5$. This marks the onset of the critical regime. In the critical regime both
 $\overline {C}_D$ and
 $\overline {C}_D Re^2$ decrease with an increase in
 $Re$. A local minima of
 $\overline {C}_D Re^2$ at
 $Re=1.5\times 10^5$ marks the end of critical regime. In the supercritical regime,
 $\overline {C}_D$ continues to decrease with
 $Re$;
 $\overline {C}_D Re^2$, however, increases with increase in
 $Re$.
Flow past a circular cylinder: (a) the variation of time-averaged drag force  $\overline {F}_x$ and
 $\overline {C}_D Re^2$ with
 $Re$ for the data from Schewe (Reference Schewe1983) for cylinder with
 $L_z=10D$ and (b) the variation of time-averaged coefficient of drag (
 $\overline {C}_D$) and
 $\overline {C}_D Re^2$ with Reynolds number from present numerical simulations on cylinder with
 $L_z=1D$.

We note from figure 5 that the variation of  $\overline {C}_D$ with
 $Re$, from the present study, for
 $L_z=1D$ is in good agreement with the experimental results of Szepessy & Bearman (Reference Szepessy and Bearman1992). It is also in good agreement with the computational results of Cheng et al. (Reference Cheng, Pullin, Samtaney, Zhang and Gao2017) in the subcritical regime. Their computations were carried out for
 $L_z=3D$ in the subcritical regime and
 $L_z=1D$ at higher
 $Re$. We note that the variation in
 $\overline {C}_D$ with
 $Re$, from the present study, is very similar for
 $L_z=1D$ and
 $3D$.
In addition, the boundary layer on the end plates does not have any significant effect on  $\overline {C}_D$. In the supercritical regime, at
 $Re=4.0\times 10^5$, the
 $\overline {C}_D$ from present computation is very close to that from Schewe (Reference Schewe1983) and Bearman (Reference Bearman1969). Schewe (Reference Schewe1983) reported that the onset of drag crisis takes place at
 $Re_c\approx 2.8\times 10^5$ for a cylinder with
 $L_z=10D$. Desai et al. (Reference Desai, Mittal and Mittal2020) carried out experiments on cylinder of
 $L_z=22.5D$ and observed that
 $Re_c$ is
 $3.3\times 10^5$. Experiments by Achenbach (Reference Achenbach1968) were carried out on cylinders with
 $L_z=3.3D$ and
 $6.6D$. The drag crisis in their study was observed to be more gradual compared with other studies including the present one. The
 $Re_c$ was not reported in computational studies by Cheng et al. (Reference Cheng, Pullin, Samtaney, Zhang and Gao2017) and Lehmkuhl et al. (Reference Lehmkuhl, Rodríguez, Borrell, Chiva and Oliva2014). This figure clearly brings out the effect of span length of the cylinder on the
 $Re_c$. Also,
 $Re_c$ is relatively larger for cylinders of large span. It varies between
 $2.8\times 10^5\text {--}3.3\times 10^5$ for
 $10D \leq L_z \leq 22.5D$. On the other hand, it is relatively low for shorter span lengths. Figure 5 shows that
 $Re_c$ is approximately
 $1\times 10^5$ for
 $1D \leq L_z \leq 3D$.
3.3. Root mean square of force coefficients versus $Re$ and effect of span length ($L_z$)


Other quantities that are sensitive to the span length of the cylinder are the r.m.s. of the coefficient of lift ( $C_{Lrms}$) and drag (
 $C_{Drms}$). The variation of
 $C_{Lrms}$ and
 $C_{Drms}$ with
 $Re$ for various
 $L_z$ are shown in figure 7. Their trend is similar to the variation of
 $\overline {C}_D$ with
 $Re$, shown in figure 5. In general, both
 $C_{Lrms}$ and
 $C_{Drms}$ increase with an increase in
 $Re$ in the subcritical regime and achieve a maxima prior to the flow entering the critical regime. The peak value of
 $C_{Lrms}$ and
 $C_{Drms}$ decreases with an increase in span length of the cylinder. The overall variation of
 $C_{Lrms}$ with
 $Re$, for the present study with
 $L_z=1D$, is in very good agreement with the data reported by Szepessy & Bearman (Reference Szepessy and Bearman1992).
Flow past a circular cylinder: variation of r.m.s. of coefficient of (a) lift ( $C_{Lrms}$) and (b) drag (
 $C_{Drms}$) with Reynolds number. The abbreviations are: EP, cylinder with end plates; S & B, Szepessy & Bearman (Reference Szepessy and Bearman1992); K, Keefe (Reference Keefe1962); F, Fung (Reference Fung1960); S, Schewe (Reference Schewe1983); R, Rodríguez et al. (Reference Rodríguez, Lehmkuhl, Chiva, Borrell and Oliva2015); D, Desai et al. (Reference Desai, Mittal and Mittal2020).

The boundary layer on the end plate does not appear to have any significant effect on either  $C_{Lrms}$ or
 $C_{Drms}$. The peak value, as well as the
 $Re_c$ where
 $C_{Lrms}$ experiences a steep decrease with increase in
 $Re$, show good match. Furthermore,
 $C_{Lrms}$ and
 $C_{Drms}$ decrease sharply with an increase in
 $Re$ in the critical regime. In the supercritical regime, they undergo a gradual decrease up to
 $\mbox {{Re}}=3.0\times 10^5$ followed by an increase with further increase in
 $\mbox {{Re}}$. A similar increase in the supercritical regime was also observed in experimental studies by Fung (Reference Fung1960), Schewe (Reference Schewe1983) and Desai et al. (Reference Desai, Mittal and Mittal2020). Keefe (Reference Keefe1962) reported data for the variation of
 $C_{Lrms}$ with
 $Re$ in the subcritical regime for
 $L_z=3D$. The results from the present study are in very good agreement with this data. The very significant effect of
 $L_z$ on variation of
 $C_{Lrms}$ with
 $Re$ is clearly seen from figure 7. For example, for
 $L_z=1D$, the flow becomes critical at
 $Re\approx 1 \times 10^5$ beyond which
 $C_{Lrms}$ decreases sharply (present results and Szepessy & Bearman Reference Szepessy and Bearman1992). It becomes critical at
 $Re\approx 1.4\times 10^5$ for
 $L_z\approx 6D$ (Fung Reference Fung1960; Szepessy & Bearman Reference Szepessy and Bearman1992), and at
 $Re \approx 2.8\times 10^5$ (Schewe Reference Schewe1983) for
 $L_z=10D$. Szepessy & Bearman (Reference Szepessy and Bearman1992) and Cadot et al. (Reference Cadot, Desai, Mittal, Saxena and Chandra2015) proposed that the drop in
 $C_{Lrms}$ in the critical regime is due to weakening of vortex shedding. This and the very interesting variation of
 $\overline {C}_D$ and
 $C_{Lrms}$ with
 $Re$ in the subcritical regime is explored, in a later section in this work.
To investigate the effect of span length, we consider the flow at  $Re=0.5\times 10^5$ for
 $L_z=1D$ and
 $3D$. Figure 8(a,b) shows
 $\overline {ww}$ on
 $x$–
 $z$ plane at
 $y=0.05D$ for
 $L_z=1D$ using slip and no-slip boundary conditions on the plate. The same for
 $L_z=3D$, and with slip boundary conditions on the end walls, is shown in figure 8(c). The
 $\overline {ww}$ field is a measure of three-dimensionality in the flow. We utilize it to study the confinement effect of the lateral walls. It is observed that the three-dimensionality in the flow is significantly higher for
 $L_z=3D$, compared with
 $L_z=1D$. On the other hand, the boundary layer on the end plates do not appear to have a significant effect on the three dimensionality as indicated by the images for
 $L_z=1D$. In fact, as seen in § 3.1, they do not have any significant effect on the flow. This is further confirmed by the span-averaged,
 $\overline {u'u'}$ component of the Reynolds stress on the
 $x$–
 $y$ plane shown in figure 8(d,e). The same for
 $L_z=3D$, in figure 8(f) shows relatively lower stress in the near wake, indicating lower level of activity related to the instability of the shear layer, compared with
 $L_z=1D$. The confinement of the flow by closing in of lateral walls, therefore, leads to formation of LSB at lower
 $Re$ and early onset of transition. We also note that, as observed by Kravchenko & Moin (Reference Kravchenko and Moin2000), periodic boundary conditions on the lateral walls are not suitable for studying the effect of
 $AR$ of the cylinder on the flow. Perhaps this explains the prediction of delayed transition in the computational studies of Cheng et al. (Reference Cheng, Pullin, Samtaney, Zhang and Gao2017), Rodríguez et al. (Reference Rodríguez, Lehmkuhl, Chiva, Borrell and Oliva2015) and Lehmkuhl et al. (Reference Lehmkuhl, Rodríguez, Borrell, Chiva and Oliva2014) who employ a relatively short span but impose periodic conditions on the lateral boundaries.
Flow past a  $Re=0.5\times 10^5$ circular cylinder: (a–c)
 $\overline {ww}$ in the
 $x$–
 $z$ plane at
 $y/D=0.05$ and (d–f) span-averaged
 $\overline {u'u'}$ in the
 $x$–
 $y$ plane where panels (a,d) are for a cylinder with
 $L_z=1D$ and slip condition on lateral boundaries, panels (b,e) are for
 $L_z=1D$ and no-slip condition on the end plates and panels (c,f) are for
 $L_z=3D$ and with slip condition on lateral boundaries.

3.4. SV and LSB
Figure 9 shows the time- and span-averaged streamlines for various  $Re$. Following the separation of flow, a pair of counter-rotating standing vortices form the wake separation bubble, which is observed at all
 $Re$. In addition, a smaller region of recirculation appears downstream of the separation point for
 $Re>0.05\times 10^5$. It can be clearly seen in figure 9(b,c) for
 $Re=0.2\times 10^5$ and
 $Re=0.4\times 10^5$. In fact this bubble continues to exist in the critical and supercritical regimes but in a modified form. Son & Hanratty (Reference Son and Hanratty1969) also observed such a circulation region in the subcritical regime and referred to it as an SV. For consistency, we use the same nomenclature. Cheng et al. (Reference Cheng, Pullin, Samtaney, Zhang and Gao2017) also observed the secondary vortex but only in the subcritical regime. In contrast, Ono & Tamura (Reference Ono and Tamura2008) observed the SV even in the supercritical regime.
Flow past a circular cylinder with  $L_z=1D$: time- and span-averaged streamlines for (a)
 $Re=0.02\times 10^5$, (b)
 $Re=0.2\times 10^5$, (c)
 $Re=0.4\times 10^5$, (d)
 $Re=1.4\times 10^5$, (e)
 $Re=3.0\times 10^5$, and (f)
 $Re=3.5\times 10^5$. The insets shows the close-up views of the flow to bring out the SV and LSB.

An LSB appears in the flow for  $Re\geq 1.2\times 10^5$ as shown in figure 9(d,f) for certain
 $Re$. The presence of LSB and its role in the transition of the flow has been reported in several earlier studies (Achenbach Reference Achenbach1968; Singh & Mittal Reference Singh and Mittal2005; Lehmkuhl et al. Reference Lehmkuhl, Rodríguez, Borrell, Chiva and Oliva2014; Cheng et al. Reference Cheng, Pullin, Samtaney, Zhang and Gao2017; Chopra & Mittal Reference Chopra and Mittal2017; Pandi & Mittal Reference Pandi and Mittal2019). We identify the separation and attachment points associated with the SV and LSB via the variation of the time- and span-averaged surface skin friction distribution (
 $\overline {C}_f$) along the surface of the cylinder;
 $\overline {C}_f$ changes sign at these points. Based on the presence of SV and LSB, the flow can be broadly classified in three regimes. A representative flow in each of the three regimes is shown in figure 10 along with the surface distribution of
 $\overline {C}_P$ and
 $\overline {C}_f$.
Flow past a circular cylinder with  $L_z=1D$: the left-hand column of the figure shows the close-up view of the time- and span-averaged streamlines near the upper shoulder of the cylinder and the right-hand column shows the time- and span-averaged coefficient of pressure and skin friction distribution of the upper surface of cylinder (
 $0\leq \theta \leq 180$) for
 $Re=$ (a)
 $0.02\times 10^5$, (b)
 $0.2\times 10^5$, and (c)
 $4.0\times 10^5$. The close-up view of the upper shoulder to enlarge the SV and LSB for
 $Re=4.0\times 10^5$ is shown in panel (d). The LS, secondary attachment (SA), secondary separation (SS), turbulent attachment (TA) and turbulent separation (TS) points are also shown in the figure.

In the first of the three regimes, the boundary layer is in a laminar state when it separates and does not reattach. The SV is also not observed in this case. This state is observed for  $Re\leq 2\times 10^3$. A schematic of the flow in this regime is shown in figure 11(a). The acronym LS in the figure refers to the separation of the laminar boundary layer. An SV appears in the second regime. The flow, however, is devoid of the LSB. The flow exhibits this state for
 $5\times 10^3 \leq Re \leq 1\times 10^5$. The end of this regime marks the end of the subcritical regime. Figure 10(b) shows an example of the flow in this regime for
 $Re=2\times 10^4$. The SV is located downstream of the separation point of the laminar boundary layer. It is attached to the surface of the cylinder and embedded inside the wake separation bubble. The extent of SV can be identified by the region of positive
 $\overline {C}_f$ downstream of LS point. A schematic of the flow for this state is shown in figure 11(b). We refer to the separation and attachment points of the SV as SS and SA points, respectively. The direction of streamlines in the SV is opposite to those in the wake separation bubble. As a result, as shown in figure 11(b), SS is to the right of SA.
Flow past a circular cylinder with  $L_z=1D$: schematic of time- and span-averaged streamlines to show various flows observed in present study. (a) Laminar separation of boundary layer without TA; neither SV nor LSB is observed. Panel (b) shows LS without TA; SV is observed downstream of LS. Panel (c) shows LS with TA; both SV and LSB are observed. Panel (d) shows the variation of time- and span-averaged LS, SA, SS, TA and TS points with
 $Re$. The regions of SV and LSB are shaded in purple and sky-black colours, respectively. The abbreviations are: C, Cheng et al. (Reference Cheng, Pullin, Samtaney, Zhang and Gao2017); A, Achenbach (Reference Achenbach1968); S & H, Son & Hanratty (Reference Son and Hanratty1969).

The formation of LSB marks the onset of third regime ( $Re\geq 1.2\times 10^5$). Figure 10(c,d) shows the flow and
 $\overline {C}_f$ for a representative flow at
 $Re=4\times 10^5$. A schematic of the same is shown in figure 11(c). Both, SV and LSB are observed in the flow. The laminar boundary layer separates downstream of the shoulder. The separated shear layer undergoes transition to turbulent state and reattaches to the surface (Singh & Mittal Reference Singh and Mittal2005) at the TA point (see figure 11c). An LSB forms between LS and TA. Compared with regime 2, which is devoid of LSB, the peak negative value in the
 $\overline {C}_f$ is relatively large in regime 3. This variation of
 $\overline {C}_f$ can be used to check the existence of LSB in the flow. The turbulent boundary layer separates farther downstream at the TS point. As seen from figures 9(c,d) and 10(c), LSB is much larger than SV. In fact, SV is embedded inside the LSB. The size of SV and LSB have been exaggerated in the schematic, shown in figure 11(c), to bring out this feature.
Figure 11 shows the variation of LS, SS, SA, TA and TS points with  $Re$. These points are identified from the variation of
 $\overline {C}_f$ on the surface the cylinder. We note from the figure that TA and TS are very close to each other for
 $1.2\times 10^5\leq Re\leq 2.5\times 10^5$. Therefore, time- and span-averaged streamlines, and not the surface distribution of
 $\overline {C}_f$, are utilized to identify TA and TS for this range of
 $Re$. Also shown in the figure are the results from earlier studies. The region on the surface of the cylinder occupied by SV and LSB are marked in purple and black colour, respectively. In the subcritical regime, the circumferential extent of the SV first increases with increase in
 $Re$ for
 $5\times 10^3\leq Re \leq 4\times 10^4$ and then decreases. The SV is much smaller in the critical and supercritical regimes, compared with that in subcritical regime. Its circumferential extent decreases slightly with increase in
 $Re$ in the critical and supercritical regimes. The circumferential extent of the LSB, decreases with increase in
 $Re$. This is consistent with observations made by Roshko (Reference Roshko1961) and Lehmkuhl et al. (Reference Lehmkuhl, Rodríguez, Borrell, Chiva and Oliva2014). The point of TS moves downstream with increase in
 $Re$. The location of TS from the present computations is in good agreement with those from Achenbach (Reference Achenbach1968).
Figure 12 shows the time- and span-averaged distribution of  $\overline {C}_P$ for various
 $Re$ on the surface of cylinder with
 $L_z=1D$.
The signature of LSB and SV in the
 $\overline {C}_P$ distribution is very interesting. Past studies have shown that LSB leads to a plateau in the
 $\overline {C}_P$ distribution (Achenbach Reference Achenbach1968; Lehmkuhl et al. Reference Lehmkuhl, Rodríguez, Borrell, Chiva and Oliva2014; Cheng et al. Reference Cheng, Pullin, Samtaney, Zhang and Gao2017; Chopra & Mittal Reference Chopra and Mittal2017). Figure 12 shows that the plateau is followed by a sharp dip in
 $\overline {C}_P$ and recovery, resembling a ‘kink’. Figure 10(c) shows a close-up of the same along with the structure of the flow. The ‘kink’ in the
 $\overline {C}_P$ distribution is between the points of SS and SA, and can therefore be attributed to the SV. Ono & Tamura (Reference Ono and Tamura2008) reported that the SV and LSB coexist in the supercritical regime. Although not pointed out by them, a ‘kink’ can be observed in their plot as well for the surface
 $\overline {C}_P$ distribution. Recently, Eljack et al. (Reference Eljack, Soria, Elawad and Ohtake2021) observed SV and LSB together in flow past a NACA 0012 airfoil at
 $Re=5\times 10^4$ and
 $9\times 10^4$. Although not pointed out by them, a kink can be seen in their plots as well for the surface
 $\overline {C}_P$ distribution. On the other hand, Pandi & Mittal (Reference Pandi and Mittal2019) reported an LSB, without the SV, on an Eppler 61 airfoil for
 $Re$ beyond
 $Re=2\times 10^4$. Consistent with our findings, the plateau in
 $\overline {C}_P$ distribution due to the LSB, is devoid of the kink. For
 $Re=1.2\times 10^5$, as shown in figure 12, the LSB is observed only on top half of the cylinder. The one sided transition has also been observed in earlier studies by Schewe (Reference Schewe1983), Bearman (Reference Bearman1969), Lehmkuhl et al. (Reference Lehmkuhl, Rodríguez, Borrell, Chiva and Oliva2014), Cadot et al. (Reference Cadot, Desai, Mittal, Saxena and Chandra2015) and Chopra & Mittal (Reference Chopra and Mittal2017). We further observe that the local variations of
 $\overline {C}_P$, within the LSB are stronger in the supercritical regime compared with the critical regime. Chopra & Mittal (Reference Chopra and Mittal2017) explained this via the intermittent nature of LSB during transition. A similar behaviour was reported by Deshpande et al. (Reference Deshpande, Kanti, Desai and Mittal2017) for the LSB on a sphere. In the subcritical regime, the SV is weak and as a result it does not cause significant variation in the surface
 $\overline {C}_P$ distribution. In the critical and supercritical regimes, the kink associated with the SV in the surface
 $\overline {C}_P$ distribution becomes sharper with an increase in
 $\mbox {{Re}}$ pointing to an increase in the strength of SV despite a decrease in its circumferential extent. Although not reported here, the extent and location of SV and LSB have been compared for
 $L_z=1D$ and
 $3D$ for the flow at
 $Re=3.0\times 10^5$. They are found to be in good agreement.
Flow past a circular cylinder with  $L_z=1D$: (a) surface distribution of time- and span-averaged coefficient of pressure (
 $\overline {C}_P$) for various
 $Re$ and (b) variation of time- and span-averaged coefficient of peak suction pressure (
 $-\overline {C}_{Ppeak}$) and its location (
 $\theta _{C_{Ppeak}}$) with
 $Re$. The abbreviations are: P, present; T, Tani (Reference Tani1964); C, Cheng et al. (Reference Cheng, Pullin, Samtaney, Zhang and Gao2017); S & B, Szepessy & Bearman (Reference Szepessy and Bearman1992).

The variation of peak suction coefficient ( $-\overline {C}_{Ppeak}$) and its location on the surface of the cylinder (
 $\theta _{C_{Ppeak}}$) with
 $Re$ are shown in figure 12(b). The average of the values from the lower and upper surface of the cylinder is plotted. The peak surface suction increases with
 $\mbox {{Re}}$ up to
 $\mbox {{Re}} \sim 4 \times 10^4$ and then decreases with further increase in
 $\mbox {{Re}}$ in the subcritical regime. Its location is close to
 $70^{\circ }$ in this regime which is well upstream of the point of separation (see figure 11). The variation of
 $-\overline {C}_{Ppeak}$ with
 $\mbox {{Re}}$ correlates well with the variation of points of LS and SA as shown in figure 11. Furthermore,
 $-\overline {C}_{Ppeak}$ increases and
 $\theta _{C_{Ppeak}}$ moves downstream with an increase in
 $Re$ in the critical and supercritical regimes. The sharp increase in peak suction in the critical regime correlates well with the formation of LSB and the associated delay in the flow separation (see figure 11). Also shown in figure 12(b) is the data from earlier studies (Tani Reference Tani1964; Szepessy & Bearman Reference Szepessy and Bearman1992; Cheng et al. Reference Cheng, Pullin, Samtaney, Zhang and Gao2017). The data from the various studies are in very good agreement in the subcritical regime. We note that the study by Cheng et al. (Reference Cheng, Pullin, Samtaney, Zhang and Gao2017) predicts a much larger peak suction, and its location is closer to the shoulder of the cylinder, in the supercritical regime compared with the other studies. The results from the present study are in good agreement with those from Tani (Reference Tani1964). The diagnostics on the velocity field that demonstrate the transition of the flow are presented in Appendix D.
3.5. The symmetric and antisymmetric modes
Figure 13 shows the space–time plot of  $C_P(\theta, t)$ at midspan for three
 $Re$. Vortex shedding appears as the periodic activity with alternating values of low and high pressure. Amongst the three
 $Re$, for which the pictures are shown, it is most prominent at
 $Re=6 \times 10^4$. We note from figure 7 that
 $C_{Lrms}$ is maximum at this
 $\mbox {{Re}}$, indicating the strongest vortex shedding in the entire range of
 $\mbox {{Re}}$ investigated in this study. Desai et al. (Reference Desai, Mittal and Mittal2020), in their laboratory experiments, observed that the flow in the high subcritical regime is associated with ‘irregular shedding’, i.e. there are random occurrences of weakened vortex shedding. The same was reported earlier by Perrin et al. (Reference Perrin, Braza, Cid, Cazin, Chassaing, Mockett, Reimann and Thiele2008) and Cao & Tamura (Reference Cao and Tamura2015). Desai et al. (Reference Desai, Mittal and Mittal2020) observed that during such instances the lift coefficient varies with smaller amplitude, and base pressure is relatively higher. It was shown that the low frequency modulation in the time histories of
 $C_L$ is related to the expansion–contraction of the vortex formation region. They identified the various modes in the flow via POD of the surface pressure data. However, their analysis is restricted to the high subcritical and critical regimes and the experiments were conducted for a cylinder of relatively large span (
 $L_z/D\sim 22$). We perform a similar analysis for a cylinder with low
 $AR$ (
 $L_z/D=1$) and extend it flow in the supercritical regime.
Flow past a circular cylinder: space–time variation of the coefficient of pressure ( $C_P(\theta,t)$) on the surface of the cylinder (left) and time variation of
 $C_P(\theta =90^{\circ },t)$ (right) at midspan for
 $Re=$ (a)
 $0.6\times 10^5$, (b)
 $1.5\times 10^5$ and (c)
 $3.5\times 10^5$. Additionally,
 $\tilde {C}_P(\theta =90^{\circ },t)$ is shown in the line plots on the right.

The right-hand panels of figure 13 show the time histories of the  $C_P$ at midspan and
 $\theta =90^{\circ }$ for three
 $Re$. They are associated with three distinct time scales. The high frequency, and somewhat random, variation (
 $C_P'$) is primarily due to the shear layer vortices while the relatively time periodic variation (
 $C_{Pv}$) is caused by the von Kármán vortex shedding. The low frequency variations (
 $\hat {C}_P$) that result in modulations in the amplitude of variations due to vortex shedding have been attributed to expansion–contraction of the vortex formation region (Desai et al. Reference Desai, Mittal and Mittal2020). It is possible to estimate these components related to disparate time scales by using appropriate filtering. Chopra & Mittal (Reference Chopra and Mittal2017) proposed a double decomposition,
 $C_P(\theta,t)=\tilde {C}_P(\theta,t)+C_P'(\theta,t)$. They estimated
 $\tilde {C}_P(\theta,t)$ via a simple procedure akin to low pass filtering. The procedure involves a moving average of
 $C_P(\theta,t))$ over a few shear layer cycles,
 $\tilde {C}_P(\theta,t)=({1}/{T})\int _{t-T/2}^{t+T/2} C_P(\theta,t)\,\mathrm {d}t$. They utilized a window size of
 $T=T_k/10$ for the averaging, where
 $T_k$ is the time period of the von Kármán vortex shedding. We utilize the same procedure in the present work. In addition to
 $C_P(\theta =90^{\circ },t)$ at midspan, figure 13 also shows
 $\tilde {C}_P(\theta =90^{\circ },t)$. The difference of the two may be utilized to estimate
 $C_P'(\theta =90^{\circ },t)$.
Proper orthogonal decomposition of the coefficient of pressure at the surface of the cylinder is carried out at various  $\mbox {{Re}}$, to identify the coherent flow structures. We are primarily interested in flow features related to vortex shedding and expansion–contraction of the recirculation bubble (Desai et al. Reference Desai, Mittal and Mittal2020). Therefore, we conduct POD on the span-averaged
 $\tilde {C}_P(\theta,t)$. Now 15 000–25 000 snapshots during approximately
 $60$ non-dimensional time units, for the fully developed unsteady flow, are used to carry out the analysis at each
 $\mbox {{Re}}$. To reduce the computational effort, not all grid points on the surface of the cylinder are used; rather every fourth point is chosen. Therefore, the spanwise-averaged data corresponding to only
 $200$, of the
 $800$, points of
 $\tilde {C}_P(\theta,t)$ on the surface of the cylinder is used for the POD analysis.
Figure 14 shows the results from the POD analysis of the surface  $\tilde {C}_P(\theta,t)$ for
 $\mbox {{Re}}=0.6\times 10^5$. The percentage energy content of the first 10 modes and the eigenmodes corresponding to the first four modes are shown in the figure. We note that the first two modes account for nearly
 $94\,\%$ of the energy. The most dominant modes is antisymmetric with respect to
 $\theta =0^{\circ }$ and contains
 $87\,\%$ of the energy; we refer to this mode as
 $AS_1$, where
 $AS$ points to its antisymmetric nature. It corresponds to the von Kármán vortex shedding. The second mode is symmetric about the wake axis and contains approximately
 $7\,\%$ of the energy. We refer to it as mode-
 $S_1$. Desai et al. (Reference Desai, Mittal and Mittal2020) showed that while the non-dimensional time frequency associated with mode-
 $AS_1$ is
 $0.2$ approximately and corresponds to the Strouhal number of von Kármán vortex shedding, mode-
 $S_1$ has a much lower frequency. They further showed that mode-
 $S_1$ is associated with expansion–contraction of vortex formation region. With its low frequency variation, it is responsible for amplitude modulations in time history of pressure, and force coefficients. Figure 14 shows that modes 3 and 4 have relatively low energy. Owing to their symmetry property about the wake centreline, we refer to them as
 $S_2$ and
 $AS_2$, respectively.
The POD of moving and span-averaged surface pressure ( $\tilde {C}_P(\theta,t)$) for
 $\mbox {{Re}}=0.6\times 10^5$: (a) the energy content of the first 10 modes; (b,c) the top two antisymmetric and symmetric modes, respectively.

The POD analysis was carried out at other  $\mbox {{Re}}$. Mode-
 $AS_1$ is found to be the most dominant mode at all
 $\mbox {{Re}}$ in the range studied. Figure 15(a) shows the percentage energy carried by the leading four modes at various
 $\mbox {{Re}}$. As also found by Desai et al. (Reference Desai, Mittal and Mittal2020), energy of mode-
 $AS_1$ decreases, while that of mode-
 $S_1$ increases with an increase in
 $\mbox {{Re}}$ in the high subcritical and critical regimes. The decrease in energy of mode-
 $AS_1$ points to weakening of vortex shedding in these regimes, with increase in
 $\mbox {{Re}}$. On the other hand, it again picks up in the supercritical regime, as shown by the increase in percentage energy of the mode-
 $AS_1$.
POD of low-pass filtered span-averaged surface pressure ( $\tilde {C}_P(\theta,t)$): (a) variation of percentage energy content of
 $AS_1$,
 $S_1$,
 $S_2$ and
 $AS_2$ modes with
 $\mbox {{Re}}$. Surface pressure distribution of eigenmodes corresponding to mode
 $AS_1$ (b) and
 $S_1$ (d) for various
 $\mbox {{Re}}$. Panels (c,e) show the close-up views of panels (b,d), respectively, to bring out the variations in
 $AS_1$ and
 $S_1$ modes due to SV and LSB at
 $Re=1.5\times 10^5$ and
 $3.5\times 10^5$. Here, LS, TA and TS correspond to the points of laminar separation, TA and turbulent separation, respectively. The variation within the SV is shown with a thicker line in panels (c,e).

Figures 15(b) to 15(e) show the evolution of the POD modes  $AS_1$ and
 $S_1$ with an increase in
 $Re$. The points of LS, TA and TS are marked in figure 15(c,e) for
 $Re=1.5\times 10^5$ and
 $3.5\times 10^5$. We recall that the LSB forms between LS and TA. Also marked in the figures is the region of SV via thick solid lines. We note that both
 $AS_1$ and
 $S_1$ have imprint of the LSB and SV. The effect is very similar as observed in the time- and span-averaged
 $C_P$ distribution (see figures 10c and 12). The local peaks in the modes increase with an increase in
 $Re$. Except for
 $Re=1.2 \times 10^5$, the LSB forms symmetrically downstream of the two shoulders. It is quite interesting that its imprint is seen not just in the mode
 $S_1$, but also mode
 $AS_1$ that is responsible for the vortex shedding.
3.6. Variation of vortex shedding with $Re$

We further investigate the evolution of vortex shedding with increase in  $Re$. Alternate shedding of vortices from the cylinder causes it to experience time varying lift force. The r.m.s. of
 $C_L$ for various
 $Re$ is shown in figure 7. A very significant decrease in
 $C_{Lrms}$, with increase in
 $Re$, occurs in the high subcritical and critical flow regime. The variation of
 $C_{Lrms}$ in the supercritical regime is very interesting. It decreases very gradually with an increase in
 $\mbox {{Re}}$ up to
 $\mbox {{Re}}=3.0\times 10^5$ followed by a gradual increase with a further increase in
 $\mbox {{Re}}$. The unsteadiness in the pressure near the two shoulders of the cylinder is the main contributor to
 $C_{Lrms}$. Therefore, we also study the variation of r.m.s. of
 $C_P$ at the shoulder of the cylinder for various
 $Re$. Here,
 $C_{Prms}$ are estimated at
 $\theta =\pm 90^{\circ }$ and their average is plotted in figure 16(a). Here, values for
 $C_{Lrms}$, shown in figure 7, are replotted in the figure for comparing the variations with
 $\mbox {{Re}}$. As expected, the variation of
 $C_{Lrms}$ and
 $C_{Prms}$ with
 $Re$ are very well correlated. This information can be useful in experimental investigations wherein
 $C_{Prms}$ at the shoulder can be utilized to study vortex shedding.
Flow past a circular cylinder with  $L_z=1D$: (a) variation, with
 $Re$, of r.m.s. of
 $C_P$ (
 $=C_{Prms}$) averaged on the two shoulders (
 $\theta =\pm 90^{\circ }$) of the cylinder and r.m.s. of
 $C_L$ (
 $C_{Lrms}$). Shown in panel (b) is the variation of the vortex formation length (
 $L_f$) with
 $Re$. The abbreviations are: P, present; S & B, Szepessy & Bearman (Reference Szepessy and Bearman1992); B, Bloor (Reference Bloor1964); D, Desai et al. (Reference Desai, Mittal and Mittal2020).

The vortex formation length ( $L_f$) from the present computations, for various
 $Re$, is shown in figure 16(b) along with that from Szepessy & Bearman (Reference Szepessy and Bearman1992), Bloor (Reference Bloor1964) and Desai et al. (Reference Desai, Mittal and Mittal2020). It is the streamwise location where
 $\overline {u'u'}$ is maximum along the wake centreline. The
 $L_f$ from present computations is in good agreement with that reported by Szepessy & Bearman (Reference Szepessy and Bearman1992). Figure 16 shows that the variation of
 $C_{Lrms}$ with
 $Re$, in the subcritical and critical regimes, is inversely proportional to
 $L_f$. In the subcritical regime,
 $L_f$ decreases with an increase in
 $Re$ up to
 $Re=0.4\times 10^5$. The trend of
 $L_f$ from the present computations is in good agreement with that from Bloor (Reference Bloor1964). The experiments of Desai et al. (Reference Desai, Mittal and Mittal2020) were conducted with a model of large
 $AR$ (
 $=22$). Therefore, the critical
 $Re$ for the onset of drag crisis is much larger in their experiments (
 ${\approx }3.9\times 10^5$). All the data points shown in figure 16(b) from their experiments, are for the high subcritical regime. We observe that the variation of
 $L_f$ from their experiments follows the same trend as that from the present computations in the critical and high subcritical regimes. These results show that the reduction in
 $C_{Lrms}$ in the high subcritical and critical regimes is primarily due to two phenomena: (i) decrease in the strength of vortices and (ii) increase in vortex formation length. Figure 16(b) further shows that
 $L_f$ decreases with increase in
 $\mbox {{Re}}$ in the supercritical regime. The variation of Strouhal number (
 $St$) with
 $\mbox {{Re}}$, along with results from earlier studies, is shown in figure 17. It is estimated from the dominant frequency in the time variation of the lift coefficient. The
 $St$ estimated from the time histories of the cross-flow component of velocity in the near wake leads to very similar values;
 $St$ is close to
 $0.2$ in the subcritical regime. It increases sharply with an increase in
 $Re$ in the critical and early supercritical regime. For the present computations, it is
 $0.43$ at
 $Re=4\times 10^5$, which is almost twice the value that is observed in subcritical regime. As seen from figure 17, it can be as large as
 $0.46-0.48$ for higher
 $\mbox {{Re}}$ in supercritical regime (Bearman Reference Bearman1969; Schewe Reference Schewe1983).
Flow past a circular cylinder: variation of non-dimensional vortex shedding frequency, Strouhal number ( $St$), with Reynolds number. The abbreviations are: S & B, Szepessy & Bearman (Reference Szepessy and Bearman1992); R, Rodríguez et al. (Reference Rodríguez, Lehmkuhl, Chiva, Borrell and Oliva2015); S, Schewe (Reference Schewe1983); B, Bearman (Reference Bearman1969).

3.6.1. Spanwise correlation of vortex shedding
Figure 15(a) shows that the vortex shedding persists through the entire  $\mbox {{Re}}$ range, including the critical regime. How, then, does its coherence across the span vary with
 $\mbox {{Re}}$? To investigate the same we utilize the Pearson's correlation coefficient that is a measure of the linear correlation between two variables
 $\phi (t)$ and
 $\psi (t)$. It is defined as
 $R_{\phi \psi }={\overline {(\phi -\bar {\phi })(\psi -\bar {\psi })}}/{\sqrt {\overline {(\phi -\bar {\phi })^2}}\sqrt {\overline {(\psi -\bar {\psi })^2}}}$, where an overbar represents the time-average of the corresponding quantity. Following the work of Szepessy (Reference Szepessy1994) we utilize
 $C_P(\theta =90^{\circ }, t)$ on the surface of the cylinder to estimate
 $R_{pp}$ between a point fixed at midspan and another at a different span location. Further, we attempt to filter out the variation in
 $C_P$ due to vortex shedding and use it to estimate
 $R_{pp}$.
Time histories of  $C_P$ at midspan and
 $\theta =90^{\circ }$ for three
 $Re$ are shown in the right-hand panels of figure 13. We propose a triple decomposition of the time series to enable us to estimate the time variations due to vortex shedding,
 $C_P(\theta,t)=\hat {C}_P(\theta,t)+C_{Pv}(\theta,t)+C'_P(\theta,t)$. Here,
 $C_P'$ is the contribution due to activity of vortices generated via instability of the shear layer;
 $C_{Pv}$ is the contribution from vortex shedding/mode-
 $AS_1$ and
 $\widehat {C_P}$ is the low frequency modulation arising from the expansion–contraction of the vortex formation region (Desai et al. Reference Desai, Mittal and Mittal2020) due to mode-
 $S_1$. Let
 $\tilde {C}_P(\theta,t)=\hat {C}_P(\theta,t)+C_{Pv}(\theta,t)$ be the moving average over a few shear layer cycles as described in the previous subsection. Therefore,
 $C_P(\theta,t)$ may also be expressed as
 $C_P(\theta,t)=\tilde {C}_P(\theta,t)+C'_P(\theta,t)$. In a similar manner,
 $\hat {C}_P(\theta,t)$ can also be estimated via a moving average of
 $C_P(\theta,t)$, but over a window of larger time period that spans a few vortex shedding cycles,
 $\hat {C}_P(\theta,t)=({1}/{T}) \int _{t-T/2}^{t+T/2} C_P(\theta,t)\,\mathrm {d}t$. We choose
 $T=2T_k$, where
 $T_k$ is the time period of vortex shedding. The contribution to
 ${C}_P(\theta,t)$ from the vortex shedding is then estimated via
 $C_{Pv}(\theta,t)=\tilde {C}_P(\theta,t)-\hat {C}_P(\theta,t)$.
Figure 18 shows the span-time variation of  $C_P(t,z)$,
 $\tilde {C}_P(t,z)$ and
 $C_{Pv}(t,z)$ at
 $\theta =90^{\circ }$ for three
 $\mbox {{Re}}$ in the subcritical (
 $=0.6\times 10^5$), critical (
 $=1.5\times 10^5$) and supercritical (=
 $3.5\times 10^5$) regimes. Vortex shedding can be identified in all the panels by time variations that alternate between low and high values. Now
 $\tilde {C}_P$ filters out the shear layer activity from
 $C_P$. As expected, the difference between the two fields is significant in the critical and supercritical regimes. Additionally,
 $C_{Pv}$ shows the estimate of the time variations in
 $C_P$ due to vortex shedding. The range of the colourmap has been suitably adjusted for each
 $\mbox {{Re}}$. Amongst the three
 $\mbox {{Re}}$ for which data is presented in the figure, the shedding is strongest at
 $\mbox {{Re}}=0.6\times 10^5$ and weakest at
 $3.5\times 10^5$. Figure 19(a) shows the spanwise variation of the two-point correlation coefficient
 $R_{pp}(C_P)$ between the
 $C_P$ at midspan and another spanwise location at various
 $\mbox {{Re}}$. The variations corresponding to
 $\mbox {{Re}}$ in the subcritical and critical regimes are shown in solid lines, while those in the supercritical regime are shown in broken lines. Consistent with the symmetry of the problem set-up about midspan,
 $R_{pp}$ exhibits symmetry with respect to
 $z=0$. The correlation decreases as one moves away from midspan. The decrease is quite rapid in the critical and supercritical regime. It becomes as low as
 $0.24$ in the supercritical regime at the far end of the cylinder. Furthermore,
 $R_{pp}(C_P)$ decreases with an increase in
 $\mbox {{Re}}$, at any span location, as is also evident from the panels in the first row of span-time variation of
 $C_P(t,z)$.
Flow past a circular cylinder: space–time plot of coefficient of pressure ( $C_{P}(\theta =90^{\circ },t,z)$) (a,d,g), moving averaged coefficient of pressure (
 $\tilde {C}_{P}(\theta =90^{\circ },t,z)$) (b,e,h) and fluctuations associated with vortex shedding (
 $C_{Pv}(\theta =90^{\circ },t,z)$) (c,f,i) for (a–c)
 $Re=0.6\times 10^5$, (d–f)
 $Re=1.5\times 10^5$ and (g–i)
 $Re=3.5\times 10^5$.

Flow past a circular cylinder: variation of spanwise correlation coefficient  $R_{pp}$ with
 $z/D$ for different
 $\mbox {{Re}}$ at
 $\theta =90^{\circ }$ based on (a)
 $C_{P}$, (b)
 $\tilde {C}_{P}$ and (c)
 ${C}_{Pv}$.

Next, the correlation coefficient is computed by utilizing the low-pass filtered time series,  $\tilde {C}_P$. Figure 19(b) shows
 $R_{pp}(\tilde {C}_P)$ along the span, for various
 $\mbox {{Re}}$. The vortices that form due to the rolling up of the separated shear layer are relatively farther in the wake in the subcritical regime. Therefore, they do not have a significant effect on the surface pressure at the shoulder of the cylinder. Consequently,
 $R_{pp}(\tilde {C}_P)$ is very similar to
 $R_{pp}(C_P)$ in this regime. However, the differences are significant in the critical regime and beyond. In general, for a given
 $\mbox {{Re}}$ and at any span location,
 $R_{pp}(\tilde {C}_P)$ is higher than
 $R_{pp}(C_P)$. Unlike
 $R_{pp}(C_P)$, which decreases with an increase in
 $\mbox {{Re}}$,
 $R_{pp}(\tilde {C}_P)$ shows little variation with
 $\mbox {{Re}}$ beyond
 $\mbox {{Re}}=1.5\times 10^5$. We note that the results presented by Szepessy (Reference Szepessy1994) are based on similarly filtered time series of surface static pressure.
The correlation coefficient computed using  $C_{Pv}(t,z)$ is referred to as
 $R_{pp}(C_{Pv})$. Its spanwise variation for various
 $\mbox {{Re}}$ is shown in figure 19(c). The correlation coefficient for the subcritical
 $\mbox {{Re}}$ (
 $=0.6\times 10^5$) is virtually identical for the three cases that utilize either
 $C_P$ or
 $\tilde {C}_P$ or
 $C_{Pv}$; the vortex shedding across the span is highly correlated. Now
 $R_{pp}(C_{Pv})$ decreases with an increase in
 $\mbox {{Re}}$ in the critical regime. It increases with a further increase in
 $\mbox {{Re}}$ beyond
 $3.0\times 10^5$. This indicates that the spanwise coherence of vortex shedding decreases with an increase in
 $\mbox {{Re}}$ in the critical regime and then increases in the supercritical regime. This is consistent with the observation from the panels showing the span-time variation of
 $C_{Pv}$ at the shoulder of the cylinder in figure 18. The increase in spanwise coherence in the supercritical regime is not captured by the correlation coefficient based on either
 $C_P$ or
 $\tilde {C}_P$.
4. Conclusions
Large eddy simulation of flow past a circular cylinder of low  $AR$ (
 $AR=1$ and
 $3$) has been carried out for
 $2\times 10^3 \leq Re \leq 4\times 10^5$ spanning the subcritical, critical and supercritical flow regimes. The classification proposed by Schewe (Reference Schewe1983) for identifying the critical regime, based on a variation of
 $\overline {F}_x$ with
 $Re$, has been utilized in the present work. The proposal by Schewe (Reference Schewe1983) is extended to non-dimensional quantities. The local maxima and minima in the variation of
 $\overline {C}_D Re^2$ with
 $Re$ are utilized to identify the onset and end of critical regime. The effect of
 $AR$ is found to be very significant, especially in the subcritical and critical regimes. The transition of the flow occurs at a significantly lower
 $Re$ for cylinders with low
 $AR$. The present results show that the critical
 $Re$ for the onset of drag crisis is
 $1 \times 10^5$ for
 $AR=1$. Experimental studies for larger span lengths,
 $10 \leq$AR
 $\leq 22$, report the critical
 $Re$ to lie between
 $2.8\times 10^5\text {--}3.3\times 10^5$. We note that the transition of flow is also sensitive to experimental conditions such as free stream turbulence and surface roughness of the cylinder. The cause of the effect of
 $AR$ has been explored in this work by investigating the role of the boundary layer on the end walls. Simulations with slip and no-slip conditions on the velocity on the end plates, for
 $AR=1$, show that the boundary layer on the sidewalls does not have any significant effect on the bulk of the flow. Rather, the confinement effect of the lateral walls in restricting the three-dimensionality of the flow is found to be the major reason for the difference in flows between cylinders of low and high
 $AR$. This is brought out by a comparison between the subcritical flow for
 $AR=1$ and
 $3$. Compared with higher
 $AR$, the flow with lower
 $AR$ cylinder is associated with stronger Reynolds stresses and activity related to the instability of the shear layer. This leads to higher
 $C_{Lrms}$ in the subcritical regime and onset of transition at a lower
 $Re$ for the lower
 $AR$ cylinder. The variations of
 $\overline {C}_D$ and
 $C_{Lrms}$, with
 $Re$, for
 $AR=1$ from the present study are in excellent agreement with the measurements of Szepessy & Bearman (Reference Szepessy and Bearman1992). The periodic boundary conditions at the lateral boundaries do not correctly simulate the confinement effect of the end walls. Therefore, even for low
 $AR$ cylinders, results from past studies that have utilized periodic boundary conditions are closer to experimental measurements with cylinders of relatively large
 $AR$.
The evolution of SV, LSB with Re has been investigated. The SV forms in the low subcritical regime while the LSB appears in the flow in the critical regime. Both, the LSB and SV coexist in flow in the critical and supercritical regimes, wherein, SV is embedded inside the LSB. The separation and attachment points of these flow structures are identified using the time- and span-averaged distribution of surface skin friction and utilized to study their evolution with  $Re$. The circumferential extent of SV, in the subcritical regime, increases for
 $5\times 10^3 \leq Re \leq 0.4\times 10^5$ and decreases thereafter. It decreases slightly with increase in
 $Re$ in the critical and supercritical regimes. The LS and turbulent attachment points associated with the LSB move downstream and upstream, respectively, leading to a decrease in the circumferential extent of LSB with increase in
 $Re$. The LSB can be identified from a plateau in
 $\overline {C}_P$ on the surface of the cylinder, while the SV leads to a sharp dip followed by a recovery, resembling a ‘kink’. Interestingly, there is no perceptible imprint of the SV in the
 $\overline {C}_P$ distribution when the flow is devoid of LSB. The formation of LSB leads to an increase in peak suction coefficient (
 $-\overline {C}_{Ppeak}$) on the surface of the cylinder. Furthermore, the
 $-\overline {C}_{Ppeak}$ increases sharply with an increase in
 $Re$ in the critical regime and its location moves downstream. The peak suction is located upstream of the shoulder of the cylinder for all
 $Re$ studied.
The strength of vortex shedding and its coherence along the span has been investigated for the cylinder with  $AR=1$. The POD of the surface pressure reveals the existence of antisymmetric (
 $AS_1$) and symmetric modes (
 $S_1$). Mode-
 $AS_1$ is the most dominant mode while the
 $S_1$ mode carries the next largest percentage of energy of the flow, for all the
 $\mbox {{Re}}$ in the study. In the high subcritical and critical regimes, the percentage of energy associated with mode-
 $AS_1$ decreases with increase in
 $Re$ signalling the weakening of vortex shedding, while that with mode-
 $S_1$ increases. The weakening of vortex shedding is attributed to a decrease in the strength of vortices, reduction in spanwise coherence, as well as an increase in formation length. The percentage energy of the mode-
 $AS_1$ increases once again in the supercritical regime, and the formation length decreases, signifying rejuvenation of vortex shedding. An imprint of LSB and SV is seen in the eigenmodes for both,
 $AS_1$ and
 $S_1$ in the critical and supercritical regimes. The spanwise coherence of vortex shedding is assessed via correlation in the unsteadiness of the pressure signal at midspan with other spanwise locations. A novel triple decomposition is proposed and utilized to filter out the time variations due to vortex shedding. It is found that the vortex shedding is highly correlated along the span in the subcritical regime. Its spanwise coherence decreases with increase in
 $\mbox {{Re}}$ in the critical regime and shows improvement again, beyond
 $Re \sim 3 \times 10^5$ in the supercritical regime.
Acknowledgements
The authors acknowledge the use of the High Performance Computational (HPC) facility at Indian Institute of Technology Kanpur (IITK), Cray XC-40, Shaheen, at King Abdullah University of Science and Technology (KAUST), Saudi Arabia, and National PARAM Supercomputing Facility (NPSF) at the Centre of Development of Advanced Computing (C-DAC), Pune, India. The authors would like to thank Professor R. Samtaney of KAUST for his help with access to the computational facility at KAUST. The HPC facility at IITK was established with the assistance of Department of Science and Technology (DST), India. The authors would like to thank Mr M. Furquan and Mr A. Desai for their help in carrying out POD. The authors are grateful to the reviewers for their insightful suggestions and inputs towards the improvement of this paper.
Declaration of interests
The authors report no conflict of interest.
Appendix A. Mesh and time step size convergence study
A.1. Effect of circumferential element length
The adequacy of the circumferential mesh resolution on the surface of cylinder is investigated by considering two meshes for  $L_z=1D$ with
 $N_{\theta }=800$ and
 $1600$. The spanwise mesh resolution for both is same (
 $\varDelta _z=0.02D$). Computations with the two meshes are carried out at
 $Re=3.0\times 10^5$ which lies in the supercritical flow regime and is associated with both SV and LSB. The time-averaged coefficient of drag (
 $\overline {C}_D$), r.m.s. of coefficient of lift (
 $C_{Lrms}$), non-dimensional vortex shedding frequency (
 $St$), circumferential extent of the SV (
 ${\rm \Delta} \theta _{SV}$), LSB (
 ${\rm \Delta} \theta _{LSB}$), obtained from both meshes are listed in table 2. The comparison of the surface distribution of time- and span-averaged coefficient of pressure (
 $\overline {C}_P$) and skin friction coefficient (
 $\overline {C}_f$) for meshes M1 and M2 are presented in figure 20. This shows that the mesh with
 $N_{\theta }=800$ is good enough to resolve the flow structures associated with these flows and is used for all the computations in the present study.
The  $Re=3.0\times 10^5$ flow past a cylinder: surface distribution of time- and span-averaged (a) coefficient of pressure (
 $\overline {C}_P$) and (b) skin friction coefficient (
 $\overline {C}_f$) obtained from meshes M1 (
 $N_{\theta }=800$) and M2 (
 $N_{\theta }=1600$).

The  $Re=3.0\times 10^5$ flow past a circular cylinder: time-averaged coefficient of drag (
 $\overline {C}_D$), r.m.s. of coefficient of lift (
 $C_{Lrms}$), non-dimensional vortex shedding frequency (
 $St$), the circumferential extent of SV (
 $\theta _{SV}$) and LSB (
 $\theta _{LSB}$) obtained from two finite element meshes with different spatial resolution along the surface of cylinder.

A.2. Effect of spanwise resolution
The adequacy of the spanwise resolution is investigated by considering two meshes with  $\varDelta _z=0.01D$ and
 $0.02D$. We refer to these as meshes
 $M1$ and
 $M3$, respectively. Computations with the two meshes are carried out at three representative
 $Re$ that lie in the subcritical, critical and supercritical flow regime for
 $L_z=1D$. The time-averaged coefficient of drag (
 $\overline {C}_D$), r.m.s. of coefficient of lift (
 $C_{Lrms}$) and non-dimensional vortex shedding frequency, Strouhal number (
 $St$), obtained from two meshes are listed in table 3. The results from both meshes are in good agreement. We investigate the case of
 $Re=4.0\times 10^5$ in more detail. It is the highest
 $Re$ considered in this study. First, we study the effect of
 $\varDelta _z$ on the SV and LSB. The streamlines and surface distribution of
 $C_P$ and
 $C_f$ corresponding to the time- and span-averaged flow from the meshes are shown in figure 21. The circumferential extent of the SV and LSB for mesh M1 is
 $2.25^{\circ }$ and
 $13.05^{\circ }$, respectively. These numbers for mesh M3 are
 $2.60^{\circ }$ and
 $14.50^{\circ }$. The streamwise variation of time- and span-averaged streamwise component of velocity (
 $\bar {u}/U_{\infty }$) at
 $y=0$ and
 $\overline {u'u'}/U^2_{\infty }$ at
 $y/D=0.05$ for meshes M1 and M3 are shown in figure 22. Reasonable agreement is observed in the results from the two meshes. Therefore, it can be concluded that mesh M1 provides adequate spanwise resolution for the
 $Re$ considered in this study. All the computations in this study are carried out with a spanwise resolution corresponding to
 $\varDelta _z=0.02D$.
The  $Re=4.0\times 10^5$ flow past a cylinder: time- and span-averaged streamlines for meshes (a) M1(
 $\varDelta _z=0.02D$) and (b) M3 (
 $\varDelta _z=0.01D$). Also shown are the surface distribution of time- and span-averaged (c) coefficient of pressure (
 $\overline {C}_P$) and (d) skin friction (
 $\overline {C}_f$) obtained from meshes M1 and M3.

The  $Re=4.0\times 10^5$ flow past a cylinder: variation of time- and span-averaged (a) streamwise component of velocity (
 $\bar {u}/U_{\infty }$) at
 $y/D=0$, (b)
 $\overline {u'u'}$ component of Reynolds stress at
 $y/D=-0.05$ obtained from meshes M1 (
 $\varDelta _z=0.02D$) and M3 (
 $\varDelta _z=0.01D$).

Flow past a circular cylinder with  $L_z=1D$: time-averaged coefficient of drag (
 $\overline {C}_D$), r.m.s. of coefficient of lift (
 $C_{Lrms}$) and non-dimensional vortex shedding frequency (
 $St$) for
 $Re=0.4\times 10^5$,
 $1.0\times 10^5$ and
 $4.0\times 10^5$ obtained from two finite element meshes with different spatial resolution along the span.

A.3. Effect of time step size
The adequacy of the time step size is investigated for the flow at  $Re=4.0\times 10^5$ which lies in the supercritical regime via computations on mesh M1 with two time step sizes,
 ${\rm \Delta} t_1=2.5\times 10^{-4}$ and
 ${\rm \Delta} t_2=5\times 10^{-5}$. The comparison of the surface distribution of time- and span-averaged coefficient of pressure (
 $\overline {C}_P$) and skin friction coefficient (
 $\overline {C}_f$) obtained with the two time step size, and presented in figure 23, show that the results are in good agreement. All the results presented in the paper for
 $Re=4.0\times 10^5$ are with
 ${\rm \Delta} t_2=5\times 10^{-5}$.
The  $Re=4.0\times 10^5$ flow past a cylinder: surface distribution of time- and span-averaged (a) coefficient of pressure (
 $\overline {C}_P$) and (b) skin friction coefficient (
 $\overline {C}_f$) obtained with computations on mesh M1, and time step size
 ${\rm \Delta} t_1=2.5\times 10^{-4}$ and
 ${\rm \Delta} t_2=5\times 10^{-5}$.

Appendix B. Validation study
B.1. $Re=3900$

The computational results from the present study are compared with those from experiments by Norberg (Reference Norberg1994), LES by Kravchenko & Moin (Reference Kravchenko and Moin2000), Parnaudeau et al. (Reference Parnaudeau, Carlier, Heitz and Lamballais2008) and DNS by Lehmkuhl et al. (Reference Lehmkuhl, Rodríguez, Borrell and Oliva2013) for the  $Re=3900$ flow. The span length and the spanwise resolution are same as in the earlier computational studies (Kravchenko & Moin Reference Kravchenko and Moin2000; Parnaudeau et al. Reference Parnaudeau, Carlier, Heitz and Lamballais2008) to enable a direct comparison. They are
 $L_z={\rm \pi} D$ and
 $\varDelta _z=0.065D$. The present computations use slip conditions on the velocity on the lateral boundary, while the studies by Kravchenko & Moin (Reference Kravchenko and Moin2000), Parnaudeau et al. (Reference Parnaudeau, Carlier, Heitz and Lamballais2008), Lehmkuhl et al. (Reference Lehmkuhl, Rodríguez, Borrell and Oliva2013) and Cheng et al. (Reference Cheng, Pullin, Samtaney, Zhang and Gao2017) employ periodic boundary conditions. The results from the various studies are listed in table 4. Here,
 $St$, the non-dimensional vortex shedding frequency, from all the studies is in very good agreement. Additionally,
 $-\overline {C}_{Pb}$ from the present study is in good agreement with experimental values of Norberg (Reference Norberg1994) but slightly lower than the numerical value reported by Kravchenko & Moin (Reference Kravchenko and Moin2000). Consistent with the trend of
 $-\overline {C}_{Pb}$, the value of
 $\overline {C}_D$ predicted by the present computations is slightly lower than that reported by Kravchenko & Moin (Reference Kravchenko and Moin2000) from their LES. The slight difference between the various computational studies can be attributed to the difference in boundary conditions on the end walls as well as the time duration for which flow is averaged. Lehmkuhl et al. (Reference Lehmkuhl, Rodríguez, Borrell and Oliva2013) reported that a symmetric mode, associated with very low frequency expansion–contraction of vortex formation region, has a significant effect on the force coefficients and flow in the near wake. They used data for
 $tU_{\infty }/D\approx 3900$, which corresponds to approximately 836 cycles of vortex shedding, to estimate the flow statistics. Kravchenko & Moin (Reference Kravchenko and Moin2000) carried out averaging for seven vortex shedding cycles while it has been done for approximately 25 cycles (
 $tU_{\infty }/D=160$) in the present study.
The  $Re=3900$ flow past a circular cylinder: time-averaged coefficient of drag (
 $\overline {C}_D$), time-averaged base suction (
 $-\overline {C}_{Pb}$) and Strouhal number (
 $St$) obtained from present computations and earlier studies.

Figure 24(a,b) shows the cross-stream profiles of time-averaged streamwise component of velocity ( $\bar {u}/U_{\infty }$) and
 $\overline {u'u'}$ component of Reynolds stress at several streamwise locations. Also shown are the results from earlier studies. The two peaks in the profile of
 $\overline {u'u'}$ arising from the shear layer activity in the wake are captured well by the computations. The velocity and
 $\overline {u'u'}$ profiles are in good agreement with earlier studies.
The  $Re=3900$ flow past a circular cylinder: (a) cross-stream variation of time-averaged streamwise component of velocity (
 $\bar {u}/U_{\infty }$) and (b) cross-stream variation of
 $\overline {u'u'}$ component of Reynolds stress at several streamwise locations. Also shown are the variations from earlier studies. The abbreviations are: K, Kravchenko & Moin (Reference Kravchenko and Moin2000); P, Parnaudeau et al. (Reference Parnaudeau, Carlier, Heitz and Lamballais2008); C, Cheng et al. (Reference Cheng, Pullin, Samtaney, Zhang and Gao2017); L, Lehmkuhl et al. (Reference Lehmkuhl, Rodríguez, Borrell and Oliva2013).

B.2. Surface pressure and skin friction distribution at higher $\mbox {{Re}}$

The variation of time- and span-averaged surface pressure ( $\overline {C}_P$) and coefficient of skin friction (
 $\overline {C}_f$) from the present computations are compared with results from earlier studies. Figure 25 shows the time- and span-averaged surface distribution of coefficient pressure (
 $\overline {C}_P$) for
 $Re=0.2\times 10^4$,
 $0.4\times 10^5$ and
 $4.0\times 10^5$. Very good agreement between the results from the present and earlier studies is observed. It is seen from figure 25(a), for
 $Re=0.2\times 10^5$, that
 $L_z=3D$ is associated with larger peak suction and lower base pressure compared with
 $L_z=1D$. The lower base pressure for
 $L_z=3D$ leads to higher
 $\overline {C}_D$ (see figure 5) than for
 $L_z=1D$. Similarly, the larger peak suction is responsible for the large
 $C_{Lrms}$ for
 $L_z=3D$, at this
 $Re$ (see figure 7). Now
 $Re=4.0\times 10^5$ lies in the supercritical regime, where a LSB as well as an SV is observed. The
 $\overline {C}_P$ at this
 $Re$ is in good agreement with the measurements by Tani (Reference Tani1964) for
 $Re=3.8\times 10^5$ and
 $4.65\times 10^5$. The present computations accurately predict the location of peak suction as well as its value. The LSB can be identified by a plateau in the
 $\overline {C}_P$ distribution at
 $\theta \approx 108^{\circ }$. Its location is in good agreement with that reported by Tani (Reference Tani1964). As will be shown in a later section, the presence of SV leads to a ‘kink’ in the
 $\overline {C}_P$ distribution following the plateau due to LSB.
Flow past a circular cylinder: surface distribution of time- and span-averaged coefficient of pressure ( $\overline {C}_P$) for
 $Re=$ (a)
 $0.2\times 10^5$, (b)
 $0.4\times 10^5$ and (c)
 $4.0\times 10^5$. The abbreviations are: C, Cheng et al. (Reference Cheng, Pullin, Samtaney, Zhang and Gao2017); S & B, Szepessy & Bearman (Reference Szepessy and Bearman1992); T, Tani (Reference Tani1964).

The variation of  $\overline {C}_f$ on the surface of the cylinder is shown in figure 26 for
 $Re=0.2\times 10^5$ and
 $1.0\times 10^5$. The former lies in the subcritical regime, while the latter is at the onset of critical regime. The results for
 $L_z=1D$ and
 $3D$ are very close, except that the peak
 $\overline {C}_f$ is slightly higher for
 $L_z=3D$ compared with that for
 $L_z=1D$. The surface distribution of
 $\overline {C}_f$ for
 $L_z=3D$ is in good agreement with Cheng et al. (Reference Cheng, Pullin, Samtaney, Zhang and Gao2017). The measurements from Achenbach (Reference Achenbach1968) show a slight over prediction of
 $\overline {C}_f$ for
 $Re=1.0\times 10^5$ compared with the present results and those from Cheng et al. (Reference Cheng, Pullin, Samtaney, Zhang and Gao2017).
Flow past a circular cylinder: surface distribution of time- and span-averaged coefficient of skin friction ( $\overline {C}_{f}$) for (a)
 $Re=0.2\times 10^5$ and (b)
 $Re=1.0\times 10^5$. The abbreviations are: C, Cheng et al. (Reference Cheng, Pullin, Samtaney, Zhang and Gao2017); A, Achenbach (Reference Achenbach1968).

Appendix C. Flow past a cylinder with end plate
The finite element mesh is modified to adequately resolve the boundary layer on the end plates at the lateral walls. A two-dimensional section of the mesh in the  $x$–
 $y$ plane is shown in figure 27(a). The extent of the end plate is shown as well via a blue line. The mesh near the leading edge of the end plate as well as upstream of the cylinder, where horseshoe vortices are expected, is suitably modified. To adequately resolve the boundary layer on the end plates, the grid spacing along the span is small and it gradually increases towards the midspan. The grid spacing is
 $5\times 10^{-3}D$ near the end wall and
 $0.02D$ at midspan. The circumferential and radial distribution of grid points close to the cylinder is similar to that described earlier. Figure 27(b) shows the horseshoe vortices in the flow in the presence of a no-slip end plate for
 $Re=0.4\times 10^5$. The horseshoe vortices act as a disturbance to the boundary layer on the end plate. At this
 $Re$ the disturbances decay beyond
 $x/D \sim 3$, as indicated by the streamwise variation of the local skin friction coefficient (not shown here). However, at larger
 $Re$, the boundary layer at the end wall might undergo transition owing to these disturbances and interact with the wake.
Flow past a circular cylinder ( $AR=1$) with no-slip condition on the end plates at the lateral boundaries. (a) Close-up view of the finite element mesh in the
 $x$–
 $y$ plane. The boundary of the end plate is marked using a blue line. (b) The
 $Q=1$ isosurface of the instantaneous flow showing the horseshoe vortices in the flow. Only half of the span is shown.

Appendix D. Transition of boundary layer
Figure 28 shows the velocity profiles, of the span- and time-averaged flow for  $\mbox {{Re}}=4\times 10^5$ in the supercritical regime, near the surface of the cylinder at several circumferential locations in the terms of the inner variables:
 $u^+$ versus
 $y^+$, where
 $u^+=\overline {u}_{\theta }/v^*$ and
 $y^+=yv^*/\nu$. Here,
 $\overline {u}_{\theta }$ is the time- and span-averaged tangential component of flow velocity,
 $y$ is the distance from the surface of the cylinder and
 $v^*$ is the wall-friction velocity defined as
 $v^*=\sqrt {\tau _w / \rho }$, where
 $\tau _w$ is the shear stress at the wall. For reference, the viscous sublayer and the log law, corresponding to the velocity profile of a turbulent boundary layer over a flat plate with zero pressure gradient are shown. Also shown, along with the velocity profile, is the radial variation
 $\overline {u'_r u'_{\theta }}$ component of Reynolds stress. The profiles of these two quantities reveal the laminar/turbulent state of the boundary layer. Furthermore,
 $\theta =90^{\circ }$ lies upstream of the point of LS (see figure 11). Therefore, the flow is expected to be laminar at this location. Indeed,
 $\overline {u'_r u'_{\theta }}$ is close to zero at
 $\theta =90^{\circ }$ and the velocity profile is devoid of any correspondence to the log layer. At
 $\theta =116.10^{\circ }$, for which the flow profile is shown in figure 28, lies downstream of the TA point, but upstream of the TS point. Therefore, the flow can be expected to exhibit the signature of a turbulent boundary layer. The velocity profile follows the characteristics of viscous sublayer close to the wall and that of the log law for a certain region outwards. Interestingly,
 $\overline {u'_r u'_{\theta }}$ is significantly larger in the region of log law, compared with that in the viscous sublayer, which is consistent with the nature of a turbulent boundary layer.
The  $Re=4\times 10^5$ flow past a circular cylinder with
 $L_z=1D$: variation of time-averaged velocity (
 $u^+$) and
 $\overline {u'_{r}u'_{\theta }}$ component of Reynolds stress with
 $y^{+}$ at (a)
 $\theta =90^{\circ }$, (b)
 $\theta =116.10^{\circ }$ at
 $Re=4\times 10^5$. Also shown are the velocity profiles in the viscous sublayer (
 $u^+=y^{+}$) and log layer (
 $u^+=\frac {1}{0.41} {\log }_{e}(y^{+}) + 4.4$) for a turbulent boundary layer over a flat plate with zero pressure gradient.

The shape factor ( $H=\delta _1/\delta _2$), ratio of the displacement- to momentum-thickness of the boundary layer, is useful in diagnosing the transition of the boundary layer from a laminar to turbulent state. It was effectively utilized by Cheng et al. (Reference Cheng, Pullin, Samtaney, Zhang and Gao2017) to demonstrate the transition of their computed flow. Figure 29 shows the variation of
 $H$ along the surface of the cylinder for two
 $\mbox {{Re}}$:
 $1 \times 10^5$ and
 $4 \times 10^5$ which lie in the subcritical and supercritical regimes, respectively. Here,
 $\delta _1$ and
 $\delta _2$ are estimated as follows:
 $\delta _1=\int _{r_0}^{\delta } (1-{u_{\theta }}/{U_e})\,\textrm {d} r$,
 $\delta _2=\int _{r_0}^{\delta } ({u_{\theta }}/{U_e})(1-{u_{\theta }}/{U_e})\,\textrm {d} r$. The edge of the boundary layer,
 $r=\delta$, is identified as the radial location where
 $u_{\theta }$ is maximum (Cheng et al. Reference Cheng, Pullin, Samtaney, Zhang and Gao2017). We refer to the maximum value of
 $u_{\theta }$ as
 $U_e$. Here,
 $r_0$ is zero, except in the region of LSB. That is, the integrations to estimate
 $\delta _1$ and
 $\delta _2$ at each circumferential location, are carried out from the surface of the cylinder up to the edge of the boundary layer. At the circumferential locations that are associated with an LSB, the integration to estimate
 $\delta _1$ and
 $\delta _2$ does not begin from the surface of the cylinder. Rather, the region of reverse flow is ignored. Now
 $r_0$ is assigned as the radial location, away from the surface of the cylinder, where
 $u_{\theta }$ is zero. Also marked in figure 29 are
 $H=2.60$ and
 $1.44$ that are observed for laminar and turbulent boundary layer, respectively, on a flat plate with zero pressure gradient (FPZPG). For
 $Re=1\times 10^5$ flow past a cylinder, the present computations show that
 $H$ is approximately
 $2.2$ for
 $\theta \le 60^{\circ }$. Its proximity with
 $H=2.6$ for the laminar boundary layer on FPZPG indicates the laminar state of the boundary layer. Furthermore,
 $H$ increases with further increase in
 $\theta$ up to the point of LS. This increase correlates well with the onset of adverse pressure gradient on the surface of the cylinder as seen in figure 12. The variation of
 $H$ is in very good agreement with that reported by Cheng et al. (Reference Cheng, Pullin, Samtaney, Zhang and Gao2017). The surface distribution of
 $H$ for
 $\mbox {{Re}}=4\times 10^5$ is similar to that for
 $Re=1\times 10^5$ up to the LS point. As seen from figure 12 the peak suction for
 $\mbox {{Re}}=4\times 10^5$ occurs closer to shoulder of the cylinder, causing a downstream movement of the adverse pressure gradient. Accordingly, the rise in
 $H$ for
 $\mbox {{Re}}=4\times 10^5$ begins at a more downstream location compared with that for
 $Re=1\times 10^5$. Now
 $H$ peaks to approximately
 $3.7$ at the laminar separation point and continues to drop through the LSB and beyond the point of TA. It achieves a value as low as
 $1.7$ at
 $\theta \sim 115^{\circ }$, which indicates the boundary layer being in a turbulent state. This is consistent with the observations from figure 28 which show that the velocity profile in this region is turbulent. Owing to the adverse pressure gradient,
 $H$ rises farther downstream and eventually the boundary layer undergoes a turbulent separation at
 $\theta \sim 131^{\circ }$.
Flow past a circular cylinder with  $L_z=1D$: surface distribution of shape factor (H) of the boundary layer for
 $\mbox {{Re}}=1\times 10^5$ and
 $\mbox {{Re}}=4\times 10^5$. The LS (black filled circle), turbulent attachment (green filled circle) and turbulent separation (purple filled circle) points are also marked in the figure. C denotes Cheng et al. (Reference Cheng, Pullin, Samtaney, Zhang and Gao2017).





