

Introduction
Fructose is found in various fruits and vegetables as sucrose, raffinose, and stachyose. Reference Gaino and Silva1 Fructose is a nutrient that, when consumed in excess, can have adverse metabolic effects, especially in the liver Reference Tappy2 and there is growing concern regarding fructose consumption in the development of chronic noncommunicable diseases (NCDs). Chronic consumption of this monosaccharide may be associated with increased intrahepatic fat concentration and the development of insulin resistance as well as an increase in the prevalence of nonalcoholic fatty liver disease and hyperlipidemia. Fructose can also be considered a potent and stimulating substrate for lipogenesis. Reference Oishi, Konishi, Hashimoto, Yamamoto, Takahashi and Shiina3
Epidemiological studies suggest that increasing the consumption of sweetened beverages (containing sucrose or a mixture of glucose and fructose) is associated with a high energy intake, increased body weight, and the occurrence of metabolic and cardiovascular disorders. Reference Gaino and Silva1 It is also associated with the emergence of risk factors for the development of NCDs and repercussions on oxidative stress, DNA damage, kidney injury, and hypertension in childhood, adolescence, and adulthood. Reference Tappy and Lê4,Reference Zhang, Jiao and Kong5
Chronic states of hyperglycemia, hyperlipidemia, and hyperinsulinemia caused by the excessive consumption of fructose are associated with the development of metabolic syndrome, oxidative stress, and DNA oxidation. Reference Azqueta, Shaposhnikov and Collins6,Reference Ajiboye, Hussaini, Nafiu and Ibitoye7 Therefore, it is believed that the quality of glycemic control is essential to prevent DNA oxidation. Reference Nishikawa, Sasahara and Kiritoshi8
All cells in the body are constantly exposed to genotoxic agents that can damage DNA molecules through endogenous factors such as cell metabolism and exogenous factors such as ultraviolet light, food, and pollution. Reference Weeden and Asselin-Labat9
Oxidative stress arises when the balance between reactive oxygen and nitrogen species is not in balance with the antioxidant defense. In healthy aerobic organisms, the production of reactive oxygen and nitrogen species is approximately balanced by the defenses of the antioxidant system. Reference Gutteridge and Halliwel10
Oxidative stress conditions can cause molecular changes, such as lipid peroxidation, protein carbonylation, and DNA fragmentation, and these changes can be affected by fetal programming. Moreli et al., Reference Moreli, Santos and Rocha11 in a literature review, reported that hyperglycemia causes damage to maternal genetic material, induced by oxidative stress, without a clear consensus regarding the impact of this condition on fetal cells.
Therefore, it is generally observed that in a healthy pregnancy, reactive oxygen species (ROS) and antioxidants remain in balance and DNA damage is repaired effectively. However, pregnancy is an inflammatory state that exhibits greater susceptibility to oxidative stress, so this balance can be easily interrupted. An increase in DNA damage has been shown to be involved in many disease states, including pregnancy complications. Modern lifestyles, including exposure to pollutants, poor diet and lack of exercise, can lead to inflammation and oxidative stress and, consequently, DNA damage. To understand the effect of lifestyle and DNA damage on pregnancy health, further studies are needed, with preconception sample collection and time-to-conception parameters, early pregnancy loss, and maternal and fetal health during pregnancy. Reference Furness, Dekkerb and Roberts12,Reference White, Piper, Noland and Daniels13
Magenis et al. evaluated the genetic and biochemical effects of fructose consumption (10 and 20%/l) in female mice during pregnancy and lactation. They observed changes in food intake, body weight, glycemic profile, lipid profile, and genotoxicity in both periods evaluated. However, its effect on offspring is not yet known.
Despite the presence of many studies on fructose consumption during pregnancy, the effects on offspring have not been fully elucidated. Therefore, the aim of this study was to evaluate the genetic and biochemical effects on offspring of female mice treated with fructose during pregnancy and lactation.
Materials and methods
Animals and ethical principles
The animals were obtained from the Animal Center of the University of Southern Santa Catarina (Unesc, Brazil) and housed in polypropylene boxes and maintained under a 12-h light/dark cycle with access to water or fructose (10%/l or 20%/l) in a temperature-controlled (23 ± 1°C) room. This study was approved by the Ethics Committee of the Universidade do Extremo Sul Catarinense (approval No. 028/2017-2) and was performed in accordance with the ethical principles of the Brazilian College of Animal Experimentation (COBEA). The experiments followed the guidelines of ARRIVE (Animal Research: Reporting of In Vivo Experiments). Moreover, every effort was made to minimize animal suffering and reduce the number of animals used in the experiments.
The standard feed of the animals was supplied from the Puro Lab 22PB laboratory, which corresponds to 2.93 kcal/g, 20%, 10%, and 70% of the calories supplied with protein, fat, and carbohydrates, respectively.
Nutritional model of maternal fructose consumption
The experimental model of this work was carried out in female mice that received water or fructose (10 and 20%/l) during the period of copulation, pregnancy, and lactation. All of these data are published in the paper of Magenis et al. Reference Magenis, Damiani and Marcos14
Drinking water or fructose at doses of 10%/l or 20%/l was made available to couples during the copulation (7 days), to female mice during pregnancy (21 days) and lactation (21 days) in hydration bottles. Fructose (Sigma Aldrich, Brazil) was dissolved in drinking water (10 g/l (10%/l) or 20 g/l (20%/l) according to the groups), it was prepared and refreshed three times a week. The concentration 10% or 20% of fructose was selected according to previously described data as well as the route of administration and treatment period. Reference Mizuno, Munetsuna and Yamada15
In the precopulation period, the control group (water) consumed an average of 6.9 ± 1.1 ml, the fructose group 10%/l consumed 9.8 ± 2.4 ml, and the fructose group 20%/l 9.6 ± 1.6 ml. During pregnancy, the control group (water) consumed 13.5 ± 2.7 ml, the fructose group 10%/l consumed 13.6 ± 3.4 ml, and the fructose group 20%/l 13.8 ± 3.3 ml. During lactation, the control group (water) consumed 18.8 ± 6.8 ml, the fructose group 10%/l consumed 21.2 ± 8.0 ml, and the fructose group 20%/l 23.8 ± 8.6 ml (see Magenis et al. Reference Magenis, Damiani and Marcos14 for more information).
During pregnancy females weighed on average 42.2 ± 3.7 g in the control group (water), in the fructose group 10%/l 51.0 ± 3.3 g and in the fructose group 20%/l 50.8 ± 3.8 g. During lactation, the control group (water) weighed 38.4 ± 4.0 g, the fructose group 10%/l 40.0 ± 3.0 g and the fructose group 20%/l 42.9 ± 3.3 g (see Magenis et al. Reference Magenis, Damiani and Marcos14 for more information).
The fasting blood glucose of pregnant female was 102.4 ± 8.4 mg/dl in the control group (water), 113.8 ± 18.3 mg/dl in the fructose group 10%/l and 129.0 ± 16.4 mg/dl in the fructose group 20%/l. In lactation period, the control group (water) showed mean values of 119.6 ± 14.7 g, the fructose group 10%/l 123.2 ± 19.1 mg/dl and the fructose group 20%/l 121.3 ± 8.0 mg/dl (see Magenis et al. Reference Magenis, Damiani and Marcos14 for more information).
Twenty-four male offspring and twenty-four female offspring were obtained from these females. These animals were divided into six groups with eight animals each: P1 male and P2 female offspring, negative control, the female mothers of this offspring received only water during pregnancy and lactation periods; P3 male and P4 female offspring, 10% fructose/l, female mothers received 10% fructose/l during pregnancy and lactation; P5 male and P6 female offspring, 20% fructose/l, female mothers received 20%/l fructose during pregnancy and lactation. These animals were submitted to genetic and biochemical tests seven days after the interruption of breastfeeding, when they completed 30 days of life (Fig. 1). Importantly, only pregnant female mice received fructose, their offspring did not receive it directly, only through in utero and breast milk exposure.
Experimental Design of the Nutritional model of maternal fructose consumption Treatment with different doses of fructose (10%/l and 20%/l) or drinking water during copulation (7 days), pregnancy (21 days), and lactation (21 days), and offspring evaluation.

Food consumption, energy efficiency, and body weight of offspring
The offspring were weighed weekly throughout the experiment, after completing seven days of life, as the mothers could be stressed if the offspring were removed from them earlier, according to previous studies by our group. Food and water consumption were calculated weekly. The volume of liquid and food consumption was quantified and divided by the number of animals per cage throughout the experiment. Based on the food intake, the corresponding amount of energy was calculated as: total energy intake (g/kcal) = mean of food intake/calories per day, and energy efficiency (g/kcal) = mean body weight gain/mean energy consumption. Reference Diniz, Faine and Galhardi16,Reference Diniz, Fernandes and Campos17
Fasting blood glucose of offspring
The offspring food was withdrawn 12 h before the fasting blood glucose test at 30 days of life. Blood collection was used to measure fasting blood glucose levels and was performed using blood collected from tail vein. Reference Wajchenberg, Santomauro and Nery18
Lipid profile of offspring
Serum concentrations of total cholesterol, high-density lipoprotein (HDL), and triglycerides (TGs) were evaluated. Serum was used to perform the assay, and the test was carried out using commercial kits (Dialab). The absorbance values measured using a spectrophotometer were used to determine the lipid profile as follows: standard test/absorbance at 200 AU. The TG and HDL values (both in mg/dl) were used to calculate the TG/HDL ratio, also known as the Castelli Index. 19
Genotoxic and mutagenic analyzes in the offspring
Comet assay (alkaline version)
The peripheral blood was collected before the euthanasia and the liver, kidney, cortex, striatum, and hippocampus were collected from animals immediately after euthanasia. The comet assay was performed under alkaline conditions as previously described. Reference Singh, McCoy, Tice and Schneider20,Reference Tice, Agurell and Anderson21 Peripheral blood samples from female and male mice offspring were collected into heparinized tubes and maintained on ice. Each liver, kidney, cortex, striatum, and hippocampus tissue sample were placed in cold phosphate-buffered saline before being minced with a syringe plunger (back and forth movements) to obtain a fine cell suspension to perform the comet assay.
Aliquots of blood (5 μl) and cell suspension from each tissue (20 μl) were embedded in low-melting agarose (0.75%, w/v; 95 or 80 μl, respectively). This mixture was then placed on a microscope slide precoated with agarose at a normal melting temperature (1.5%, w/v) and furnished with a coverslip (two slides per sample). Slides were incubated on ice so that the agarose could solidify and the cover slip could be carefully removed. Next, the base slide was immersed in freshly prepared lysis buffer (2.5 M NaCl, 100 mm EDTA, 10 mm Tris-HCl; pH 10–10.5). The lysis time was a minimum of 24 h up to a maximum of 2 days. Then, the slides were immersed for 20 min in freshly-prepared alkaline buffer (300 mm NaOH, 1 mm EDTA, pH > 13) prior to electrophoresis (30 min/300 mA; 25 V; 0.7 V/cm) in the same buffer. These steps were conducted under minimal indirect light. After electrophoresis, the slides were neutralized in 400 mm Tris-HCl (pH 7.5) and stained with SYBR Gold (Invitrogen, USA) for evaluation under a fluorescence microscope (400× magnification). Images of 100 randomly selected cells (50 cells from each of the two replicate slides) were analyzed for each mouse. To calculate the DNA damage index (DI), cells were visually categorized into five classes according to their tail size (0, no tails; 4, maximal-length tails). Accordingly, a single DNA damage score was obtained for each sample and, consequently, for each group being studied. The DI for the group ranged between 0 (completely undamaged = 100 cells × 0) and 400 (maximum damage = 100 cells × 4). Visual scoring of comets is considered a reliable evaluation method and usually yields strong correlations with computer-based image analysis. Reference Collins, Yamani, Lorenzo, Shaposhnikov, Brunborg and Azqueta22
The electrophoresis procedure and efficiency for each run were checked using negative and positive internal controls consisting of whole human blood collected in the laboratory. The negative control was unmodified blood and the positive control was 50 ml of blood mixed with 13 ml (8 × 10.5 M) of methyl methanesulfonate and incubated for 2 h at 37°C. Each electrophoresis run was considered valid only if the negative and positive controls yielded the expected results. The mean and standard deviation values were as follows: DI of negative control = 13.00 ± 4.6 and DI of positive control: 105.30 ± 22.7.
Comet assay with formamidopyrimidine DNA glycosylase (FPG)
A modified comet assay was performed as described by Azqueta and Collins Reference Azqueta and Collins23 just in peripheral blood. For the measurement of oxidized purines, after the incubation period for lysis, the slides were washed three times with ice-cold buffer (0.1 M KCl, 0.5 mm Na2 EDTA, 40 mm HEPES, and 0.2 mg/ml bovine serum albumin; pH 8.0) and incubated for 40 min at 37°C with FPG (Uniscience®, 1:1000) or buffer. Further steps were performed as mentioned for the comet assay under alkaline conditions (Singh et al. 1988, Tice et al. 2000).
Micronucleus (MN) test
This test was performed according to the guidelines of the GeneTox program of the US Environmental Protection Agency. Reference Mavournin, Blakey, Cimino, Salamone and Heddle24,Reference Krishna and Hayashi25 Bone marrow was extracted from animal femurs, and a smear was deposited directly onto a microscope slide using a drop of fetal calf serum. The slides were subjected to Giemsa staining (5%) then air-dried and coded for blinded analysis. To avoid false negative results and as a toxicity measure, the ratio of polychromatic to normochromatic erythrocytes (PCE:NCE) was determined for 200 erythrocytes per animal. The presence of the MN was determined in 2000 erythrocytes per animal (1000 from each of the two slides) by bright field microscopy (1000× magnification with immersion oil). For individual animals, mean values of MNPCE and MNNCE were used as the experimental units, and variation was based on differences among animals within the same group.
Oxidative stress analyzes in the offspring
Nitrite (NO) concentration
The NO concentration was estimated spectrophotometrically based on NO generation in the liver and hippocampus of the offspring. The homogenate samples were incubated with Griess reagent at room temperature and absorbance was measured at 540 nm using a microplate reader. NO concentration was calculated based on a standard curve from 0 to 100 nm using sodium NO metabolite (NaNO2). The results were expressed as μmol NO/mg protein. Reference Chae, Lee, Kim and Bae26
Sulfhydryl content
The total thiol (sulfhydryl) content was determined in the liver and hippocampus of the offspring using 5,5′-Dithiobis 2-nitrobenzoic acid (DTNB) oxidation as a reference in the liver and hippocampus of the offspring. The reaction was initiated by adding 30 μl of 10 mm DTNB to phosphate-buffered saline. After 30 min incubation at room temperature, absorbance at 412 nm was measured and the amount of 5-thio-2- nitrobenzoic acid formed (equivalent to the thiol group content) was calculated as previously described. Reference Aksenov and Markesbery27
Superoxide dismutase (SOD)
SOD activity was measured in the liver and hippocampus of the offspring via the formation of formazan red through the reaction of the superoxide anion (produced in the medium from a xanthine-xanthine oxidase system) and 2-(4-iodophenyl)-3-(4-nitrophenol)-5-phenyltetrazolium, generating a pink complex that was read at 505 nm. The inhibition of chromogen formation was proportional to the activity of SOD. Reference Bannister and Calabrese28
Protein content
Protein content from homogenates was determined using bovine serum albumin as a standard according to Lowry et al. Reference Lowry, Rosebrough, Farr and Randall29 in the liver and hippocampus of the offspring. Folin phenol reagent (phosphomolybdic-phosphotungstic reagent) was added to bind to the protein. The reagent was slowly reduced, changing the color from yellow to blue. Absorbance was measured at 750 nm.
Statistical analysis
Data are expressed as mean ± standard deviation for the Comet Assay, MN test, food consumption, body weight, lipid profile, and fasting glucose. In oxidative stress analyses, data are expressed as mean ± standard error of the mean. The normality of the data was evaluated using the Bartlett test. Statistical analyses involved nonparametric samples subjected to the Kruskal-Wallis test, followed by Dunn’s post hoc test. One-way analysis of variance (ANOVA) was used for parametric samples, followed by Tukey’s post hoc test. Liquid intake, food intake, total energy consumption, and lipid profile were evaluated using the Kruskal-Wallis test, followed by Dunn’s post hoc test. Body weight, energy efficiency, fasting glucose, Comet assay, MN test, and oxidative stress were analyzed using ANOVA with Tukey’s post hoc test. The level of significance was set at p < 0.05, and statistical analyses were carried out using GraphPad Prism version 5.0 (La Jolla, CA, USA).
Results
Intake of food, total energy consumption, energy efficiency and body weight
After offspring birth, whose mothers received water or fructose (20%/l and 10%/l) during copulation, pregnancy, and lactation, Reference Magenis, Damiani and Marcos14 male and female offspring were subjected to quantification of the parameters of food intake and weight gain until they were 30 days old.
Until the offspring reached 30 days of age, the amount of feed was weighed to determine the food intake (Table 1). Regarding this evaluation of the offspring, there was a significant increase in food consumption in the 10%/l fructose group when compared to the water group for both sexes (p < 0.05).
Intake of food (g), energy efficiency (g/kcal), and total energy consumption (g/kcal) of female and male offspring of fructose-treated female Swiss mice during pregnancy and lactation

Data are expressed as mean ± standard deviation of the mean consumption of food per day (n = 8 animals per group). *Significant difference compared with the control group (p < 0.05, Kruskal-Wallis test, Dunn’s post hoc test). &Significant difference compared with the control group (p < 0.05, ANOVA, Tukey’s post hoc test). #Significant difference compared with the fructose 10%/l group (p < 0.05, ANOVA, Tukey’s post hoc test).
Through the average body weight gain (g) and energy consumption (kcal), the energy efficiency (g/kcal) of offspring was determined (Table 1). No significant differences were found in female and male offspring in the water and 10%/l fructose groups. However, a significant increase in energy efficiency was observed in the 20%/l fructose group compared to the control group and 10%/l fructose group in females (p < 0.05). In males, this difference was found only in the 20%/l group compared to the control group (p < 0.05).
Moreover, through the average food intake and dietary calories per day, the total energy intake (g/kcal) of the offspring was calculated (Table 1). There was a significant increase in consumption in the 10%/l fructose group compared to the control group.
To assess weight gain over time, the offspring were weighed at 7, 14, 21, and 30 days of age (Figs. 2 and 3). In female offspring (Fig. 2), our results showed that at seven days old, there was no statistically significant difference between the groups. However, there was a significant increase in body weight gain in the 20%/l fructose group compared to the control group at 14, 21, and 30 days of age (p < 0.05).
Body weight curve (g) of female offspring of fructose-treated female Swiss mice during pregnancy and lactation. Data are expressed as mean ± standard deviation of mean body weight over different periods (n = 8 animals per group). *Significant difference compared to the control group in the same period (p < 0.05, ANOVA, Tukey’s post hoc test).

Body weight curve (g) of male offspring of fructose-treated female Swiss mice during pregnancy and lactation. Data are expressed as mean ± standard deviation of mean body weight over different periods (n = 8 animals per group). *Significant difference compared to the control group in the same period (p < 0.05, ANOVA, Tukey’s post hoc test).

Male offspring (Fig. 3) showed no significant difference in weight compared to the control group at 7 days old. However, a lifetime increase in body weight was observed in the 10%/l and 20%/l fructose groups compared to the control group at 14, 21, and 30 days (p < 0.05).
Glycemic response
A significant increase in fasting blood glucose was found for the 10%/l fructose group compared to the control group (p < 0.05). However, there was no significant difference between the control and fructose 20%/l groups.
Lipid profile
For offspring lipid profile, blood analyses of total cholesterol, TG, HDL, and the TG:HDL ratio of offspring males and females were performed (Table 2). For total cholesterol, the data did not show statistically significant differences for the offspring of females in either group, but showed a significant increase in males in the 10% fructose group. With regard to HDL levels, only the females from 20%/l fructose group had significantly lower values than the control group (p < 0.05). Regarding TG levels, a significant increase was observed in the 10%/l and 20%/l fructose groups compared to the control group (p < 0.05) in both males and females. And, regarding the TG:HDL ratio (called Castelli index), there was a significant increase in female offspring in the 20%/l fructose group and in male offspring in the 10% fructose group compared to the control group (p < 0.05)
Fasting blood glucose (mg/dL) and lipid profile (total cholesterol, high density lipoprotein, triglycerides, and ratio of triglycerides/high density lipoprotein) of female and male offspring of fructose-treated female Swiss mice during pregnancy and lactation

Data are expressed as mean ± standard deviation of the mean of the fasting blood glucose and total cholesterol of offspring (n = 8 animals per group). HDL, High intensity lipoprotein *Significant difference compared with the control group (p < 0.05, ANOVA, Tukey’s post hoc test). #Significant difference compared with the control group (p < 0.05, Kruskal-Wallis test, Dunn’s post hoc test).
Comet assay
DNA damage in peripheral blood cells, liver, kidney, and brain tissues of the offspring of female mice that received water or fructose (10%/l; 20%/l) during pregnancy and lactation was analyzed using the comet assay in the alkaline and FPG-sensitive versions. When assessing alkaline DNA damage in female offspring, no significant difference was observed between the control and 10%/l fructose groups. However, the 20%/l fructose group showed significantly higher alkaline DNA damage than the control group (p < 0.05). For the comet assay using the FPG enzyme, an increase in the DI was observed in the 20%/l fructose group compared to the control and to the 10%/l fructose group (p < 0.05). No significant differences were found when comparing the control and the 10%/l fructose group (Fig. 4a).
Damage index (0-400) peripheral tissues of 30-day-old female offspring Swiss mice, whose mothers received water or fructose (10%/l; 20%/l) during pregnancy and lactation. Data are expressed as mean ± standard deviation (n = 8 animals per group). (a) Peripheral blood; (b) liver; (c) kidney. *Significant difference compared to control group (p < 0.05, ANOVA, Tukey’s post hoc test). #Significant difference in relation to fructose 10%/l group (p < 0.05, ANOVA, Tukey’s post hoc test).

For the DI of the liver (Fig. 4b) and kidneys (Fig. 4c) of the female offspring determined by the alkaline comet assay, a significant increase in DNA damage in the 10%/l and 20%/l fructose groups was found compared to the control group (p < 0.05). The same was observed for brain tissues, demonstrating an increase in DNA damage in the 10%/l and 20%/l fructose groups compared to the control group in the cortex (Fig. 5a), hippocampus (Fig. 5b), and striatum (Fig5. c) (p < 0.05).
Damage index (0-400) brain tissues of 30-day-old female offspring Swiss mice, whose mothers received water or fructose (10%/l; 20%/l) during pregnancy and lactation. Data are expressed as mean ± standard deviation (n = 8 animals per group). (a) Cortex; (b) Hippocampus; (c) Striatum. *Significant difference compared to control group p< 0.05 (ANOVA followed by Tukey’s post hoc test).

The comet assay was also performed for the peripheral blood cells of male offspring (Fig. 6a) via the alkaline and oxidative comet assay. In the alkaline comet assay, there was a significant increase in DNA damage in the 10%/l fructose group compared to the control group (p < 0.05). In the 20%/l fructose group, the results showed a significant increase compared to the control group and to the 10%/l fructose group (p < 0.05). In the FPG-sensitive sites, no significant differences were found between the control and the 10%/l fructose group. However, the 20%/l fructose group showed a significant increase in DNA damage compared to the control group (p < 0.05).
Damage index (0-400) peripheral tissues of 30-day-old male offspring Swiss mice whose mothers received water or fructose (10%/l; 20%/l) during pregnancy and lactation. Data are expressed as mean ± standard deviation (n = 8 animals per group). (a) Peripheral blood; (b) liver; (c): kidney. *Significant difference compared to control group (p < 0.05, ANOVA, Tukey’s post hoc test). #Significant difference from the fructose 10%/l group (p < 0.05, ANOVA, Tukey’s post hoc test).

In relation to the alkaline comet assay in the liver (Fig. 6b) and kidney (Fig. 6c) of male offspring, a significant increase in DNA damage in the 10%/l and 20%/l fructose groups was identified comparing the control group (p < 0.05). The same was found for brain tissues, demonstrating an increase in DNA damage in the 10%/l and 20%/l fructose groups compared to the control group in the cortex (Fig. 7a), hippocampus (Fig. 7b), and striatum (Fig . 7c) (p < 0.05).
Damage index (0-400) brain tissues of 30-day-old male offspring Swiss mice, whose mothers received water or fructose (10%/l; 20%/l) during pregnancy and lactation. Data are expressed as mean ± standard deviation (n = 8 animals per group). (a) Cortex; (b) Hippocampus; (c) Striatum. *Significant difference compared to control group p < 0.05 (ANOVA followed by Tukey’s post hoc test).

Micronucleus test
The MN test evaluated whether fructose consumption during pregnancy and lactation was able to cause mutagenic effects in the offspring. Table 3 presents the results of this test in female and male offspring.
Number of micronucleated polychromatic erythrocytes (MNPCE) and micronucleated normochromatic erythrocytes (MNNCE) in samples of bone marrow from female and male offspring of 30-day-old Swiss mice whose mothers received water or fructose during pregnancy and lactation

Data are expressed as mean ± standard deviation of 2000 cells per sample. No significant differences were found between groups.
The results showed that no significant differences were found in female and male mice whose mothers received water or fructose during pregnancy and lactation in relation to the control group for the two evaluated cell types (PCE and NCE). The same results were observed in relation to the PCE/NCE ratio (Table 3). No statistical differences were observed between groups.
Nitrite concentration
NO levels were observed as oxidation production parameters in the liver and hippocampus of the female and male offspring. In the liver of female offspring (Fig. 8a), a significant increase was observed in both fructose groups (10%/l and 20%/l) compared to the control group (p < 0.05). In the liver of male offspring (Fig. 8b), only the 10%/l fructose group showed a significant increase compared to the control group (p < 0.05). In both female and male offspring hippocampus (Fig. 8c and d), no significant difference between groups was observed.
Nitrite concentration in the liver and hippocampus of 30-day-old female and male offspring Swiss mice, whose mothers received water or fructose (10%/l; 20%/l) during pregnancy and lactation. Data are expressed as mean ± standard error of the mean (n = 6 animals per group). (a) Liver of offspring female; (b) Liver of offspring male; (c) Hippocampus of offspring female; (d) Hippocampus of offspring male. *Significant difference in relation to the control group p < 0.05 (ANOVA followed by Tukey’s post hoc test).

Sulfhydryl content
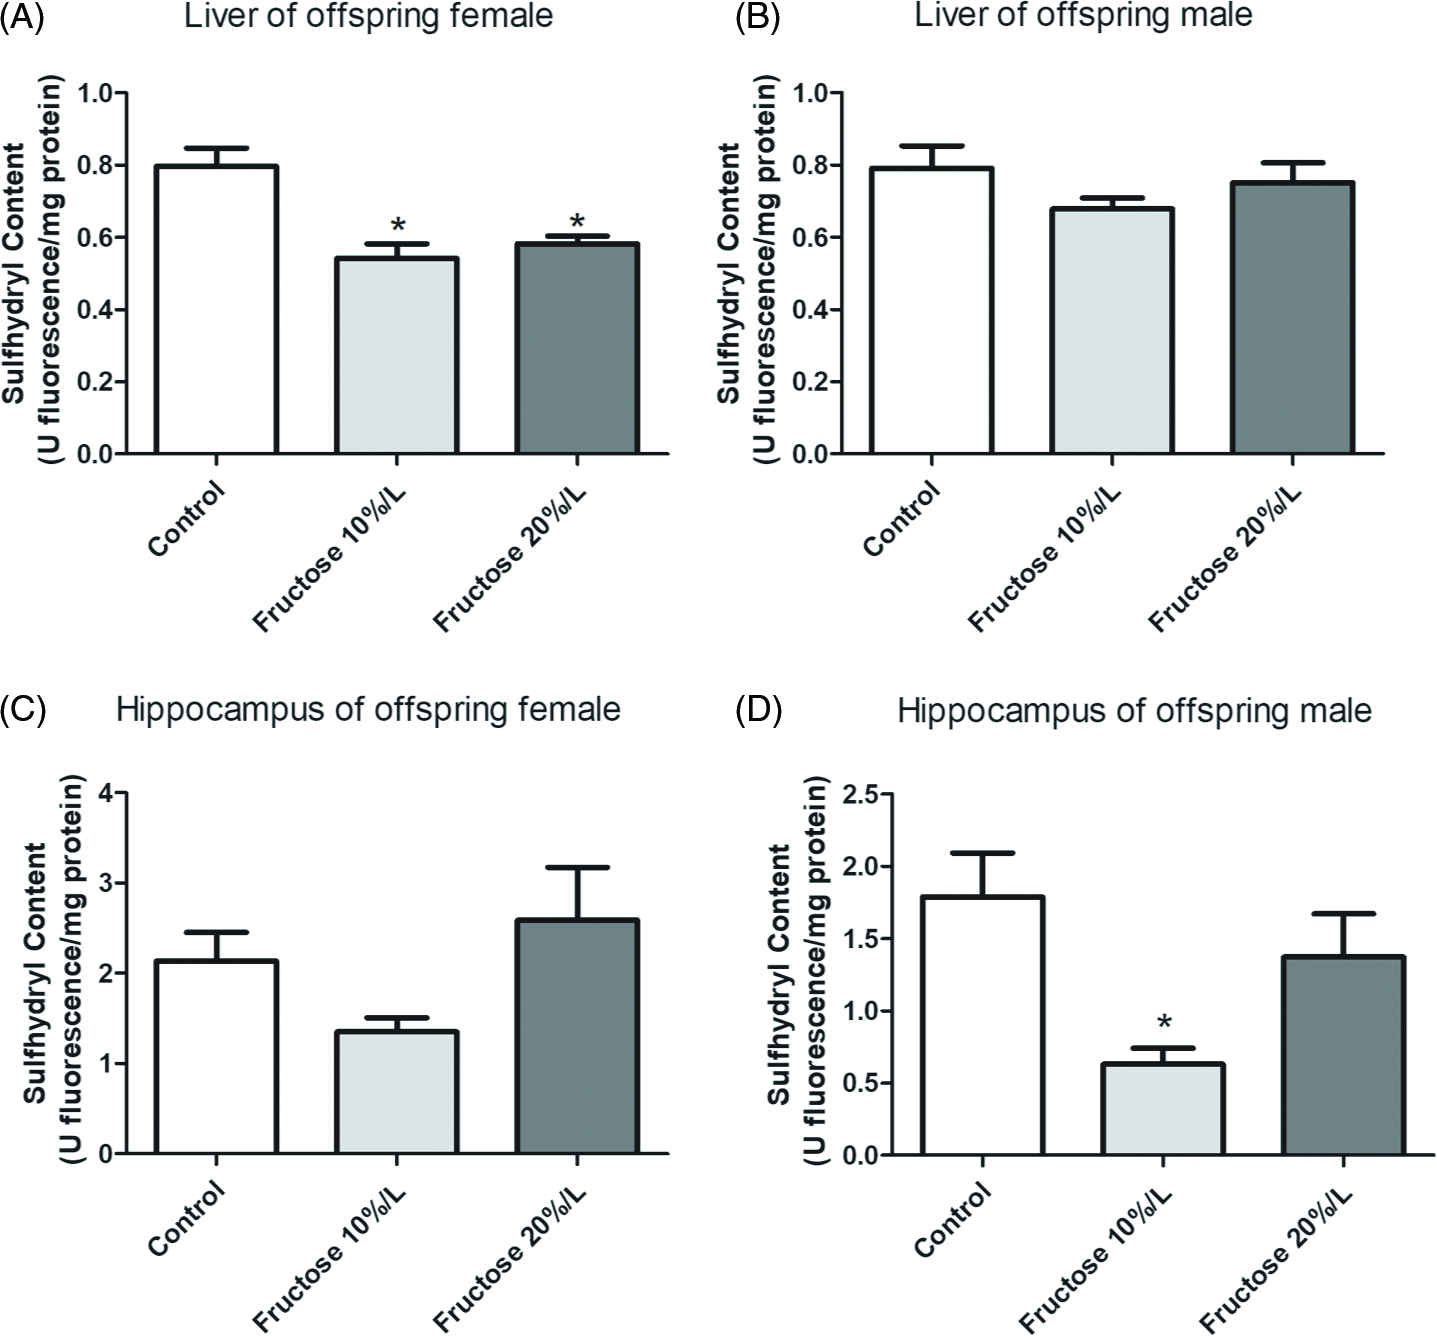
Sulfhydryl group content was used as an oxidative damage marker. Female offspring liver (Fig. 9a) showed a significant decrease in 10%/l and 20%/l fructose groups compared to the control group (p < 0.05). In addition, in male offspring liver (Fig. 9b) no significant differences between groups were observed. In the hippocampus of the female offspring (Fig. 9c) no significant difference was observed between groups; however, the hippocampus of the male offspring (Fig. 9d) showed significant decreases in the 10%/l fructose group compared to the control group (p < 0.05).
Sulfhydryl content in the liver and hippocampus of 30-day-old female and male offspring Swiss mice, whose mothers received water or fructose (10%/l; 20%/l) during pregnancy and lactation. Data are expressed as mean ± standard error of the mean (n = 6 animals per group). (a) Liver of offspring female; (b) Liver of offspring male; (c) Hippocampus of offspring female; (d) Hippocampus of offspring male. *Significant difference compared to control group p < 0.05 (ANOVA followed by Tukey’s post hoc test).
Superoxide dismutase
SOD activity was also measured as a parameter of the antioxidant system. In the liver of female and male offspring (Fig. 10a and b), a decrease in SOD activity was observed in fructose 10%/l and 20%/l groups compared to the control group (p < 0.05). The same results were observed in the hippocampus of female and male offspring (Fig. 10c and b), where fructose 10%/l and 20%/l groups showed a significant decrease compared to the control group (p < 0.05).
Superoxide dismutase activity in the liver and hippocampus of 30-day-old female and male offspring Swiss mice whose mothers received water or fructose (10%/l; 20%/l) during pregnancy and lactation. Data are expressed as mean ± standard error of the mean (n = 6 animals per group). (a) Liver of offspring female; (b) Liver of offspring male; (c) Hippocampus of offspring female; (d) Hippocampus of offspring male. *Significant difference compared to control group p < 0.05 (ANOVA followed by Tukey’s post hoc test).

Discussion
Metabolic programming during pregnancy and lactation can generate a healthy or unhealthy environment for offspring. Metabolic programming is an adaptive response of the organism to the environment; this ability is called “development plasticity” that allows the development of a spectrum of phenotypes from a single genotype. Reference Gluckman and Hanson30 In this study, we were able to observe the change in weight induced by fructose in offspring that received fructose indirectly. Moreover, increased DNA damage in peripheral blood, liver, kidney, and brain tissues, and changes in nitrite concentration, sulfhydryl content, and superoxide dismutase were observed.
In our study, we observed that the offspring of female mice that received high doses of fructose during gestation and lactation consumed more food than control animals; therefore, there was an increase in total energy consumption in the fructose group (10%/l) compared to the control group. In addition, the energy efficiency of these animals was high, mainly due to the average body weight of animals of both sexes that received fructose, which was high throughout life, requiring an increase in energy activity. Maternal obesity and gestational diabetes have caused long-term changes in the systems that regulate the energy balance in the offspring. An increase in childhood obesity and diabetes in children is often attributed to an increase in high-caloric diets and reduced physical exercise. However, it is believed that early dietary changes, both in mothers and offspring, significantly contribute to the treatment of these pathologies. Reference Frias and Grove31 It is important to consider that early exposure to fructose can determine long-term susceptibility to metabolic diseases. Maternal nutrition can strongly influence the health of the offspring in adult life as maternal obesity impairs glucose metabolism and hyperglycemia in offspring. Reference Magenis, Damiani and Marcos14 The experimental model of this work was carried out in female mice that received water or fructose (10 and 20%/l) during the period of copulation, pregnancy, and lactation and during this period, we observed that females that received fructose showed an increase in food consumption and caloric intake. Reference Magenis, Damiani and Marcos14 As the same was verified in the results of the offspring of these females, an energetic metabolic programming is evidenced.
Through our results, we observed that the offspring of female mice that showed an increase in food consumption and body weight were born with the appropriate weight. However, throughout life, they acquired greater weight gain compared to control animals until they reached 30 days old. In a review of the literature, we found a paper from Ravelli et al. Reference Ravelli, Stein and Susser32 that demonstrated that metabolic changes in pregnancy and postnatal environment influence the weight and energy of offspring in adulthood. Interestingly, the uterine environment can influence offspring taste preferences and thus affect the consumption of a healthy diet. The flavors of the maternal diet are found in the amniotic fluid and, consequently, are ingested by the fetus; therefore, flavors experienced in the intrauterine period determine a preference that persists in childhood and even into adulthood with possible complications, such as type 2 diabetes mellitus and obesity. Reference Trout and Wetzel-Effinger33 We observed in our results an alteration in the offspring’s fasting glycemia.
These results found in the offspring corroborate the results found in female mice in our previously published work since nutritional and biochemical alterations were found in females during pregnancy and lactation, with obesity and maternal hyperglycemia outcomes. Reference Magenis, Damiani and Marcos14 Likewise, Yamamoto et al. Reference Ornellas, Carapeto, Aguila and Mandarim-de-Lacerda37 observed a relationship between the glycemic profile of mothers in relation to their children and dietary interventions modified during pregnancy, which favorably influenced the results related to maternal blood glucose and birth weight of the children.
There is also a relationship between high fructose consumption and metabolic syndrome. Among the components of the metabolic syndrome, according to the NCEP-ATP III (National Cholesterol Education Program’s Adult Treatment Panel III), are abdominal obesity by waist circumference (Men > 102 cm; Women > 88 cm); TGs ≥ 150 mgdl; HDL cholesterol (men < 40 mgdl; women < 50 mgdl), blood pressure (≥ 130 mmHg or ≥ 85 mmHg), and fasting blood glucose ≥ 110 mgdl. Metabolic syndrome occurs when three of these five criteria are present. 19 Thus, in this study, we observed an increase in TG and fasting glucose levels in female mice who consumed fructose during pregnancy and in their respective offspring: an increase in blood glucose (both males and females), low HDL (females), and an increase in TGs (males and females), thus, indicating characteristics of metabolic syndrome in the female offspring. According to Lee et al., Reference Lee, Wu, Leu and Tain34 the excessive fructose consumption early through lactation or feeding is a risk factor for the onset of metabolic syndrome and dysfunctions in multiple tissues and organs in adulthood, which corroborates our findings.
In a previous study similar to this study, Rodríguez et al. Reference Rodríguez, Panadero and Rodrigo35 evaluated the effects of fructose consumption during pregnancy in relation to the lipid profile in female offspring. They used female mice with high fructose intake (10%l in drinking water) for three weeks during pregnancy and evaluated the effects on female offspring, and observed elevations in TGs and the appearance of hepatic steatosis. This may have happened only in females, as in this study, due to the expression and activity of the carbohydrate-responsive element-binding protein, a lipogenic transcription factor, whose levels are higher in females than in males. Therefore, maternal fructose intake can influence the response of adult female offspring to fructose and, thus, induce metabolic imbalances, as found in the study of the mothers of these offspring. Reference Magenis, Damiani and Marcos14 Similarly, Abe et al. Reference Abe, Yamamoto, Konishi, Takahashi and Oishi36 suggest that maternal diet rich in fructose in newborn mice leads to the suppression of lipogenic gene expression in postpartum mouse livers. However, these analyses were not performed in this work.
Different from our results, Ornellas et al. Reference Ornellas, Carapeto, Aguila and Mandarim-de-Lacerda37 observed gender-related changes and markers of high cardiovascular risk in the progeny of father, mother, or father and mother who consumed a high fructose diet, as they negatively affected adipokines concentrations, blood pressure, and uric acid in the offspring, males being more affected than females.
The increased use of refined foods that are rich in fructose is of particular concern in children and adolescents since total caloric intake and the prevalence of metabolic syndrome are continually increasing in these populations. Reference Crescenzo, Cigliano and Mazzoli38 However, which fetal programming mechanism is induced by high levels of maternal fructose intake, with the appearance of metabolic syndrome in the offspring, is still under speculation. The adverse effects of fructose feeding depend on the amount and duration of its consumption. Reference Ornellas, Carapeto, Aguila and Mandarim-de-Lacerda37
The data from this study may be associated with the metabolic changes previously mentioned. Crescenzo et al. Reference Toop and Gentili39 suggested that an increase in fructose intake in young rats is associated with inflammation, increased TNF-α factor, and oxidative stress, in addition to DNA damage. This is consistent with our results since the offspring showed increased DNA damage in peripheral blood in the groups that received fructose from the mother, in both alkaline and oxidative comet assays. However, our results do not suggest mutagenic potential in the offspring. Reference Ross and Canovas40
According to Carapeto et al., Reference Carapeto, Ornellas, Mandarim-de-Lacerda and Aguila41 the consumption of a diet rich in fructose (45%) by the mother and/or father is associated with adverse effects on the liver metabolism of their offspring. In fact, in this work an increase in DNA damage was observed in the livers of offspring that received fructose (10%/l and 20%/l) in utero and through breast milk. Much of the fructose metabolism occurs in the liver (50–75%) and the rest in the kidneys and adipocytes. Reference Tappy and Lê4 Therefore, it is suggested that high doses of fructose overload intestinal absorption and fructose clearance, affecting the liver. Reference Jang, Hui and Lu42
In addition, Zhao et al. Reference Zhao, Yu and Yang43 showed that high fructose intake can decrease the erythroid nuclear factor 2 related to factor 2, which plays a role in regulating the expression of antioxidant enzymes, causing inflammation and oxidative stress in the liver. This result is worrying, as it demonstrates that dietary conditions during pregnancy alter maternal hepatic metabolism, causing metabolic and genetic abnormalities in the offspring, including hyperglycemia, oxidative stress, dyslipidemia, and DNA damage. Reference King44 These data corroborate those previously found in the mothers of the offspring in this study since they also showed DNA damage and glycemic alterations during pregnancy and lactation. Reference Magenis, Damiani and Marcos14
Similar to our findings, Yamada-Obara et al., Reference Yamada-Obara, Yamagishi and Taguchi45 using a high fructose and fat diet in female rats for six weeks before copulation and maintaining this diet during pregnancy and lactation, demonstrated high levels of adiponectin, renal weight, and oxidative stress, with kidney damage and metabolic imbalances in the offspring. A high fructose diet in young animals is believed to cause liver disorders, with increased levels of TGs and low levels of antioxidants. Reference Zaki, Fattah and Hassan46 This is in agreement with our results, which showed that the offspring had a liver imbalance, identified through the analysis of the lipid profile, and increased levels of TGs, which may be associated with increased DNA damage in animals, as hyperlipidemia can lead to oxidative stress, which in turn leads to DNA damage. Reference Dos Santos, Oliveira, Moreli and Benite-Ribeiro47
We can observe with the results these offspring that there was a maternal metabolic programming through the consumption of fructose by mothers during the period of pregnancy and lactation, as observed in the first study (see Magenis et al. Reference Magenis, Damiani and Marcos14 ). This seems to be the key point of the metabolic programming observed in our work, leading to genetic and biochemical changes in offspring. Corroborating these findings, Talton et al., Reference Talton, Bates, Salazar, Ji and Schulz48 observed that maternal hyperglycemia alters the lipid metabolism of offspring and the susceptibility to obesity in mice.
In our study, the low activity of antioxidants enzymes led to the progressive production of ROS and, consequently, oxidative damage. The same results were observed by Vitaglione et al., Reference Vitaglione, Morisco, Caporaso and Fogliano49 in which an imbalance in oxidative stress affected the transcription of numerous biochemical mediators, which led to of modulation the tissue and cellular events, such as apoptosis, necrosis and fibrosis, which in turn are present in different types of liver diseases. A study by Gutiérrez-Camacho et al. Reference Gutiérrez-Camacho, Kormanovski, Castillo-Hernández, Guevara-Balcázar and Lara-Padilla50 using diet-induced diabetes showed an increase in NO content and elevated levels of nitrosative stress, suggesting that any increased elimination of NO by superoxide is offset by an increase in its production in this animal model. Furthermore, excessive NO production can disturb the physiological balance between the generation of peroxynitrite, antioxidant defense mechanisms, and signaling pathways involving NO in different tissues. Reference Gutiérrez-Camacho, Kormanovski, Castillo-Hernández, Guevara-Balcázar and Lara-Padilla50 In this study, a high fructose consumption caused an oxidative state in the offspring’s liver, demonstrated by an increase in NO and a low content of sulfhydryl. Although these changes (NO and SH) were more present at the dose of 10%/l of fructose, we can take into account that both doses caused DNA damage and that despite this difference was not statistically significant at both doses in relation to the control group, we observed that, regardless of the dose, fructose can cause this imbalance in the offspring. We recognize that this difference found only at the 10%/l dose is a limitation of our study.
High fructose intake can cause insulin resistance, which in turn can increase the risk of developing neurodegenerative diseases, such as dementia and Alzheimer’s disease. Reference Mastrocola, Nigro, Cento, Chiazza, Collino and Aragno51 In the present study, it was observed that, in addition to peripheral tissues, there were an increase in DNA damage in the cortex, hippocampus and striatum in the mice whose mothers received the fructose doses, in both sexes. In brain cells, there is an association between high consumption of sucrose (a disaccharide formed by glucose and fructose) and increased levels of DNA damage, suggesting that DNA glycation reactions by fructose may be responsible for the damage found in brain cells in the present work. Reference Franke, Molz, Mai, Wanger, Zenkner, Horta and Prá52 Corroborating this, Yamazaki et al. Reference Yamazaki, Yamada and Munetsuna53 found that excessive maternal fructose consumption impairs hippocampal function in offspring via epigenetic modification in brain-derived neurotrophic factor (BDNF) gene expression. Reference Yamazaki, Yamada and Munetsuna53
The hippocampus was the most affected area with reduced antioxidant activity and sulfhydryl content, leading to increased oxidative damage. Pérez-Corredor et al., Reference Yamazaki, Yamada and Munetsuna53 analyzing the effect of obesity induced by a high fructose diet on the brain of rats observed high levels of pro-inflammatory cytokine IL-1β levels, decreased BDNF, altered microtubule structure and increased hyperphosphorylated tau, leading to neuronal loss and progressive oxidative stress. Reference Pérez-Corredor, Gutiérrez-Vargas, Ciro-Ramírez, Balcazar and Cardona-Gómez54 Similarly, Abe et al. Reference Abe, Yamamoto, Konishi, Takahashi and Oishi36 observed that a maternal diet rich in fructose induced remarkable mRNA expression of the lipogenic genes Srebf1, Fasn, Acc1, Scd1, and Acly in the postpartum mouse. However, these analyses were not performed in the present work. These findings corroborate our findings, suggesting that high fructose consumption affects brain structures, especially the hippocampus.
Conclusion
In conclusion, it is suggested that the high consumption of fructose during pregnancy and lactation in female mice is harmful to offspring (male and female) due to genetic, metabolic, and nutritional changes. Thus, with this study we can suggest the need for further studies that seek to address analyses at the molecular level of pregnant and lactating women, as well as their offspring, on fructose consumption during pregnancy for better guidance on the consumption of this carbohydrate during this period. Likewise, we carry out nutritional interventions that seek to prevent the metabolic changes induced by fructose during this period. Finally, this work has some limitations, as no analyses of insulin, hormones and adipokines were performed.
Acknowledgements
The authors would like to thank the Graduate Program in Health Sciences (PPGCS), Coordination for the Improvement of Higher Education Personnel (CAPES), National Council of Technological and Scientific Development (CNPq – 304203/2018-1); Santa Catarina Research and Innovation Support Foundation (FAPESC); and the University of Southern Santa Catarina (UNESC).
Financial Support
This work was not funded.
Conflicts of Interest
The authors report no conflict of interest.



