

INTRODUCTION
Alluvial fans are dynamic sediment bodies, whose morphology and stratigraphy reflect the climatic and tectonic conditions during their formation (Bull, Reference Bull1977; Blair and McPherson, Reference Blair and McPherson1994; Dorsey et al., Reference Dorsey, Umhoefer and Falk1997; Harvey et al., Reference Harvey, Wigand and Wells1999). Among the geomorphological parameters that may change during the evolution of an individual fan are its radial length, the slope of the fan surface and the source area, and the location of the active fan toe (Oguchi and Ohmori, Reference Oguchi and Ohmori1994; Humphrey and Heller, Reference Humphrey and Heller1995; Densmore et al., Reference Densmore, Allen and Simpson2007). Alluvial fans are often segmented into different depositional lobes that may differ in age and in the environmental conditions under which they were deposited (Bull, Reference Bull1964; Blair and McPherson, Reference Blair and McPherson1998). Parameters that control the sedimentologic inventory of a fan include the lithology in the source area, the grain size, and the sediment transport and storage regime (e.g., Bull Reference Bull1962; Dade and Friend, Reference Dade and Friend1998; Paola et al., Reference Paola, Heller and Angevine1992; Blair, Reference Blair1999). The strong dependence of the fan characteristics on environmental boundary conditions makes alluvial fans unique recorders of climatic and tectonic changes (Bull, Reference Bull1977; Blair and McPherson, Reference Blair and McPherson1994; Dorsey et al., Reference Dorsey, Umhoefer and Falk1997; Harvey et al., Reference Harvey, Wigand and Wells1999).
To quantify the relationships between fan morphology and the parameters controlling fan evolution, Densmore et al. (Reference Densmore, Allen and Simpson2007) applied a model of an individual coupled catchment-fan system and varied, among other parameters, fault slip and precipitation rates. Their results showed that in periods with higher precipitation rates, the sediment yield from the source area was high and the fan lobe deposited during this period had a larger spatial extent but a lower slope. In contrast, a decrease in precipitation and hence sediment yield from the catchment will lead to deposition of smaller fan lobes with higher slope angles (Densmore et al., Reference Densmore, Allen and Simpson2007). Despite the first-order control of environmental conditions on fan formation, the actual shape and architecture of a natural fan may be affected by autogenic processes that determine, for example, the distribution and activity of channels and lobes (e.g., Ventra and Nichols, Reference Ventra and Nichols2014).
Linking fan stratigraphy and changes in fan morphology to tectonic events or regional climate variations requires age constraints for the fan surface and interior. Such age data are particularly important against the background that often fan formation cannot be unequivocally correlated with a climatic event because fan aggradation may, in principle, occur during dry and wet periods as well as during wet-dry and dry-wet transitions (e.g., Harvey et al., Reference Harvey, Mather and Stokes2005; Dorn, Reference Dorn2009; Meinsen et al., Reference Meinsen, Winsemann, Roskosch, Brandes, Frechen, Dultz and Böttcher2014). Depositional units in fan interiors have been dated using 14C or luminescence dating (Roskosch et al., Reference Roskosch, Tsukamoto, Meinsen, Frechen and Winsemann2012; Chiverrell and Jakob, Reference Chiverrell and Jakob2013; Lang, Reference Lang2013; Meinsen et al., Reference Meinsen, Winsemann, Roskosch, Brandes, Frechen, Dultz and Böttcher2014; Cable et al., Reference Cable, Christiansen, Westergaard-Nielsen, Kroon and Elberling2018). Age constraints for fan surfaces are generally more difficult to obtain as their preservation is limited by the shifts of the active channels, which may lead to erosion or burial of older fan surfaces. Such buried older fan surfaces may be detectable by ground penetrating radar (Hornung et al., Reference Hornung, Pflanz, Hechler, Beer, Hinderer, Maisch and Bieg2010; Franke et al., Reference Franke, Hornung and Hinderer2014). In arid regions, relative ages for the different parts of a fan surface may be derived from the degree of desert varnish development (Bull, Reference Bull1991) or differences in the surface roughness (Regmi et al., Reference Regmi, McDonald and Bacon2014). Numerical ages of fan surfaces may be obtained, for example, from cosmogenic nuclide exposure dating of debris flow boulders (e.g., Dühnforth et al., Reference Dühnforth, Densmore, Ivy-Ochs, Allen and Kubik2007; Ivy-Ochs et al., Reference Ivy-Ochs, Dühnforth, Densmore and Alfimov2013). This method was successfully applied to alluvial fans in semiarid or arid regions, including the Owens Valley and Death Valley in California (Dühnforth et al., Reference Dühnforth, Densmore, Ivy-Ochs, Allen and Kubik2007, Reference Dühnforth, Densmore, Ivy-Ochs, Allen and Kubik2017) and the Atacama Desert (Cesta and Ward, Reference Cesta and Ward2016). Fans in humid regions were studied, for example, with respect to their slopes (e.g., Saito and Oguchi, Reference Saito and Oguchi2005), but only few studies determined absolute fan surface ages (e.g., Bellier et al., Reference Bellier, Bourlès, Beaudouin and Braucher1999; Jennings et al., Reference Jennings, Bierman and Southon2003) or combined exposure ages with fan volume estimates (Schürch et al., Reference Schürch, Densmore, Ivy-Ochs, Rosser, Kober, Schlunegger, McArdell and Alfimov2016).
When constraints on both fan volume and age are available, this information can be used to quantify changes in sedimentation (Hornung et al., Reference Hornung, Pflanz, Hechler, Beer, Hinderer, Maisch and Bieg2010) and erosion rates, which is usually only possible from marine or lake records (e.g., for tropical Andean lakes: Mourguiart et al., Reference Mourguiart, Corrège, Wirrmann, Argollo, Montenegro, Pourchet and Carbonel1998; Rodbell et al., Reference Rodbell, Seltzer, Mark, Smith and Abbott2008). The temporal evolution of sedimentation and erosion rates derived from alluvial fans can ultimately be correlated with the regional climate history to investigate, for example, the relationships between variations in precipitation and sedimentation rates in natural fan systems. In formerly glaciated regions, paraglacial processes (i.e., fan formation in response to high sediment availability and slope failure during deglaciation) may also play a significant role (Church and Ryder, Reference Church and Ryder1972; Hinderer, Reference Hinderer2001).
Here we present a new data set comprising 10Be exposure ages from boulders on fan surfaces, catchment-wide 10Be erosion rates, and 14C ages from the fan interior for two alluvial fans in the Cordillera Oriental, Peru. Our motivation to carry out this study is a lack of data on alluvial fan evolution in this region, the good preservation of the fans, the presence of datable quartz-rich boulders on the fan surfaces, and the opportunity to correlate the fan deposition history with a well-constrained regional climate record. Fans located at lower elevations in this region are less well preserved because of higher rainfall, more vegetation, and agricultural land use. Furthermore, the studied fans are located in valleys that have been cleaned out by glaciers during the last glacial maximum (LGM), which allows an estimation of the post-LGM sediment volume. Finally, major lakes and palaeolakes in this part of the Andes, whose late Pleistocene-Holocene lake-level variations are well documented (Lake Titicaca and Palaeolake Tauca), offer the opportunity to correlate our results with the regional climate record. Our data show that the two studied fans are postglacial in age and that sediment deposition was largely completed by ∼10 ka. By comparing our results for the fan sedimentation history with regional climate records from the tropical Andes, we infer the main controls on alluvial fan and catchment dynamics.
GEOMORPHOLOGICAL AND GEOLOGIC SETTING OF THE STUDY AREA
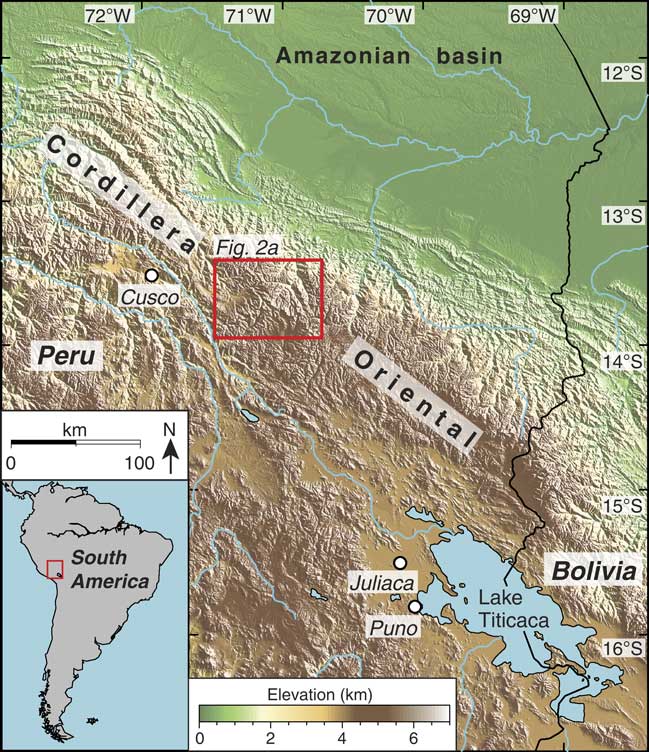
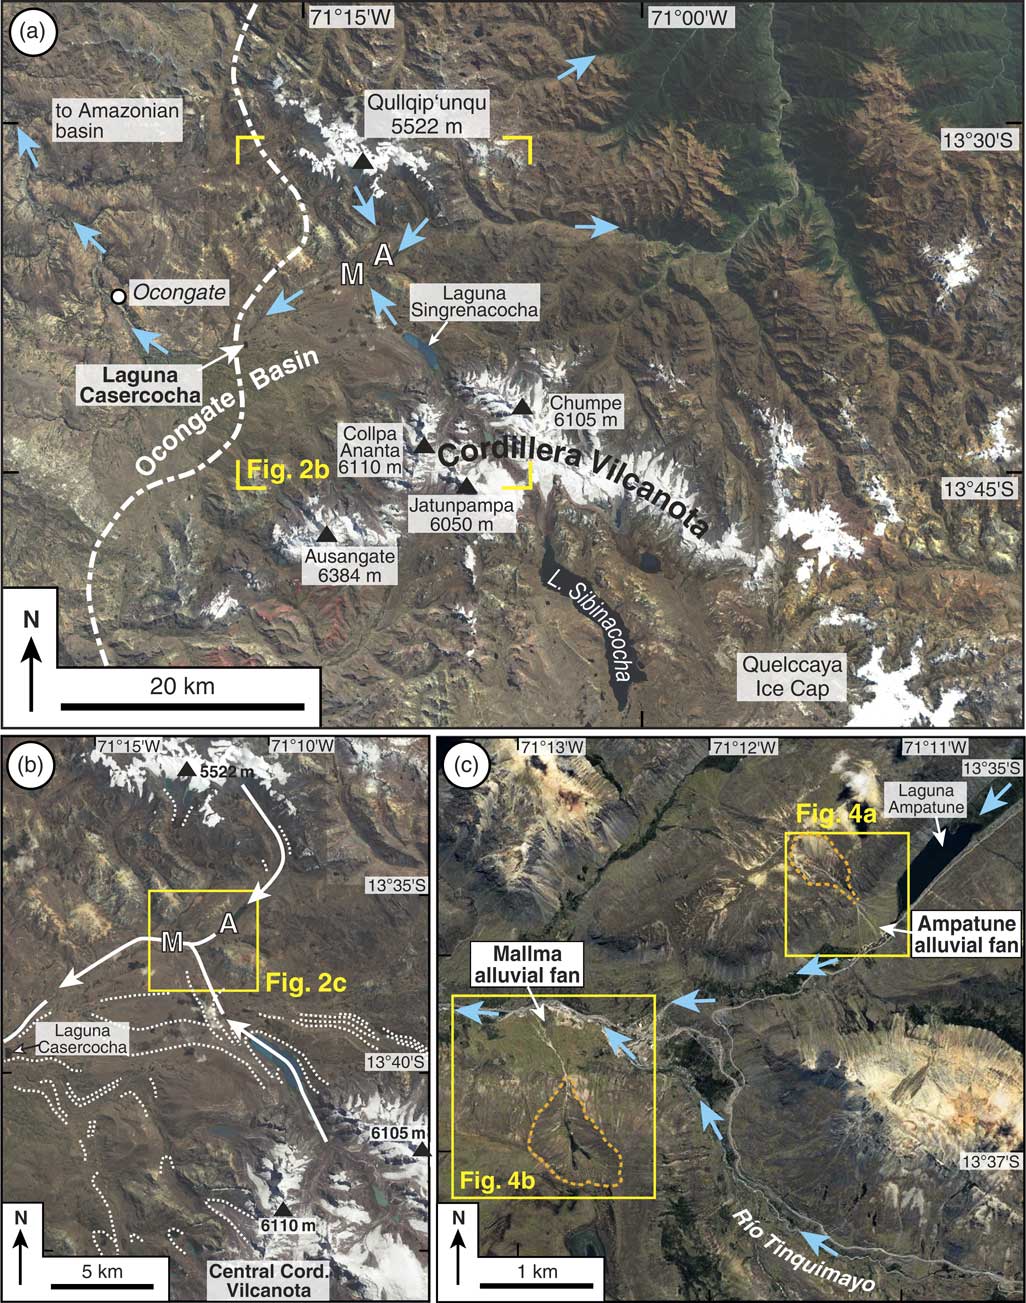
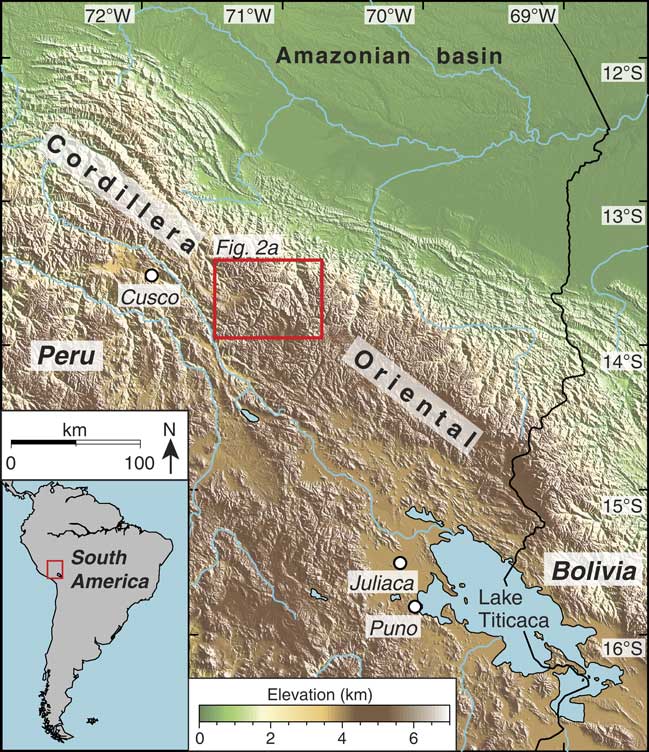
Our study area is located in the Peruvian segment of the Andean mountain chain, approximately 300 km northwest of Lake Titicaca and 80 km east of the town of Cusco (Fig. 1). There, we studied two alluvial fans (hereafter called Ampatune and Mallma fans), which are situated at the northern margin of the Ocongate basin (Fig. 2a) at altitudes of ∼4300 and ∼4150 m above sea level, respectively (Fig. 2b). The study area receives an annual precipitation of about 800 mm and has a mean annual temperature of 6°C (Servicio Nacional de Meteorología e Hidrología del Perú, 2017). Because of these climate conditions and the high altitude, the vegetation on the two studied fans is limited to grasses and mosses. Today, two glaciated areas still exist in the region, one surrounding the Qullqip’unqu mountain (5522 m) and the other in the Cordillera Vilcanota, which includes the Quelccaya Ice Cap (Fig. 2a).
Topographic map of the Cordillera Oriental, Peru. Red box outlines the area of the satellite image shown in Figure 2a. (For interpretation of the references to colour in this figure legend, the reader is referred to the web version of this article.)
Satellite images of the study area and adjacent regions. (a) Cordillera Vilcanota and surrounding regions with the locations of the studied Ampatune (A) and Mallma (M) alluvial fans. Dashed white line indicates western margin of the last glacial maximum (LGM) ice extent from Ehlers et al. (Reference Ehlers, Gibbard and Hughes2011). Blue arrows indicate flow directions of selected rivers. Corners of yellow box indicate area shown in panel (b). (b) Region between the central Cordillera Vilcanota and the Qullqip’unqu mountains with formerly glaciated valleys and the Ampatune (A) and Mallma (M) fans. Spatial distribution of moraines (dotted white lines) is based on the 1:100,000 scale geologic map of Audebaud and Vargas (Reference Audebaud and Vargas1998); the maps shown in Goodman et al. (Reference Goodman, Rodbell, Seltzer and Mark2001), Mark et al. (Reference Mark, Seltzer, Rodbell and Goodman2002), and La Frenierre et al. (Reference La Frenierre, Huh and Mark2011); and our own field observations. White arrows indicate flow directions of LGM glaciers in those valleys where the Mallma and Ampatune fans have formed after the LGM. Yellow box indicates area shown in panel (c). (c) The study area with the Ampatune and Mallma alluvial fans. Dashed orange lines mark the boundaries of the respective Ampatune and Mallma catchments. Blue arrows indicate flow directions of rivers in the valleys with the studied fans (see also Fig. 3a). Yellow boxes outline the areas with the two fans shown in Figure 4. (For interpretation of the references to colour in this figure legend, the reader is referred to the web version of this article.)
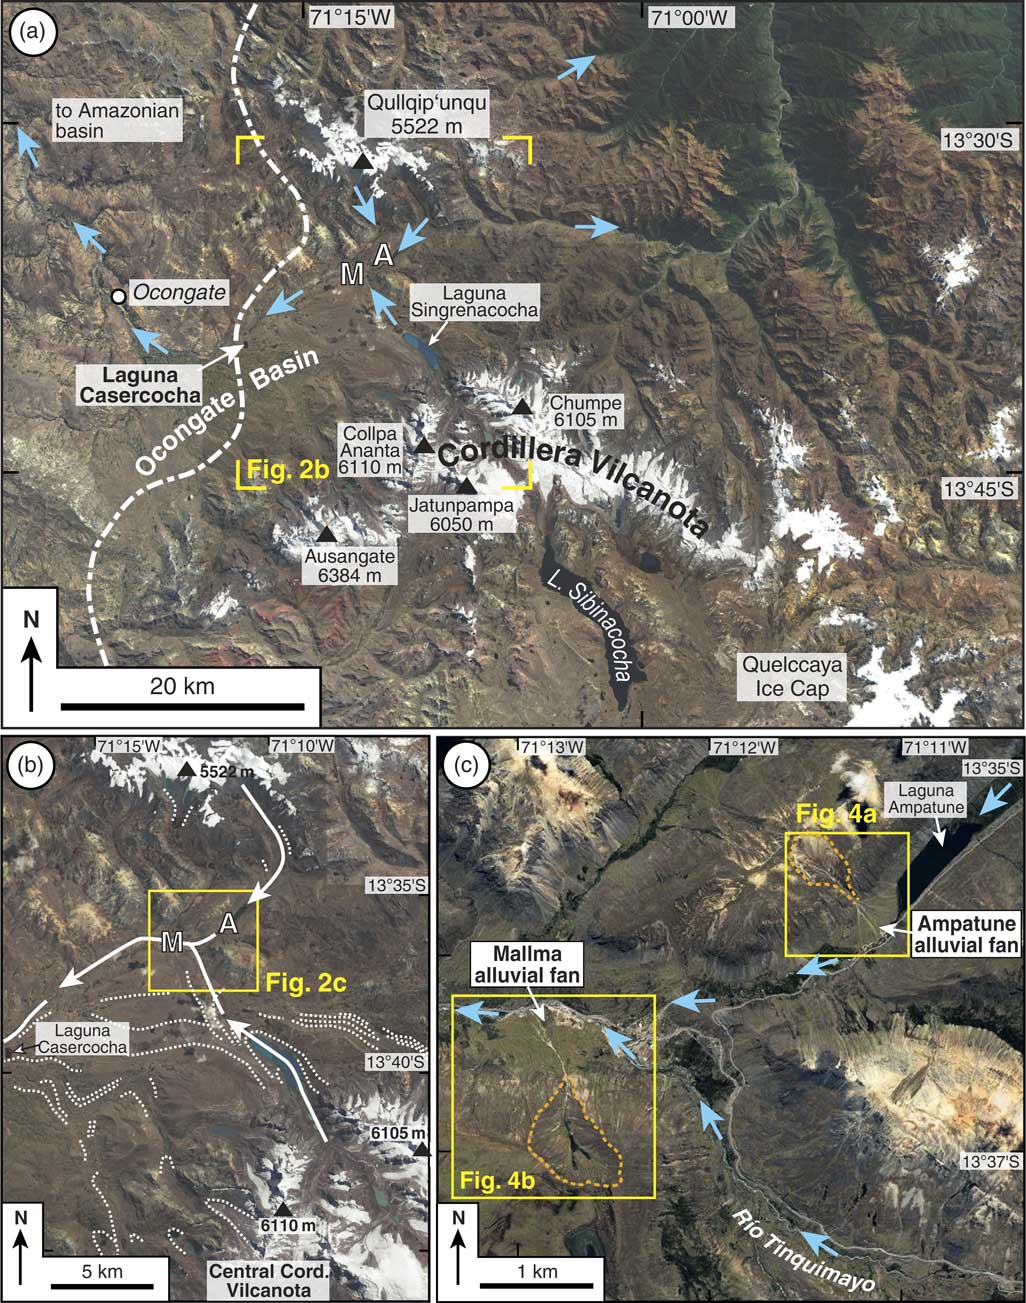
The Ampatune alluvial fan has a surface area of ∼0.25 km2 and is located downstream of the Laguna Ampatune (Figs. 2c, 3a). The fan has dammed the river, which flows from the Qullqip´unqu mountains through the lake and along the southeastern margin of the Ampatune fan before it confluences with the Río Tinquimayo (Figs. 2c, 3a). Note that the position of the Ampatune fan downstream of the Laguna Ampatune implies that the lake does not act as local base level for the fan. Where the river cuts the southeastern margin of the Ampatune fan, it has created cliffs exposing the internal fan architecture (see “Results”).
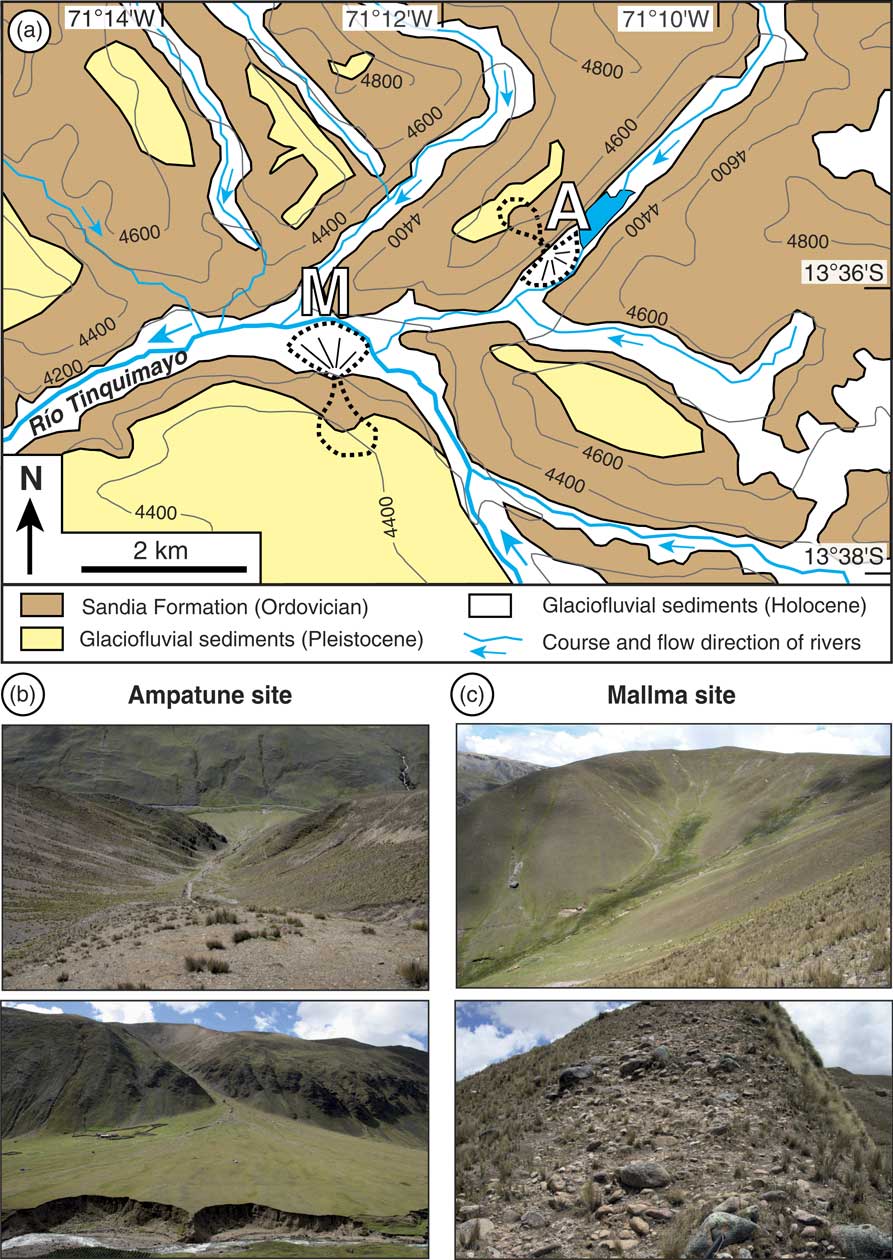
(a) Geologic map (with topographic contour lines in metres) of the study area showing the distribution of the Palaeozoic bedrock (Sandia Formation) and Pleistocene glaciofluvial sediments above the bedrock (map is based on Audebaud and Vargas (Reference Audebaud and Vargas1998), Sanchez and Zapata (Reference Sanchez and Zapata2002), and own field observations). Dashed black lines outline the Ampatune and Mallma catchment-fan systems. (b) Field photographs of the Ampatune catchment and the related fan. Note the easily erodible, red-brown sediments above the dark bedrock. (c) Overview of the Mallma catchment and outcrop with Pleistocene glaciofluvial sediments in the upper part of this catchment. The steep slope on the right indicates that the Pleistocene sediments are much more resistant to erosion than those in the Ampatune catchment. (For interpretation of the references to colour in this figure legend, the reader is referred to the web version of this article.)

The Mallma alluvial fan covers an area of ∼0.43 km2. Along the northern fan margin, the Río Tinquimayo has incised the fan and formed cliffs (Figs. 2c, 3a). Río Tinquimayo originates in the central Cordillera Vilcanota. After its confluence with the stream from the Ampatune valley, Río Tinquimayo flows to the west, past the Mallma fan (Fig. 2c). About 10 km west of the Mallma fan, the river passes a kettle lake called Laguna Casercocha (Fig. 2a). Note that the river does not flow through the Laguna Casercocha because the latter is situated south of the river and ∼100 m above the valley floor. Hence, Laguna Casercocha does not act as local base level for the studied fans. Downstream of Laguna Casercocha, Río Tinquimayo flows in a northwesterly direction (Fig. 2a) and eventually enters the Amazonian basin (Fig. 1).
Glacial history of the region
During the Pleistocene and Holocene, glaciers shaped the region surrounding the Ampatune and Mallma alluvial fans, leaving behind a succession of moraines (Mercer and Palacios, Reference Mercer and Palacios1977; Goodman et al., Reference Goodman, Rodbell, Seltzer and Mark2001; Mark et al., Reference Mark, Seltzer, Rodbell and Goodman2002; Ehlers and Gibbard, Reference Ehlers and Gibbard2004; Ehlers et al., Reference Ehlers, Gibbard and Hughes2011; Kelly et al., Reference Kelly, Lowell, Applegate, Smith, Phillips and Hudson2012) and glaciofluvial deposits such as the sedimentary fill of the Ocongate basin (Cabrera et al., Reference Cabrera, Sébrier and Mercier1991). The approximate position of the western ice margin during the LGM is shown in Figure 2a by the dashed white line (Ehlers et al., Reference Ehlers, Gibbard and Hughes2011). The kettle lake Laguna Casercocha (3980 m elevation) formed near the ice margin on a broad moraine crest as a result of deglaciation (Goodman et al., Reference Goodman, Rodbell, Seltzer and Mark2001) (Fig. 2a, b). In a drillcore of the lake sediments, the oldest organic material has an uncalibrated radiocarbon age of 15,640 ± 100 14C yr BP (Goodman et al., Reference Goodman, Rodbell, Seltzer and Mark2001). Calibration with the OxCal program (version 4.3; Bronk Ramsey, Reference Bronk Ramsey2009) yielded an age range of 19,077–18,627 cal yr BP. This minimum age for glacier retreat is consistent with an age of ∼20 ka for the LGM in the Cordillera Vilcanota (Mark et al., Reference Mark, Seltzer, Rodbell and Goodman2002). The moraine deposits at Laguna Casercocha are correlative with other U3 (= Marine Oxygen Isotope Stage 2) moraines and glacial deposits that occur on the northwestern flank of the Cordillera Vilcanota (Mercer and Palacios, Reference Mercer and Palacios1977; Goodman et al., Reference Goodman, Rodbell, Seltzer and Mark2001; Mark et al., Reference Mark, Seltzer, Rodbell and Goodman2002; La Frenierre et al., Reference La Frenierre, Huh and Mark2011).
The inferred flow direction of the ice through the valleys containing the Ampatune and Mallma fans is depicted in Figure 2b. During the LGM, a glacier flowed from the Qullqip´unqu mountains to the south and through the area of the Ampatune fan (which is ∼9 km away from the present-day ice margin). About 2 km farther downstream there was a confluence with a major glacier originating from the central Cordillera Vilcanota (Fig. 2b). This glacier occupied the large valley, where the Río Tinquimayo is flowing today. The Mallma fan is located just downstream of this confluence. From here the valley glacier flowed westward and reached the area of the Laguna Casercocha (Fig. 2b). The valleys have a parabolic cross-sectional shape, which indicates that the LGM glaciers have removed any pre-LGM sediments from the valley floors and the adjacent hillslopes. In summary, the Ampatune and Mallma fans formed after the retreat of the LGM glaciers that occupied the valley between Laguna Casercocha and the two fans.
Lithologies in the fan catchments
The Palaeozoic bedrock in the tributary catchments of the Ampatune and Mallma fans consists of low-grade metasedimentary rocks of the Ordovician Sandia Formation (Fig. 3a), which is made up of quartzites, phyllites, and schists (Sanchez and Zapata, Reference Sanchez and Zapata2002; Spiske et al., Reference Spiske, Reimann, Bahlburg and Carlotto2006). In addition, glaciofluvial sediments with a thickness of several tens of metres are exposed in the upper parts of both catchments. In the 1:100,000 scale geologic map Ocongate (Sanchez and Zapata, Reference Sanchez and Zapata2002), these sediments are depicted as Pleistocene moraine deposits (Fig. 3a). In satellite images they can be recognized by their light yellowish colour (Fig. 2c). Although the age of these sediments is unknown, the observation that they cover parts of the high plain into which the glacial valleys have been incised (Fig. 2c) suggests that they are rather old and probably mid-Pleistocene in age. The clast-supported sediments show a wide grain-size spectrum and contain rounded pebbles of quartzite and phyllite from the Sandia Formation, but also angular to subangular cobbles and boulders of gneiss, granite, porphyroid, and red sandstone (Sanchez and Zapata, Reference Sanchez and Zapata2002), which are derived from Precambrian basement and Mesozoic magmatic and sedimentary rocks exposed in the Cordillera Vilcanota and the Qullqip’unqu mountains (Fig. 2b). In the upper Ampatune catchment, the glaciofluvial deposits consist of weakly consolidated conglomerates that are easily eroded and transported downslope (Fig. 3b). In the Mallma catchment, the sediments are more coarse grained and more consolidated (Fig. 3b, c).
Erosion of the two catchments led to the transport of boulders from the Pleistocene glaciofluvial sediments onto the surfaces of both fans. Boulders on the Ampatune fan consist mainly of reddish porphyroids and typically have a size of up to 1 m, whereas those on the Mallma fan are larger in size (1–2 m) and consist predominantly of granitic and greyish porphyric volcanic rocks. There is no evidence for recent rockfalls in both catchments. Debris flows from the catchments to the active channels of the fans occur, as indicated by debris-flow levée deposits on the fans.
METHODS AND SAMPLING STRATEGY
Sedimentologic observations were made at the cliffs at the distal portions of the Ampatune and Mallma fans. To infer the depositional processes as well as the spatiotemporal evolution of the fans, we followed the standard nomenclature of Miall (Reference Miall1996) to classify the different lithofacies types and architectural elements and to interpret them in terms of the depositional environment (e.g., Franke et al., Reference Franke, Hornung and Hinderer2014; Meinsen et al., Reference Meinsen, Winsemann, Roskosch, Brandes, Frechen, Dultz and Böttcher2014; Ventra and Nichols, Reference Ventra and Nichols2014).
To assess the age and sedimentation history of the Ampatune and Mallma fans, we applied 10Be surface exposure dating to boulders present on the fan surfaces and used radiocarbon dating to constrain the age of depositional units below the surface of the two fans. As the 10Be samples were collected in 2015 and the calibrated 14C ages are reported relative to AD 1950, there is a difference of 65 yr between the 10Be and 14C time scales. This minor age difference does not affect any of the conclusions of this study.
We also took two stream-sediment samples near the apex of both fans to determine spatially averaged 10Be erosion rates for the catchment areas of the fans. Furthermore, we estimated the fan volumes and used satellite images of the well-preserved Ampatune fan to map fan lobes of different ages. In the following, we describe these methods and procedures in more detail before presenting the results in the next section.
10Be exposure dating and catchment-wide erosion rates
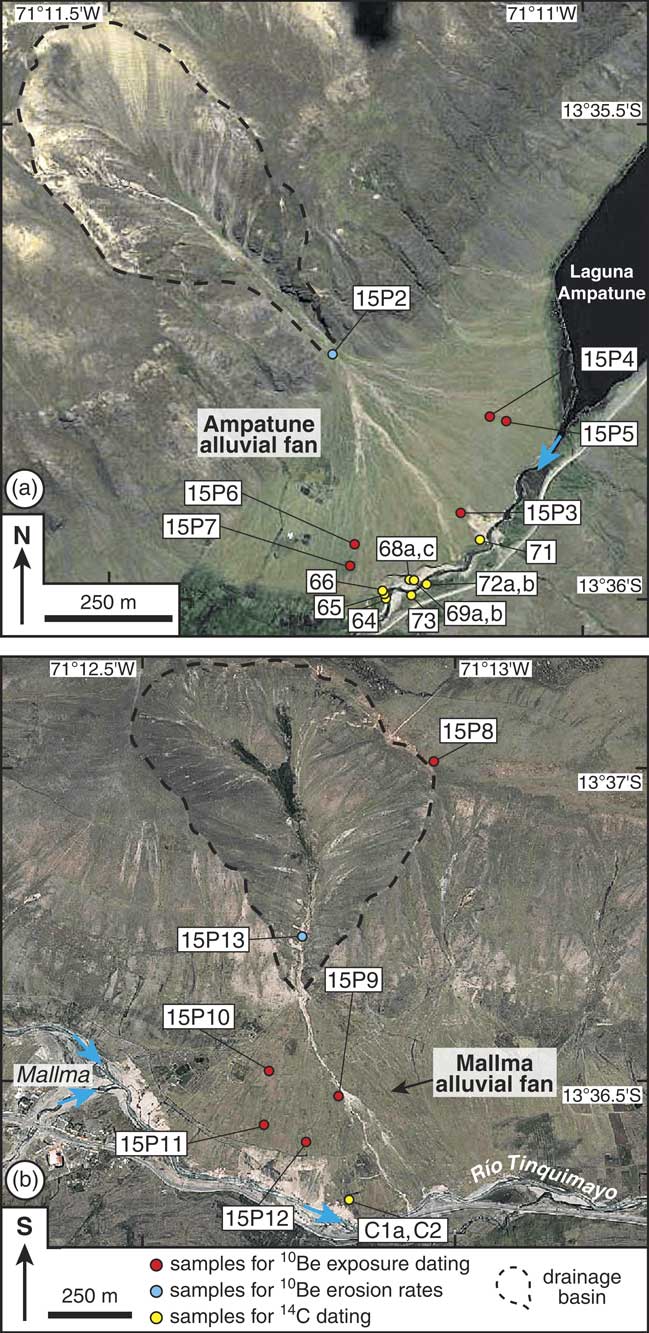
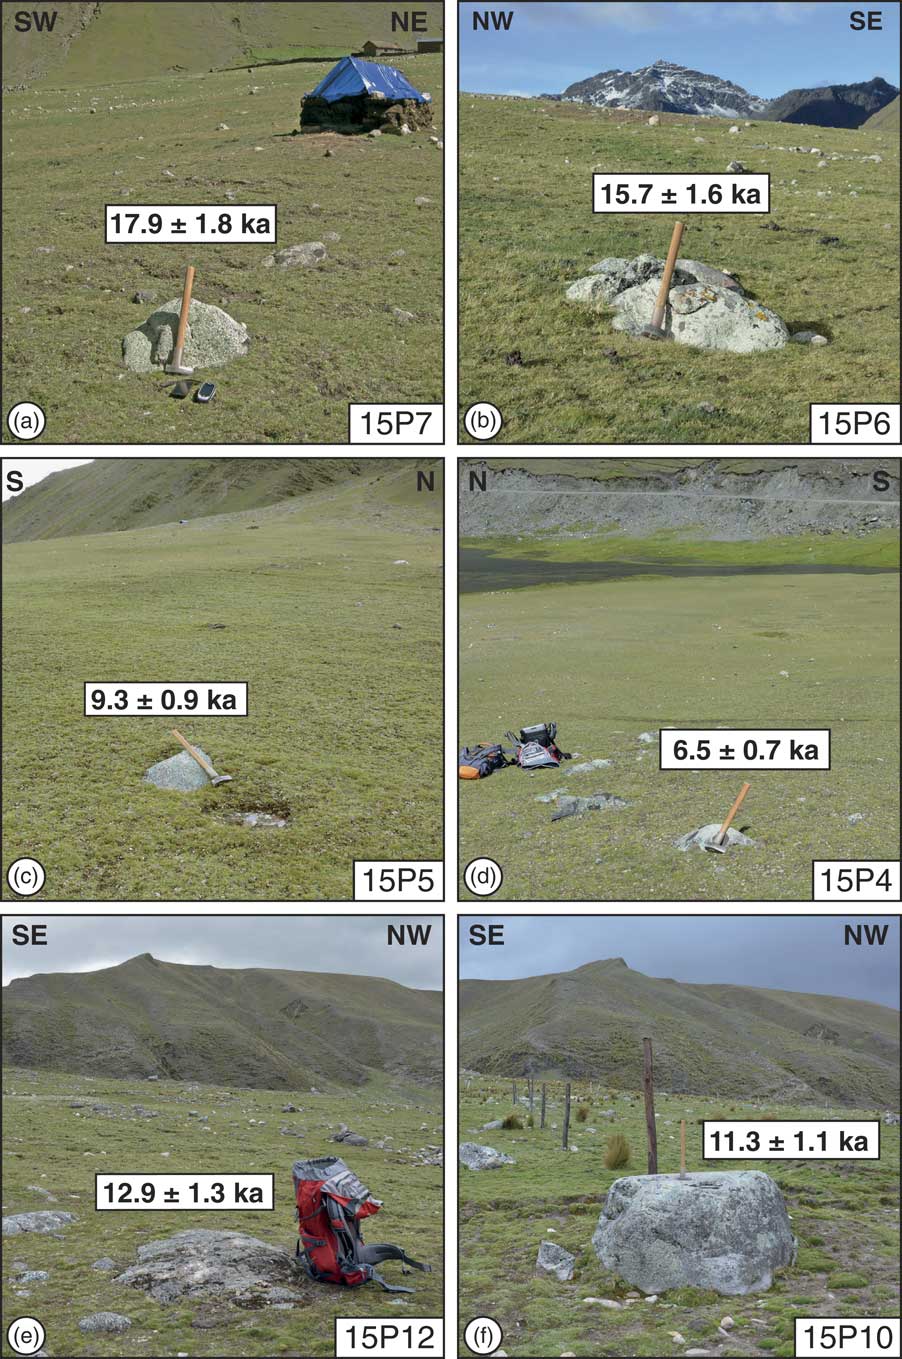
To place constraints on the timing of fan lobe deposition on the two alluvial fans, we took nine samples from boulders protruding the fan surfaces for 10Be exposure dating (Figs. 4, 5). Five samples were collected from the Ampatune fan (15P3–15P7; Fig. 4a) and four from the Mallma fan (15P9–15P12; Fig. 4b). In the distal part of the central Ampatune fan, sample 15P3 was taken from an angular quartzite boulder with a size of 70 × 55 cm that protruded the fan surface by ∼25 cm. The four other samples from this fan were taken from boulders of reddish, porphyric volcanic rocks rich in quartz phenocrysts. Samples 15P6 and 15P7 (Fig. 5a, b) were collected in the southern part of the Ampatune fan. Sample 15P6 is from the largest boulder (size: 100 × 80 cm) out of an assemblage of several boulders. The boulder from which sample 15P7 was chiselled off had a similar size as the one used for 15P3. Samples 15P4 and 15P5 are from boulders in the northeastern part of the fan (Fig. 4a). Both boulders were ∼65 cm long and ∼35 cm wide and protruded the alluvial fan surface by ∼20 cm and ∼10 cm, respectively (Fig. 5c, d).
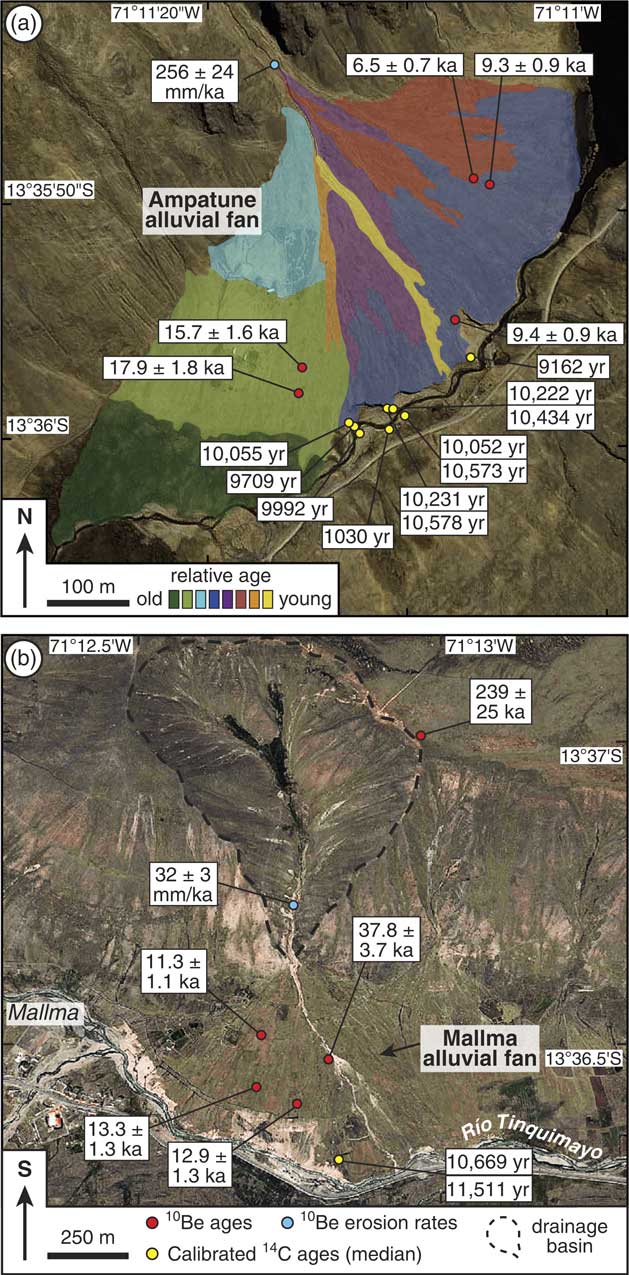
Satellite images of the Ampatune alluvial fan (a), which impounds the Laguna Ampatune, and the Mallma alluvial fan (b) (note that in this image south is upwards). Dashed black line indicates the drainage basin of the respective fan. Blue arrows indicate flow directions of rivers. Red, blue, and yellow points mark sampling sites (with corresponding sample numbers) for 10Be exposure age dating, for 10Be-derived catchment-wide erosion rates, and for 14C dating, respectively. Sample numbers are written in the white boxes. (For interpretation of the references to colour in this figure legend, the reader is referred to the web version of this article.)

(colour online) Examples of boulders sampled for 10Be exposure dating on the Ampatune (a–d) and Mallma (e–f) alluvial fans. Sample number is given in the bottom right corner of each picture. Exposure ages are shown with external errors.
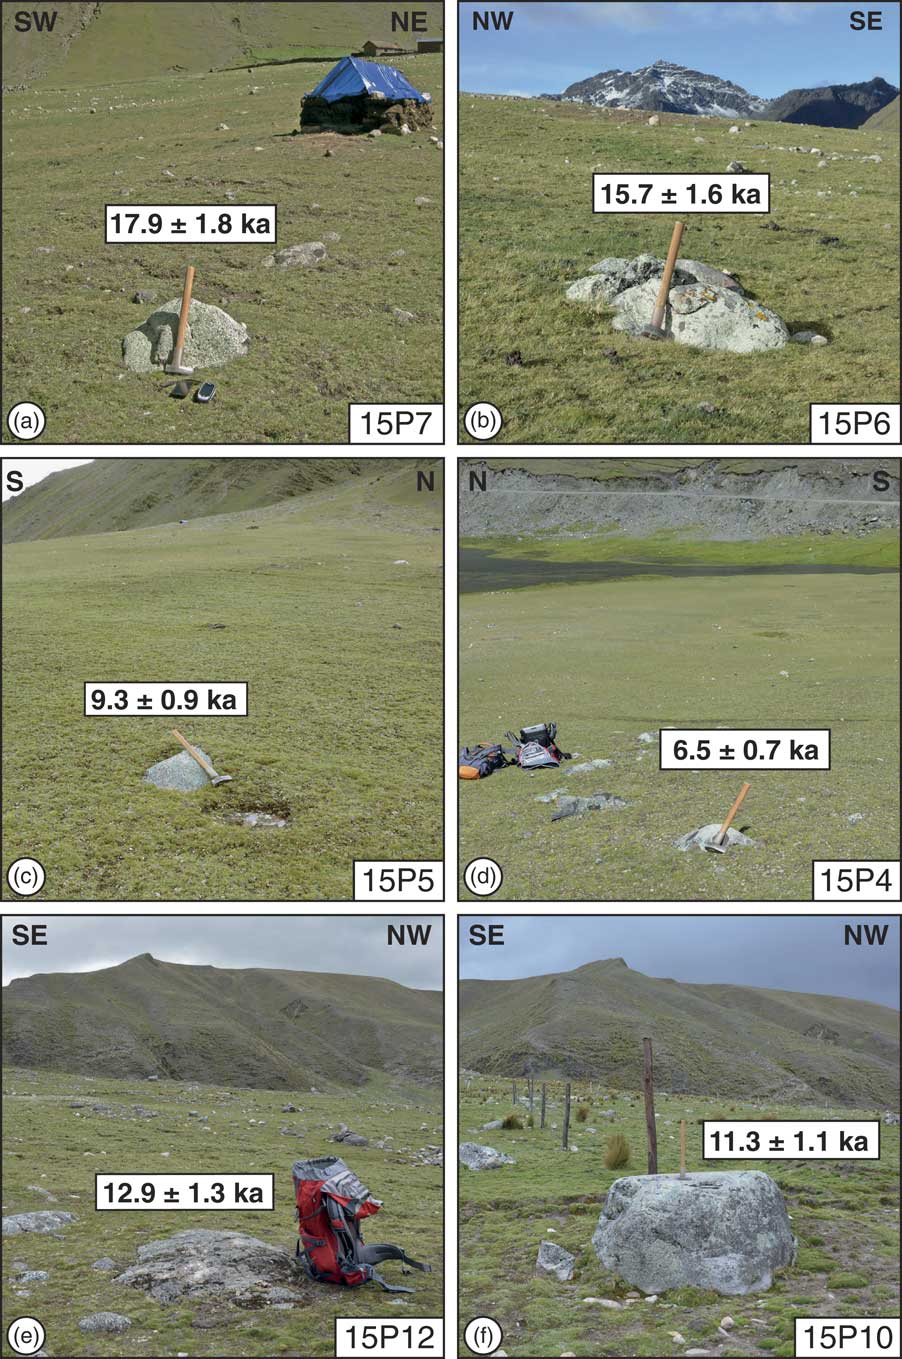
The four boulders sampled on the Mallma fan are composed of granitic rocks (15P9, 15P10, and 15P11) or greyish, quartz-bearing volcanic rocks (15P12). Sample 15P9 was taken from the top of a 1.8-m-high boulder located in the central part of the alluvial fan near a prominent channel (Fig. 4b; Supplementary Fig. 1). Sample 15P10 is from a flat-topped boulder near the fan apex (Fig. 4b), which is 2 m long and 1.5 m wide and stands ∼0.9 m above the fan surface (Fig. 5f). Samples 15P11 and 15P12 were chiselled off from boulders located in the more distal part of the fan (Fig. 4b). Sample 15P11 is from a boulder with a length of ∼1.6 m and a width of ∼1.4 m that stands up to ∼40 cm above the fan surface. The boulder used for sample 15P12 was only slightly smaller (1.1 × 1.1 m) and had its highest point ∼15 cm above the fan surface (Fig. 5e).
In addition to the samples from rock boulders on the fan surfaces, we took one sample (15P8) from a quartzite boulder near the southwestern boundary of the Mallma catchment (Fig. 4b). The boulder protrudes the soil-covered surface of the high plateau above the Mallma catchment (Fig. 6a) and was collected to give a minimum age for this sharply incised palaeoplain (Fig. 6b). Moreover, the sample also provides a minimum age constraint for the glaciofluvial sediments in the upper parts of both catchments. Finally, we collected two samples of stream sediment (15P2 and 15P13) to determine spatially integrated erosion rates for the catchments of the Ampatune and Mallma fans (Fig. 4).
(a) Overview picture on the two studied alluvial fans. View is downvalley to the west–southwest. Note the flat surface that delimits the uppermost part of the Mallma catchment. (b) Picture of the flat surface above the Mallma catchment. View is towards west–northwest. Dashed black line indicates boundary of Mallma catchment. Red dot marks location of sample 15P8. (For interpretation of the references to colour in this figure legend, the reader is referred to the web version of this article.)

Sample preparation and chemical separation of 10Be from quartz was carried out at the Institute of Geology and Palaeontology, University of Münster. After crushing the boulder samples, all samples were sieved and washed. Subsequently, the 250–500 µm grain size fraction was split into a magnetic and a nonmagnetic fraction using a Frantz magnetic separator. The subsequent cleaning of the nonmagnetic fraction containing the quartz consisted of one etching step in 6M HCl at 80°C and four etching steps in dilute (1%) HF/HNO3 in an ultrasonic bath heated to 80°C (Kohl and Nishiizumi, Reference Kohl and Nishiizumi1992). The samples were then etched once in aqua regia and 8M HF (Goethals et al., Reference Goethals, Hetzel, Niedermann, Wittmann, Fenton, Kubik, Christl and von Blanckenburg2009). For Be extraction, about 20 g of quartz from each sample was dissolved in 40% HF after the addition of 0.3 mg of Be carrier. Following complete dissolution, all samples were converted into chloride form using 6M HCl. Beryllium was separated by successive anion and cation exchange columns and precipitated as Be(OH)2 at pH 8–9. Following the transformation to BeO at 1000°C, targets were prepared by mixing of the BeO with Nb powder.
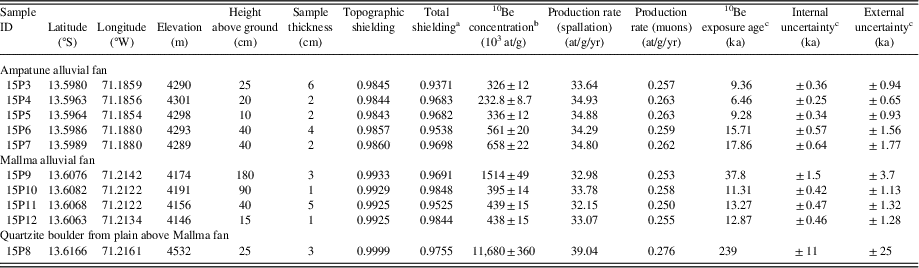
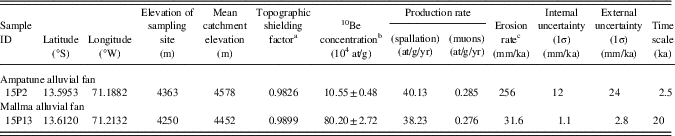
All samples were analysed at the centre for accelerator mass spectrometry at the University of Cologne, Germany (Dewald et al., Reference Dewald, Heinze, Jolie, Zilges, Dunai, Rethemeyer and Melles2013). The 10Be exposure ages (Table 1) and catchment-wide erosion rates (Table 2) were calculated with version 2.3 of the CRONUS-Earth online calculator (http://hess.ess.washington.edu/). All exposure ages were calculated under the assumption of no erosion and no cover by snow.
Information on 10Be exposure dating of rock boulders of the Ampatune and Mallma alluvial fans.
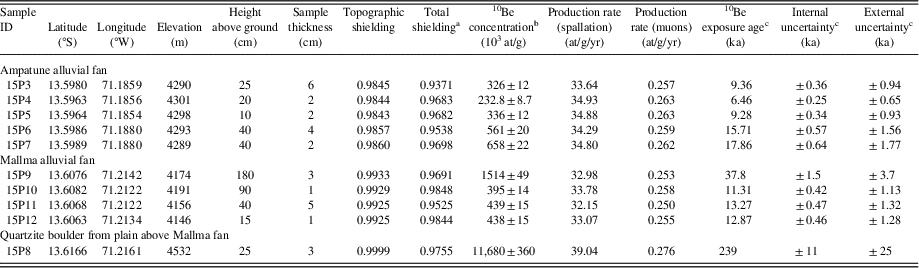
a The total shielding factor includes the corrections for both sample thickness and topographic shielding.
b The 10Be concentrations were measured at AMS Cologne, Germany (Dewald et al., Reference Dewald, Heinze, Jolie, Zilges, Dunai, Rethemeyer and Melles2013) and are normalized to the standards KN01-6-2 with a nominal 10Be/9Be ratio of 5.349 × 10⁻¹³ and KN01-5-3 with a nominal 10Be/9Be ratio of 6.320 × 10⁻¹² (Nishiizumi et al., Reference Nishiizumi, Imamura, Caffee, Southon, Finkel and McAninch2007), considering the 10Be half-life of 1.387 ± 0.012 Ma (Chmeleff et al., Reference Chmeleff, von Blanckenburg, Kossert and Jakob2010; Korschinek et al., Reference Korschinek, Bergmaier, Faestermann, Gerstmann, Knie, Rugel and Wallner2010). The uncertainties of the 10Be concentrations include the analytical uncertainty and the error of the blank correction. The analytical uncertainty includes the error based on the counting statistics, the scatter of repeated measurements of the same sample, and the uncertainty of the standard normalisation.
c The 10Be exposure ages were calculated with the CRONUS-Earth 10Be–26Al online calculator (http://hess.ess.washington.edu/, version 2.3 and version 2.3 of the constants file), using the primary calibration data sets of Borchers et al. (Reference Borchers, Marrero, Balco, Caffee, Goehring, Lifton, Nishiizumi, Phillips, Schaefer and Stone2016) and the time-dependent production rate scaling model of Lal (Reference Lal1991) – Stone (Reference Stone2000). All ages were calculated assuming a rock density of 2.65 g/cm3 and zero erosion. The internal uncertainties (1σ) include the analytical errors and the error of the blank correction, whereas external uncertainties (1σ) also include the systematic uncertainty of the sea-level high-latitude 10Be production rate.
10Be concentrations and catchment-wide erosion rates in the drainage basins of the Ampatune and Mallma alluvial fans.
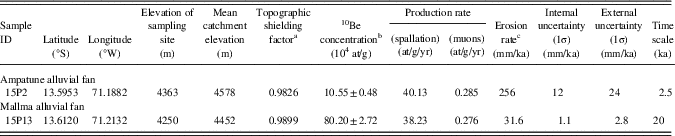
a The topographic shielding factors were calculated using a 30 m satellite radar topographic mission (SRTM) digital elevation model and the MATLAB script of Greg Balco (http://depts.washington.edu/cosmolab/shielding.m).
b The10Be concentrations were measured at AMS Cologne, Germany (Dewald et al., Reference Dewald, Heinze, Jolie, Zilges, Dunai, Rethemeyer and Melles2013) and are normalised to the standards KN01-6-2 with a nominal 10Be/9Be ratio of 5.349 × 10⁻¹³ and KN01-5-3 with a nominal 10Be/9Be ratio of 6.320 × 10⁻¹² (Nishiizumi et al., Reference Nishiizumi, Imamura, Caffee, Southon, Finkel and McAninch2007), considering the 10Be half-life of 1.387 ± 0.012 Ma (Chmeleff et al., Reference Chmeleff, von Blanckenburg, Kossert and Jakob2010; Korschinek et al., Reference Korschinek, Bergmaier, Faestermann, Gerstmann, Knie, Rugel and Wallner2010). The uncertainties of the 10Be concentrations include the analytical uncertainty and the error of the blank correction. The analytical uncertainty includes the error based on the counting statistics, the scatter of repeated measurements of the same sample, and the uncertainty of the standard normalisation.
c Erosion rates were calculated with the CRONUS-Earth 10Be–26Al online calculator (http://hess.ess.washington.edu/; version 2.3 and version 2.3 of the constants file), using the primary calibration data sets of Borchers et al. (Reference Borchers, Marrero, Balco, Caffee, Goehring, Lifton, Nishiizumi, Phillips, Schaefer and Stone2016) and the time-invariant production rate scaling model of Lal (Reference Lal1991) – Stone (Reference Stone2000). The internal uncertainties (1σ) include the analytical errors and the error of the blank correction, whereas external uncertainties (1σ) also include the systematic uncertainty of the sea-level high-latitude 10Be production rate. For the calculation, we used a density of 2.5 g/cm3 and the mean elevation of the catchments. The time over which the erosion rate integrates is calculated by dividing the absorption depth scale (i.e., 64 cm for a density of 2.5 g/cm3) by the erosion rate.
Radiocarbon dating
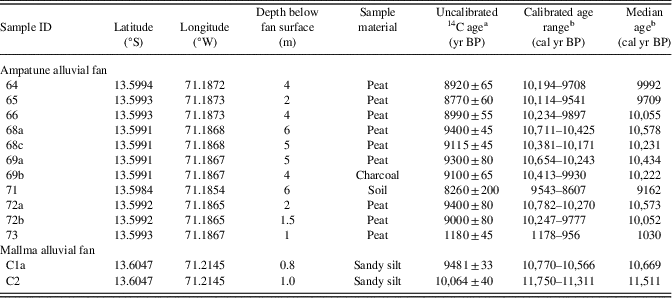
For 14C dating, we collected organic-rich samples from fine-grained sedimentary beds of peat, soil, or sandy silt (Table 3). In one case (sample 69b), charcoal flakes were used. The sampled peat layers have grown directly on the fan surface in a peat bog environment with good drainage without standing water bodies. The sampled beds are exposed in cliffs at the distal ends of the fans (Fig. 7), and all samples were taken 0.8 m to 6 m below the surface of the respective fan.
Information on 14C dating of organic material of the Ampatune and Mallma alluvial fans.
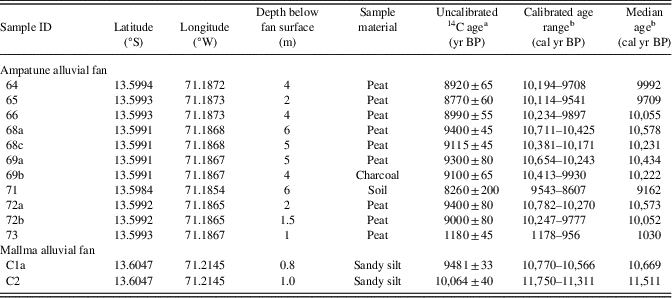
a Uncalibrated 14C ages with 1σ errors are given as years BP (before present, i.e., before AD 1950). The samples from the Ampatune fan were analysed at the Leibniz Institute for Applied Geophysics, Hannover, Germany. The samples from the Mallma fan were analysed at the MICADAS accelerator of the Klaus-Tschira-Laboratory for Radiometric Dating Methods, Mannheim, Germany.
b The calibrated 14C age ranges (2σ uncertainty) and the median ages were calculated with the OxCal program (version 4.3; Bronk Ramsey, Reference Bronk Ramsey2009) using the Southern Hemisphere SHCal13 radiocarbon calibration curve (Hogg et al., Reference Hogg, Hua, Blackwell, Niu, Buck, Guilderson and Heaton2013). Calibrated 14C ages are given as years BP (before present, i.e., before AD 1950).
(colour online) Examples of cliffs sampled for 14C dating at the Ampatune (a) and Mallma (b) alluvial fans. 14C ages are given as calibrated median ages in years BP (for complete age ranges, see Table 3) in the white boxes. Sample numbers are written in bold.

Sample preparation and 14C analysis of the 11 samples from the Ampatune fan were carried out at the Leibniz Institute for Applied Geophysics, Hannover, Germany. Using conventional 14C dating, the specific activity of 14C was measured radiometrically by proportional counters (Geyh, Reference Geyh1990, Reference Geyh2005). Preparation and analysis of the two 14C samples from the Mallma fan were carried out at the Curt-Engelhorn-Centre Archaeometry GmbH in Mannheim. The two samples were treated with HCl, NaOH, and HCl using the acid/base/acid method. The indissoluble fraction was burned in an elemental analyser to obtain CO2, which was subsequently reduced to graphite. The 14C concentration was measured with the MICADAS-accelerator of the Klaus-Tschira-Laboratory for Radiometric Dating Methods of the Ruprecht-Karls-Universität Heidelberg.
All uncalibrated 14C ages are normalized to a δ13C value of −25 ‰ (Stuiver and Polach, Reference Stuiver and Polach1977) and are reported with 1σ errors (Table 3). The calibrated 14C ages were calculated with the OxCal program (version 4.3; Bronk Ramsey, Reference Bronk Ramsey2009) using the Southern Hemisphere SHCal13 radiocarbon calibration curve (Hogg et al., Reference Hogg, Hua, Blackwell, Niu, Buck, Guilderson and Heaton2013). The calibrated age ranges and their median are given with 2σ errors. In addition, we report mean ages with symmetric error (2σ) (Table 3). All calibrated 14C ages and age ranges are given in years BP (before present, i.e., before AD 1950).
Estimation of fan volumes and mapping of the Ampatune fan
The volume of the two alluvial fans was determined using the software PETREL of Schlumberger. The initial valley geometry beneath the fans (i.e., after the retreat of the glaciers after the LGM) was reconstructed by extrapolating the slopes of the valleys. The upper parts of the valley slopes are still recognizable above the fan. In addition, field observations show that the sediments in the upper portion of the fan are in direct contact with the bedrock that forms the slope of the parabolic valley. The parabolic valley shape (Fig. 6a) and the fact that the valley bottom is devoid of a significant valley fill indicates that the valley was formed by glacial erosion. After the last glaciation, the valley was locally covered by some colluvium. Taken together, these observations indicate that the original valley now containing the Ampatune and Mallma fans was cleaned out by the LGM glacier. For the calculation of the post-LGM fan volume, it is hence reasonable to assume that the exposed valley slopes can be extrapolated along the valleys beneath the Ampatune and Mallma fans to reconstruct the basis of the fans.
The relatively pristine fan surface of the Ampatune fan allowed the use of satellite images together with field observations to subdivide the entire alluvial fan into fan lobes with different relative ages. The lobes were distinguished in terms of increasing coverage with fine-grained sediments, which results in reduction of surface roughness and patchy distribution of colours; in terms of increasing overgrowth with grass and moss, resulting in different intensity of modern peat formation; and in terms of different grey shading caused by weathering effects of bare rock surfaces. In the satellite images, relatively young parts of the fan are light grey in colour and have a blotty irregular appearance, because of the wide grain-size spectrum of the fan deposits and the lack of vegetation and missing fine-grained sediments between larger cobbles and boulders, attributable to outwash-effects. With time, the rather bright grey colours become darker and more homogeneous, owing to weathering, the growth of grass, and the development of thin soil and modern peat. Because of these alteration processes, the initial morphology of the channel-levée systems flattens and surface roughness decreases, which results in less patchy distribution of greenish-greyish colours. Apart from the surface structure, we identified fan lobes also based on their size, shape, and spatial distribution to obtain coherent and geologically meaningful genetic units. For the Mallma fan, the establishment of a relative chronology of different fan lobes is not possible owing to the anthropogenic alteration of some parts of the fan by farming.
RESULTS
Description of the Ampatune and Mallma fans and interpretation
Sediments exposed in the cliffs along the distal part of the Ampatune fan can be divided into two main gravel lithofacies types (cf. Miall, Reference Miall1996): (1) massive, matrix-supported, and poorly sorted gravel deposits, partly fining upwards, and (2) clast-supported, horizontally stratified, and moderately sorted gravel with some beds showing imbrication and/or inverse grading. In the latter unit, pebbles appear cleaned, and some beds are characterized by an open framework. The two types of depositional units are typically 0.5 to 1 m thick. Between the gravel beds, thin layers of sand or silt are often associated with weakly developed palaeosols. These fine-grained intercalations and palaeosols have a lateral extent of tens to hundreds of metres and formed before the next gravel unit was deposited. Peat and initial soil formation are also observed in large parts of the modern fan surface, where only some confined channels are active locally. The present-day fan surface is covered by grasses and mosses.
We interpret the matrix-supported gravel units as debris-flow deposits and the clast-supported, better sorted, and cleaner gravels as stream-channel deposits (Blair and McPherson, Reference Blair and McPherson1994, Reference Blair and McPherson2009; Miall, Reference Miall1996; Harvey et al., Reference Harvey, Mather and Stokes2005; Nichols, Reference Nichols2009). The dominance of thick gravel beds points to event-controlled deposition, whereas the intercalated fine-grained beds represent overbank flow, waning floods, and/or the later-stage redistribution of fine-grained material on the exposed fan surface (Miall, Reference Miall1996). The peaty initial palaeosols indicate that the depositional inactivity and quiescence lasted at least for decades. Because of the climate conditions at the high altitude of >4000 m, grasses and mosses have prevailed presumably since the retreat of the glaciers. This vegetation cover may have stabilized the surface during periods of depositional inactivity (cf. Gibling, Reference Gibling2006; Cable et al., Reference Cable, Christiansen, Westergaard-Nielsen, Kroon and Elberling2018); however, it has not significantly influenced the sediment distribution during fan activity periods.
The sediment exposures along the cliffs also allowed a two-dimensional analysis of architectural elements. We identified flat unconfined channels, lateral accretion complexes, and levées; sediments include channel fill, sheet flood, and debris flow deposits (cf. Blair and McPherson, Reference Blair and McPherson1994, Reference Blair and McPherson2009; Harvey et al., Reference Harvey, Mather and Stokes2005; Nichols, Reference Nichols2009). The partial filling of the channels by matrix-supported gravels indicates preferred movement of debris flows along previous pathways. The fine-grained beds may be the product of overbank flow. Alternatively, they may indicate depositional starvation and/or that sedimentation of coarser material was confined to small areas during these periods. The interruption of deposition at a specific site could have also been caused by autocyclic channel switching and lobe abandonment (e.g., Nichols, Reference Nichols2009). Altogether, the outcrops along the cliffs display a multilateral depositional architecture (e.g., Miall, Reference Miall1996; Gibling, Reference Gibling2006), which indicates a self-organized buildup with switching depositional lobes.
Similar to the Ampatune fan, the sediments of the Mallma fan show units with weakly stratified, moderately sorted gravels and poorly sorted massive gravels, respectively. Some planar cross-bedded gravel units grade into a trough-bedded type. In contrast to the Ampatune fan, matrix-supported gravel beds are more frequent than clast-supported gravels. Outsized subangular to angular boulders are also more frequent and often arranged along depositional boundaries. In general, stratification, sorting, imbrication, and grading are less well developed than in the Ampatune fan. This is supported by the almost exponential grain-size distribution curves for the Mallma fan, whereas the curves for the Ampatune fan are more sigmoidal in shape. Fine-grained beds are rare, and peaty palaeosols are restricted to the upper part of the succession.
The outcrops of the Mallma fan along the cliffs of the Río Tinquimayo show the following architectural elements: channels, lateral accretion complexes, and levées, which mainly comprise channel fill, sheet flood, and debris flow deposits. The coarse-grained mass flow deposits may form thick, amalgamated packages. Because of the rare occurrence of fine-grained intercalations, boundaries between architectural elements and depositional units are often blurred. Stacked successions of debris flow deposits reach up to 3 m in thickness and make up the major part of the outcrop. In the uppermost part, a ∼1-m-thick package of sheet flood deposits occurs. This unit is separated from the underlying debris flow deposits by fine-grained layers with pedogenic features and a minor humic content. These layers fill depressions of the palaeosurface and are less continuous than those observed at the Ampatune fan.
In conclusion, the Mallma fan is the product of similar depositional processes as the Ampatune fan; however, the dominance of debris flow deposits, multistory channel complexes, and less pronounced periods of depositional quiescence point to a more continuous activity and/or a higher susceptibility to the generation of matrix-supported debris flow deposits. The latter may be explained by the higher proportion of unsorted glacigenic material present in the Mallma catchment. This may also be the reason why the sedimentary architecture of the Ampatune fan shows a multilateral character only, whereas the Mallma fan shows multilateral and multistory channel complexes (e.g., Miall, Reference Miall1996; Gibling, Reference Gibling2006). Neither the sediments of the Mallma nor those of the Ampatune fan show evidence for cryoturbation or structures indicative of permafrost, such as ice-wedge casts or patterned ground.
Results from 10Be and 14C analysis
The results of the 10Be and 14C analyses are reported in Tables 1–3 and displayed in Figures 7 and 8. In general, 10Be and 14C ages of both alluvial fans are in good agreement. The relative chronology for the different fan lobes of the Ampatune fan (Fig. 8a) shows that distal fan segments of the fan are older, whereas more proximal parts are younger. The exposure ages and the mapping of the different fan lobes yielded consistent results. Samples 15P6 and 15P7 (Fig. 5a, b) are part of the second oldest fan lobe, which was the oldest one being sampled (Fig. 8a). With 10Be exposure ages of 15.7 ± 1.6 ka and 17.9 ± 1.8 ka, respectively, these two samples yielded the highest ages. The boulders of samples 15P3 and 15P5 were deposited as part of a younger fan lobe, which is supported by their nearly identical exposure ages of 9.4 ± 0.9 ka and 9.3 ± 0.9 ka, respectively (Fig. 8a). One boulder from a still younger fan lobe yielded a lower exposure age of 6.5 ± 0.7 ka. Samples for 14C dating were all taken from cliffs in the fan lobe from which 10Be samples 15P3 and 15P5 were collected. Median 14C ages of all samples except one vary between 9162 and 10,578 cal yr BP (Fig. 8a, Table 3). The only exception is sample 73 with a 14C age of 1178–956 cal yr BP. This sample was taken at an erosion bank on the riverside opposite to the fan and belongs to colluvial deposits originating from the opposite side of the valley. We therefore do not further consider the result from sample 73.
10Be exposure ages, 10Be erosion rates, and calibrated 14C ages obtained for the Ampatune (a) and Mallma (b) alluvial fans. 10Be ages and erosion rates are shown with external errors. 14C ages are given as calibrated median ages in years BP (for complete age ranges, see Table 3). In addition, coloured areas in panel (a) indicate the different lobes of the Ampatune fan and their relative ages based on the mapping of aerial photographs. (For interpretation of the references to colour in this figure legend, the reader is referred to the web version of this article.)

For the Mallma alluvial fan, samples 15P10, 15P11, and 15P12 from the central and eastern parts of the fan yielded similar 10Be exposure ages of 11.3 ± 1.1 ka, 13.3 ± 1.3 ka, and 12.9 ± 1.3 ka, respectively (Fig. 8b). In contrast, the boulder of sample 15P9 has an exposure age of 37.8 ± 3.7 ka, which is the highest age of all sampled boulders. As this boulder is located near the main active channel of the Mallma fan and has a 10Be age that exceeds the post-LGM fan formation, sample 15P9 contains a significant inherited nuclide component. Furthermore, radiocarbon dating of samples C1a and C2 from the distal part of the Mallma fan yielded ages of 10,770–10,566 and 11,750–11,311 cal yr BP, respectively (Fig. 8b, Table 3). As this indicates that the boulder is embedded in younger fan sediments, its apparent pre-LGM age does not date deposition but is attributable to an inherited component; we will therefore exclude the result for sample 15P9 from the further discussion.
The 10Be exposure age for sample 15P8 from the quartzite boulder on the high plateau at the upper boundary of the Mallma catchment is 239 ± 25 ka (Fig. 8b). It provides a minimum age for the formation of this palaeosurface as well as for the deposition of the glaciofluvial sediments that occur in the upper parts of both catchments. From the stream sediment samples that we collected in the channels feeding the Ampatune and Mallma fans, we obtained spatially integrated catchment-wide erosion rates of 256 ± 24 mm/ka and 31.6 ± 2.8 mm/ka, respectively (Table 2, Fig. 8).
Results from fan volume determination
The fan volumes obtained from the reconstruction of the valley geometry underneath the two alluvial fans are 5.9 × 10⁶ m3 for the Ampatune fan and 10.3 × 10⁶ m3 for the Mallma fan, respectively. The uncertainty on these two values is estimated to be about ± 20% as shown by different runs of the interpolation, which results in absolute values and uncertainties of 5.9 ± 1.2 and 10.3 ± 2.1 × 10⁶ m3, respectively.
DISCUSSION
Depositional history of the Ampatune and Mallma alluvial fans
Our data set of 10Be and 14C ages allows deriving the post-LGM depositional history of the two studied alluvial fans. While the 10Be exposure ages constrain the deposition of the boulders on the fan surface, the radiocarbon dating provides minimum ages for the deposition of the underlying fan sediments (and maximum ages for the overlying sediments). In the following discussion, we use either the calibrated 14C age range or simply the median ages (both are reported in Table 3). We also note that when comparing calibrated 14C ages with 10Be exposure ages it is necessary to consider the external uncertainties of the 10Be ages, which include the systematic uncertainty of the 10Be production rate. In contrast, internal uncertainties should be used when two (or more) 10Be ages for one landform are compared with each other (e.g., Balco et al., Reference Balco, Stone, Lifton and Dunai2008).
For the Ampatune fan, the two samples 15P6 and 15P7 from the second oldest fan lobe (light-green colour in Fig. 8a) have slightly different 10Be ages of 15.7 ± 0.6 and 17.9 ± 0.6 ka, respectively, when considering their internal uncertainties (Table 1). This age difference may be explained by a minor inherited 10Be component in the older sample, which may have formed in the respective boulder before it was emplaced on the fan. If this interpretation is correct, it suggests that sediment deposition on the second oldest fan lobe came to an end at 15.7 ± 1.6 ka (external uncertainty). Subsequently, sedimentation shifted to the central part of the Ampatune fan (blue colour in Fig. 8a), where 9 out of 11 calibrated 14C ages fall in the narrow range from 10,782 to 9541 cal yr BP (Table 3). The fact that all sample pairs from different depths have stratigraphically consistent 14C ages indicates the robustness of these age data. One slightly younger 14C age of 9543–8607 cal yr BP agrees with the 10Be ages of 9.4 ± 0.9 ka and 9.3 ± 0.9 ka obtained from the two boulders deposited on the same fan lobe (blue colour in Fig. 8a). Together, the 14C and 10Be ages document that the main volume of the Ampatune fan was deposited until ∼10 ka, although minor sedimentation continued for another few hundred years in the distal part of the fan. As the entire fan must have formed after the LGM (i.e., after ∼20 ka), our age data indicate a fast accumulation of fan deposits after the glaciers in the region retreated and the valleys became ice free. An initially rapid deposition of fan sediments is further supported by the blockage of the river directly upstream of the Ampatune fan and the formation of Laguna Ampatune (Fig. 4a). Since ∼10 ka, sediment delivery from the catchment of the Ampatune fan was restricted to the more proximal fan parts, as shown by one 10Be age of 6.5 ± 0.7 ka for a rather young fan lobe (red colour in Fig. 8a).
The 10Be and 14C ages for the Mallma alluvial fan indicate a similar depositional history (Fig. 8b) as for the Ampatune fan. Two almost identical exposure ages of 13.3 ± 0.5 ka and 12.9 ± 0.5 ka (internal uncertainties), and a slightly younger age of 11.3 ± 0.4 ka (Table 1), indicate that deposition on the eastern part of the fan ceased between 13 and 11 ka. It is noteworthy that the youngest of the three 10Be ages is from a boulder in the proximal part of the fan. Hence, as for the Ampatune fan the spatial distribution of these ages seems to indicate that deposition shifted from the relatively distal parts towards the apex of the Mallma fan. The two 14C ages of 11,750–11,311 and 10,770–10,566 cal yr BP (Table 3) indicate ongoing sediment deposition in this part of the Mallma fan at that time (Fig. 8b). As the respective samples were taken at a shallow depth of 0.8 and 1.0 m below the fan surface (Fig. 7b, Table 3), only a minor amount of sediment was deposited after ∼10.5 ka in this distal portion of the fan. Any younger sediments must have been deposited in more proximal parts of the fan.
Comparison between fan volumes and 10Be erosion rates from fan catchments
The catchment-wide 10Be erosion rates obtained for the source areas of the Ampatune and Mallma fans are 256 ± 24 mm/ka and 31.6 ± 2.8 mm/ka, respectively (Table 2). These rates fall within the wide range of catchment-wide erosion rates that were previously determined for catchments of different size in the Peruvian and Bolivian Andes (4–1350 mm/ka; e.g., Safran et al., Reference Safran, Bierman, Aalto, Dunne, Whipple and Caffee2005; Abbühl et al., Reference Abbühl, Norton, Schlunegger, Kracht, Aldahan and Possnert2010; Hippe et al., Reference Hippe, Kober, Zeilinger, Ivy-Ochs, Maden, Wacker, Kubik and Wieler2012; Carretier et al., Reference Carretier, Regard, Vassallo, Martinod, Christophoul, Gayer, Audin and Lagane2015; Kober et al., Reference Kober, Zeilinger, Hippe, Marc, Lendzioch, Grischott, Christl, Kubik and Zola2015). Note that the calculation of such spatially integrated erosion rates assumes that (1) quartz is homogeneously distributed in the eroding rocks, (2) sediment in the stream channels is well mixed, (3) nuclide production is equal to nuclide outflux via erosion and radioactive decay, and (4) erosion is constant through time (e.g., Granger and Riebe, Reference Granger and Riebe2007; Reinhardt et al., Reference Reinhardt, Hoey, Barrows, Dempster, Bishop and Fifield2007). In most settings these assumptions are unlikely to be fully met, which leads to an additional uncertainty of probably up to 20–30% (Dunai, Reference Dunai2010).
In our study area, erosion has not been constant through time (as we will show subsequently). Furthermore, the presence of different lithologies—Pleistocene glaciofluvial sediments above the Palaeozoic bedrock—complicates the interpretation of the catchment-wide erosion rates, because their quartz content may differ (cf. Carretier et al., Reference Carretier, Regard, Vassallo, Martinod, Christophoul, Gayer, Audin and Lagane2015). Hence, the uncertainties of the erosion rates are likely higher than 20–30%; however, even for an uncertainty of ∼50%, the two rates are still significantly different (i.e., 260 ± 130 mm/ka vs. 32 ± 16 mm/ka). Given the similar size, relief, slope, and bedrock of both catchments, we consider the most likely explanation to be the weakly consolidated and easily erodible glaciofluvial sediments in the Ampatune catchment, where these sediments form debris-covered, actively eroding slopes (Fig. 3b). In contrast, the Pleistocene sediments in the Mallma catchment are coarser and much better consolidated (Fig. 3c).
The time scale over which cosmogenic nuclide-based erosion rates integrate depends on the absolute value of the erosion rate. For the Ampatune catchment, this time scale is ∼2.5 ka, whereas it is ∼20 ka for the Mallma catchment (Table 2). By combining the erosion rates of 260 ± 130 and 32 ± 16 mm/ka (again, we use a 50% uncertainty) with the volumes of the Ampatune and Mallma fans (5.9 ± 1.2 × 10⁶ and 10.3 ± 2.1 × 10⁶ m3, respectively) and their catchments areas (Ampatune: 0.20 km2; Mallma: 0.51 km2), we can estimate the time that would be needed to generate the sediment volume stored in the fans. This calculation, which assumes that erosion has been temporally constant, yields time periods of 100 ± 50 ka for the deposition of the Ampatune fan and 540 ± 290 ka for the Mallma fan (note that for converting eroded rock volumes into sediment volumes we used densities of 2.5 and 2.1 g/cm3, respectively). As both fans were deposited after the LGM, these time periods exceed the true age of the fans by far, thus indicating that the rate of erosion must have varied considerably during the lifetime of the fans. When combined with the 14C and 10Be ages discussed previously, the discrepancy between the post-LGM fan ages and the long apparent time periods for fan deposition demonstrates that rates of catchment erosion and sediment delivery to both fans must have markedly declined through time.
To obtain a rough first-order estimate of the temporal variation of erosion, we use the 10Be erosion rate for the Ampatune catchment, which integrates over the last ∼2.5 ka (Table 2). Over this time interval, the assumption of a constant erosion rate can be regarded as reasonable. If we assume that the erosion rate of ∼260 mm/ka is representative for the last ∼10 ka (i.e., since the abrupt decline in sedimentation rate as shown by the 10Be and 14C ages), the average erosion rate in the Ampatune catchment between ∼20 ka and ∼10 ka can be determined. The average erosion-rate for this time interval is ∼2700 mm/ka and about an order of magnitude higher than the Holocene rate measured with 10Be. These mean erosion-rate estimates for the late Pleistocene and Holocene are equivalent to sediment fluxes of ∼600 m3/yr and ∼60 m3/yr, respectively.
For the Mallma catchment-fan system, the assumption of steady-state erosion over the integration time scale of ∼20 ka cannot be valid, as indicated by the discrepancy between the post-LGM fan age and the apparent time of ∼540 ka calculated for fan deposition. Thus, the 10Be-derived erosion rate of ∼32 mm/ka is much too small to produce the sediment volume stored in the Mallma fan. One explanation for the low erosion rate of the catchment could be the admixture of long-exposed material with high 10Be concentrations from the edge of the high plateau above the catchment. Indeed, the quartzite boulder 15P8 near the upper catchment boundary has a 10Be concentration more than ten times higher than the stream sediment sample 15P13 (i.e., ∼11.7 × 10⁶ vs. ∼0.8 × 10⁶ at/g; Tables 1, 2). If we assume that—similar to the Ampatune fan—90% of the sediments now stored in the Mallma fan have been eroded from the Mallma catchment between ∼20 and ∼10 ka, the average erosion rate during this interval would be ∼1500 mm/ka (equivalent to a sediment flux of ∼900 m3/yr).
A decrease in the rate of erosion from the LGM to the Holocene has also been documented for unglaciated catchments in the Peruvian Andes. By comparing the 10Be concentration of terrace fills and modern stream sediments, McPhillips et al. (Reference McPhillips, Bierman, Crocker and Rood2013) showed that the erosion of catchments with an area of several tens of square kilometres decreased from the late Pleistocene to the Holocene in response to a reduced precipitation. On a much larger scale, the relatively low 10Be concentration of floodplain sediments in the Napo River basin east of the Andes appears to reflect a higher erosion rate in the upstream part of this catchment during the LGM as compared with the Holocene (Wittmann et al., Reference Wittmann, von Blanckenburg, Guyot, Laraque, Bernal and Kubik2011).
High rates of erosion, sediment flux, and fan deposition similar to the ones obtained from the studied fans in Peru were also reported from other regions that were glaciated during the last glacial period, for instance, for alluvial fans on Spitsbergen, Greenland, and in the European Alps (i.e., from regions that have also been glaciated during the last glacial period). On Spitsbergen, the time-averaged deposition rate for a fan with a similar size as the Ampatune and Mallma fans has been estimated at 580–720 m3/yr since fan buildup began 12.5–10 ka ago (Bernhardt et al., Reference Bernhardt, Reiss, Hiesinger, Hauber and Johnsson2017). In contrast to the fans in Peru, the fan in Spitsbergen did not experience a significant decline in sediment deposition, because the deposition rate over the last 50 yr of ∼480 m3/yr is only slightly lower than the long-term rate (Bernhardt et al., Reference Bernhardt, Reiss, Hiesinger, Hauber and Johnsson2017). Similarly, aggradation of alluvial fans in the Zackenberg Valley in northeastern Greenland began in the early Holocene and continued throughout the different Holocene periods of warmer and cooler climate conditions at an average sedimentation rate of 450 mm/ka (Cable et al., Reference Cable, Christiansen, Westergaard-Nielsen, Kroon and Elberling2018). For a postglacial alluvial fan in the Swiss Alps, Hornung et al. (Reference Hornung, Pflanz, Hechler, Beer, Hinderer, Maisch and Bieg2010) estimated sediment volumes for different time periods in the early Holocene using a combination of ground penetrating radar survey and radiocarbon dating of palaeosols. Maximum sediment aggradation occurred during a cold climate interval between 7500 and 7000 cal yr BP corresponding to an erosion rate of 1070 mm/ka. In the Holocene climate optimum, sediment aggradation ceased despite higher humidity because of stabilization of slopes by vegetation. Erosion rates from late glacial valley fills of major Alpine valleys yield erosion rates between ∼1100 and ∼2900 mm/ka with an average of ∼1800 mm/ka for the entire Alps (Hinderer, Reference Hinderer2001). From the late glacial period to the Holocene, the sediment flux dropped by an order of magnitude (Hinderer, Reference Hinderer2001), which matches well with the estimated drop of sediment flux in the studied fans in Peru.
Correlation of fan sedimentation history with regional climate records
In this section, we compare our results on the sedimentation history of the Ampatune and Mallma alluvial fans with data that record the late Quaternary climate evolution of the tropical Andes. The growth and shrinkage of glaciers and ice caps in that region has been constrained by dating moraines, kettle lakes, peat bogs, and in-place vegetation exposed by retreating glaciers (Mercer and Palacios, Reference Mercer and Palacios1977; Goodman et al., Reference Goodman, Rodbell, Seltzer and Mark2001; Mark et al., Reference Mark, Seltzer, Rodbell and Goodman2002; Buffen et al., Reference Buffen, Thompson, Mosley-Thompson and Huh2009; Kelly et al., Reference Kelly, Lowell, Applegate, Smith, Phillips and Hudson2012; Bromley et al., Reference Bromley, Schäfer, Hall, Rademaker, Putnam, Todd, Hegland, Winckler, Jackson and Strand2016). In addition, past changes in precipitation were inferred from biotic, chemical, and isotopic proxies in sediment cores from existing lakes and palaeolakes (Abott et al., Reference Abbott, Seltzer, Kelts and Southon1997, Reference Abbott, Wolfe, Aravena, Wolfe and Seltzer2000; Cross et al., Reference Cross, Baker, Seltzer, Fritz and Dunbar2000; Seltzer et al., Reference Seltzer, Rodbell and Burns2000; Baker et al., Reference Baker, Rigsby, Seltzer, Fritz, Lowenstein, Bacher and Veliz2001a, Reference Baker, Seltzer, Fritz, Dunbar, Grove, Tapia, Cross, Rowe and Broda2001b; Wolfe et al., Reference Wolfe, Aravena, Abbott, Seltzer and Gibson2001; Fritz et al., Reference Fritz, Baker, Seltzer, Ballantyne, Tapia, Cheng and Edwards2007). These lake-sediment studies have been complemented by 14C and U-Th dating of biogenic carbonate associated with palaeoshorelines in order to quantify absolute lake-level changes (Sylvestre et al., Reference Sylvestre, Servant, Servant-Vildary, Causse, Fournier and Ybert1999; Placzek et al., Reference Placzek, Quade and Patchett2006; Blard et al., Reference Blard, Sylvestre, Tripati, Claude, Causse, Coudrain and Condom2011). In the following, we briefly describe the main environmental changes based on these studies and compare them with our results from the Ampatune and Mallma alluvial fans.
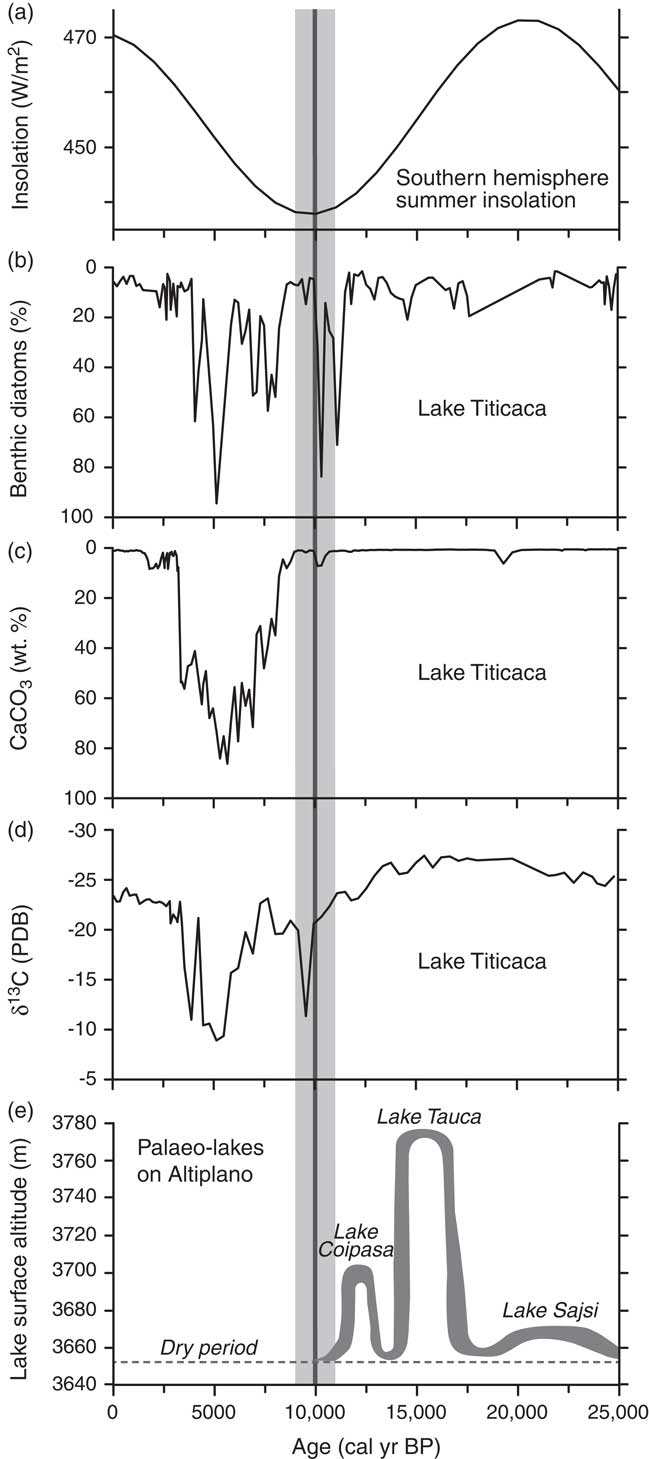
The maximum extent of glaciers and ice caps in the tropical Andes occurred about 22–20 ka ago and was broadly synchronous with the global LGM (Mark et al., Reference Mark, Seltzer, Rodbell and Goodman2002; Kelly et al., Reference Kelly, Lowell, Applegate, Smith, Phillips and Hudson2012; Bromley et al., Reference Bromley, Schäfer, Hall, Rademaker, Putnam, Todd, Hegland, Winckler, Jackson and Strand2016), even though the austral summer insolation reached a maximum at that time (Fig. 9a). During the LGM, the valleys in the Cordillera Vilcanota and the Qullqip’unqu mountains to the south and north of our study area, respectively (Fig. 2a), were occupied by glaciers (Goodman et al., Reference Goodman, Rodbell, Seltzer and Mark2001). In contrast, the palaeoplain above the Mallma catchment was not covered by ice during the last glaciation, as indicated by the minimum 10Be age of ∼239 ka (Fig. 8b, Table 1). Prior to ∼19 ka, the glaciers had already retreated from the Laguna Casercocha area to the east (see Fig. 2a; Goodman et al., Reference Goodman, Rodbell, Seltzer and Mark2001). It is not known when exactly the valleys in our study area became ice free, but the 10Be age of 15.7 ± 1.6 ka for the second oldest lobe of the Ampatune fan (Fig. 8a) provides a minimum age constraint for the retreat of the glaciers from our study area (Fig. 2b, c).
Proxies for climate evolution in the tropical Andes over the past 25,000 cal yr BP. The vertical grey band indicates the time when the sedimentation rate on the two studied alluvial fans decreased markedly. (a) Calculated January (austral summer) insolation at 15°S (Berger and Loutre, Reference Berger and Loutre1991). (b–d) Biotic, chemical, and isotopic data for sediment core 1PC from Lake Titicaca (modified from Baker et al., Reference Baker, Seltzer, Fritz, Dunbar, Grove, Tapia, Cross, Rowe and Broda2001b). Curves are all plotted such that up signifies higher lake levels. As the sedimentary organic matter is a mixture of planktonic algae with δ13C values of about –25‰ and shallow-water macrophytes with δ13C values of about –10‰, more negative δ13C values in panel (d) indicate a higher lake level. The isotopic composition of the sedimentary organic carbon is given relative to the Pee Dee belemnite (PDB) standard. (e) Lake-level curve for palaeolakes on the Altiplano (modified from Blard et al., Reference Blard, Sylvestre, Tripati, Claude, Causse, Coudrain and Condom2011).
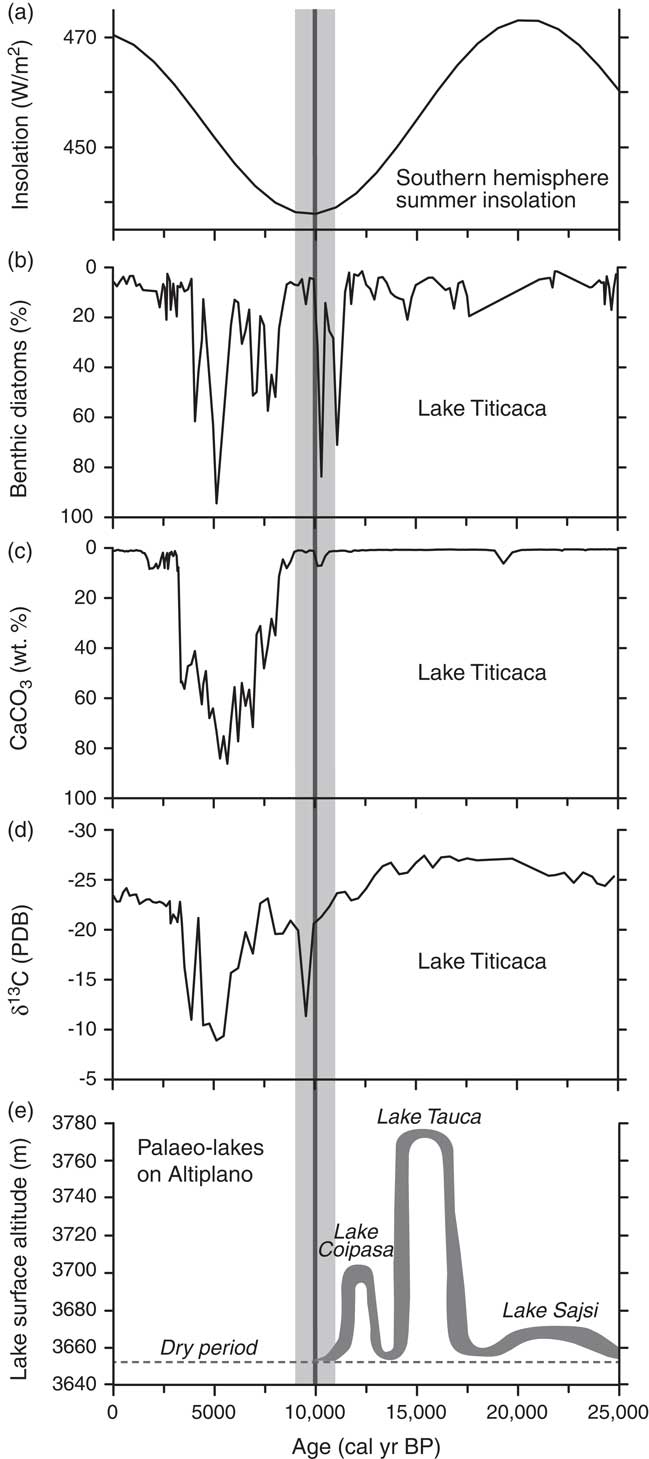
During the culmination of the last glaciation, Lake Titicaca was a freshwater lake as indicated by the low abundance of benthic diatoms, the lack of CaCO3 in the lake sediments, and low δ13C values of total sedimentary organic carbon (Fig. 9b–d) (Baker et al., Reference Baker, Seltzer, Fritz, Dunbar, Grove, Tapia, Cross, Rowe and Broda2001b). At the same time, a shallow lake existed farther to the south in the Uyuni basin (Lake Sajsi cycle), which reached its highest level around 22 ka (Fig. 9e) almost synchronously with the LGM (Placzek et al., Reference Placzek, Quade and Patchett2006; Blard et al., Reference Blard, Sylvestre, Tripati, Claude, Causse, Coudrain and Condom2011). Despite the existence of Lake Sajsi, a lacustrine record from a small lake in the Eastern Cordillera of Bolivia indicates that the moisture source from the Amazon basin was reduced during the LGM, thus suggesting relatively dry conditions (Mourguiart and Ledru, Reference Mourguiart and Ledru2003). After the regression of Lake Sajsi, a major and rapid lake-level rise started at ∼18 ka and culminated between 16.5 and 15 ka (Lake Tauca cycle), when the lake level was 100 m higher than during the preceding Sajsi cycle (Fig. 9e) (Blard et al., Reference Blard, Sylvestre, Tripati, Claude, Causse, Coudrain and Condom2011). The existence of Lake Tauca indicates a phase of high precipitation, which lasted for several millennia (e.g., Sylvestre et al., Reference Sylvestre, Servant, Servant-Vildary, Causse, Fournier and Ybert1999; Baker et al., Reference Baker, Seltzer, Fritz, Dunbar, Grove, Tapia, Cross, Rowe and Broda2001b; Placzek et al., Reference Placzek, Quade and Patchett2006; Blard et al., Reference Blard, Sylvestre, Tripati, Claude, Causse, Coudrain and Condom2011) and occurred after glaciers had retreated from their maximum LGM extent (Goodman et al., Reference Goodman, Rodbell, Seltzer and Mark2001; Kelly et al., Reference Kelly, Lowell, Applegate, Smith, Phillips and Hudson2012; Bromley et al., Reference Bromley, Schäfer, Hall, Rademaker, Putnam, Todd, Hegland, Winckler, Jackson and Strand2016).
We suggest that the rapid buildup of the Ampatune and Mallma fans occurred during the Lake Tauca wet period, which started at ∼18 ka and ended about 14.5 ka ago (Fig. 9e) (Blard et al., Reference Blard, Sylvestre, Tripati, Claude, Causse, Coudrain and Condom2011). Higher rainfall (Sylvestre et al., Reference Sylvestre, Servant, Servant-Vildary, Causse, Fournier and Ybert1999; Wolfe et al., Reference Wolfe, Aravena, Abbott, Seltzer and Gibson2001; Abott et al. Reference Abbott, Wolfe, Wolfe, Seltzer, Aravena, Mark, Polissar, Rodbell, Rowe and Vuille2003; Placzek et al., Reference Placzek, Quade and Patchett2006; Blard et al., Reference Blard, Sylvestre, Tripati, Claude, Causse, Coudrain and Condom2011) together with a widespread cover of hillslopes by unconsolidated, glacigenic deposits resulted in a climax of sediment supply. Apparently, the more humid conditions in our study area were not associated with an increase in stabilizing hillslope vegetation that would have been sufficient to inhibit erosion of the glacigenic deposits in the fan catchments. The occurrence of high sediment supply and fan formation during a humid period is in contrast to the widespread notion that sediment yield and hence fan aggradation rates typically increase during wet-dry transitions owing to a decrease in vegetation (e.g., Reheis et al., Reference Reheis, Slate, Throckmorton, McGeehin, SarnaWojcicki and Dengler1996; Miller et al., Reference Miller, Germanoski, Waltman, Tausch and Chambers2001; for a discussion see Dorn, Reference Dorn2009).
The Lake Tauca cycle was followed by a short phase with low lake levels and a drier climate, but lake levels were higher again from ∼13 to ∼11.5 ka (Lake Coipasa cycle; Fig. 9e) (Baker et al., Reference Baker, Rigsby, Seltzer, Fritz, Lowenstein, Bacher and Veliz2001a; Plazcek et al., 2006; Blard et al., Reference Blard, Sylvestre, Tripati, Claude, Causse, Coudrain and Condom2011). During this time interval, sedimentation on the Mallma fan came largely to an end as shown by three 10Be exposure ages of ∼13.3 to ∼11.3 ka and two 14C ages of 11,750–11,311 and 10,770–10,566 cal yr BP (Fig. 8b; Tables 1, 3).
At ∼11,500 cal yr BP, a large-amplitude drop in the level of Lake Titicaca commenced and lasted until about 10,000 cal yr BP (Baker et al., Reference Baker, Seltzer, Fritz, Dunbar, Grove, Tapia, Cross, Rowe and Broda2001b). This lake-level change is marked by the replacement of freshwater planktonic diatoms by benthic taxa and less negative δ13C values of the organic matter (Fig. 9b, d). In our study area, this drier period reduced the rate of sedimentation on the Ampatune fan and favoured the development of soil horizons, which yielded 14C ages ranging from 10,782 to 9541 cal yr BP (Table 3). Minor sediment deposition on the fan continued between 10 and 9 ka and was roughly coeval with a short high stand of Lake Titicaca (Baker et al., Reference Baker, Seltzer, Fritz, Dunbar, Grove, Tapia, Cross, Rowe and Broda2001b). Subsequently, a much drier climate has persisted in the tropical Andes during most of the Holocene (e.g., Baker et al., Reference Baker, Seltzer, Fritz, Dunbar, Grove, Tapia, Cross, Rowe and Broda2001b; Wolfe et al., Reference Wolfe, Aravena, Abbott, Seltzer and Gibson2001; Placzek et al., Reference Placzek, Quade and Patchett2006), and as a result no significant deposition on the studied alluvial fans has occurred since then.
CONCLUSIONS
The sedimentation history of two alluvial fans in the eastern Andes of Peru has been investigated with 10Be exposure and 14C dating in order to decipher how changes in climatic boundary conditions affect fan deposition and erosion in the source area. The new 10Be exposure and 14C ages are consistent for both fans and document intense erosion, fast sediment transport, and rapid deposition of alluvial sediments during two humid periods after the LGM. A shift to more arid conditions, which have prevailed through most of the Holocene after ∼9 ka, caused a marked drop in sediment deposition rates. We conclude that the classical concept of paraglacial sediment exhaustion of the middle latitudes may be strongly modified in the tropics by humidity shifts. Our study illustrates how 10Be exposure dating of alluvial fan surfaces can be coupled with radiocarbon dating of fan interiors to reconstruct past changes in climate. Furthermore, our results highlight that erosion, sediment transport, and deposition in fan-catchment systems are strongly dependent on climate.
ACKNOWLEDGMENTS
We thank Anne Niehus (Universität Münster) for help in the lab during processing of the 10Be samples and Veronika Rapelius (Universität Münster) for inductively coupled plasma-optical emission spectrometry (ICP-OES) analysis of quartz samples after etching. Rebecca Kämmerling, Vanessa Landscheidt, Anne Schnitzpahn, and Marek Naser contributed sediment logs, descriptions of sedimentary facies, and pebble petrology by their diploma theses. We thank Gudrun Drewes and Petra Posimowski from the Leibniz Institute for Applied Geophysics for radiocarbon sample preparation and measurements. 14C ages from the Mallma fan were provided from Susanne Lindauer (Klaus-Tschira-Laboratory for Radiometric Dating Methods). Critical comments and suggestions by the editor (Derek Booth), the associate editor (Xiaoping Yang), and two anonymous reviewers helped us to improve the original version of this manuscript. The Generic Mapping Tools (GMT) by Wessel and Smith (Reference Wessel and Smith1998) were used to create Figure 1. Funding for this study was provided by the Leibniz Universität Hannover (start-up funds to A. Hampel).
SUPPLEMENTARY MATERIAL
To view supplementary material for this article, please visit https://doi.org/10.1017/qua.2018.106