1. Introduction
Urban air pollution remains an important health concern in many cities in the developing world. In sub-Saharan Africa, air quality in many cities has been deteriorating with increasing traffic volume and the use of firewood in densely populated urban neighborhoods, increasing levels of premature mortality and respiratory illness (Robinson and Hammitt, Reference Robinson and Hammitt2009). Although air quality monitoring data is scarce in these cities, it is clear that pollution levels often far exceed those in urban areas of industrialized countries. The World Health Organisation's (WHO) guideline value for mean annual PM10 concentration (suspended particulate matter less than 10 microns in diameter) is 20 µg/m3. As a point of comparison, the US and France had annual averages of 18 and 27 µg/m3 in 2008. While we do not have monitoring data for Douala, our study site, or even the country of Cameroon, two other countries in West Africa (Senegal and Ghana) had average levels five to eight times higher, at 145 and 98 µg/m3 (WHO, 2012).
In Douala, the commercial capital of and the largest city in Cameroon, vehicular traffic is the major source of air pollution (World Bank, 2004). Pollutants such as carbon monoxide, nitrogen oxide and sulphur dioxide are believed to be far from the accepted levels. Although the World Bank Clean Air Initiative program which was launched in 1998 in sub-Saharan Africa spurred some interest among policy makers for mitigation policies, particularly around vehicular traffic, there is no existing information on household preferences or willingness-to-pay (WTP) for air quality improvements. Although this information would be very useful in the context of a cost-benefit analysis of potential mitigation strategies, we know of no such study in any urban area in Africa.Footnote 1 We used the dichotomous-choice contingent valuation method (CVM) and asked 496 randomly selected respondents in the city of Douala, Cameroon whether they would be willing to pay a one-time fee on their electricity bill to reduce air pollution related morbidity by 25 per cent. In addition to providing the first empirical evidence on benefits provided by an air pollution reduction program in urban Africa, our paper contributes to the literature in two important ways.
First, we explore a long-standing concern that stated preference (SP) approaches overestimate true WTP and suffer from ‘hypothetical bias’ (Champ et al., Reference Champ, Bishop, Brown and McCollum1997; List and Gallet, Reference List and Gallet2001; Harrison and Rutström, Reference Harrison, Rutström and Smith2002; Blumenschein et al., Reference Blumenschein, Blomquist, Johannesson, Horn and Freeman2008). SP researchers have put forward a number of techniques to obtain conservative welfare estimates, including the use of well-crafted, neutral scenario scripts, well-trained enumerators, plausible payment vehicles and ‘cheap talk’ scripts (Cummings and Taylor, Reference Cummings and Taylor1999). Welfare estimates can also be adjusted ex post based on the certainty respondents felt in their responses (Blumenschein et al., Reference Blumenschein, Blomquist, Johannesson, Horn and Freeman2008). Another approach to obtaining conservative WTP estimates has been to allow respondents ‘time to think’ before they state their WTP (Whittington et al., Reference Whittington, Kerry, Okorafor, Okore, Long and McPhail1992). These studies have generally shown that it reduces welfare estimates. For instance, in a recent cross-country study of private demand for vaccines, Cook et al. (Reference Cook, Jeuland, Maskery and Whittington2012) found that welfare estimates fell by 30–40 per cent. Another approach designed to minimize pro-social bias during in-person interviews is the ‘ballot box’ method, where the respondent's vote is kept private from the interviewer. We test these latter two approaches against the standard elicitation procedure. Second, we explore the stability and reliability of welfare estimates. According to Carson et al. (Reference Carson, Flores and Meade2001), reliability is an index of the reproducibility and stability of a measure. For policy purposes, it seems therefore relevant to investigate the stability of welfare estimates over time. We compare the effects of giving time to think versus these ‘test-retest’ approaches by giving some respondents an opportunity to revise their answers overnight. The difference between giving time to think and test-retest is clear. In the latter, enumerators are asking respondents to make a choice and then return to see if they ‘changed their mind’, whereas in the former they allow them time to reflect on their decision before making their choice. The two will differ more when people ‘anchor’ more on their first decision and do not wish to reconsider.
The next section of the paper provides a brief review of studies on air quality improvements in low-income countries. Section 3 describes the sampling procedure, experimental design and empirical model. Section 4 reports the empirical results of the study. Section 5 discusses the findings and concludes.
2. Literature review
2.1. Willingness-to-pay for air quality improvements in low-income countries
We begin with a review of the few studies measuring the value of air quality improvements to households in low-income countries. Although most of these studies involved split-sample experimental treatments, we focus here on the payment vehicles, management scenarios and best estimates of household WTP. In an air quality improvement valuation study in Sofia, Bulgaria, Wang and Whittington (Reference Wang and Whittington1999) asked respondents whether they would vote to increase utility bills to ‘implement an environmental program’. Based on the stochastic payment card approach, households in Sofia were willing to pay up to 0.35 per cent of their monthly income for a program to improve air quality; the income elasticity of WTP for air quality improvement was about 27 per cent. Afroz et al. (Reference Afroz, Hassan, Awang and Ibrahim2005) estimated WTP for air quality improvements in Klang Valley, Malaysia using three elicitation approaches including open-ended question, dichotomous choice and a payment card. The air quality management programFootnote 2 funded by an increase in fuel prices proposed a 20 per cent reduction in the concentration of particulate matter to make the air quality consistent with the Malaysian air quality guidelines. Mean WTP value for air quality improvement was a US$0.03 per liter increase in the fuel price. Wang et al. (Reference Wang, Zhang, Li, Yang and Bai2006) analyzed WTP for a 25 per cent reduction in ‘harmful substances’ in Beijing, China using a referendum format elicitation approach. Average household WTP was estimated at US$22.94 per household per year, or 0.7 per cent of household annual income. In Jinan, China, Wang et al. (Reference Wang, Zhang, Wang and Wang2007) used a hypothetical scenario that aimed to change ‘class 3’ air quality standards in Jinan to ‘class 2’ national standards of air quality. Using a sample of 1,500 residents and the open-ended elicitation format, they estimated average WTP at US$16.05 per person per year, or 0.74 per cent of household annual income.
We know of no peer-reviewed study of household WTP for air quality in Africa. The only available report is Gbinlo (Reference Gbinlo2006) in Cotonou, Benin. One hundred and twenty respondents were purposively chosen along heavily congested roads, compromising the study's ability to extrapolate to all of Cotonou. Furthermore, the study used an open-ended valuation question that was framed as a voluntary contribution, an elicitation approach with incentive compatibility problems. In addition, the report provided no detail on the actual air quality scenario used.
2.2. ‘Time to think’ and interviewer effects
Several studies have examined the effect of time to think on WTP by using a split-sample survey. In a study on WTP for public and private tap connections in Anambra State (southeastern Nigeria), Whittington et al. (Reference Whittington, Kerry, Okorafor, Okore, Long and McPhail1992) found that giving respondents time to think decreased WTP by approximately 37 per cent for public taps and 32 per cent for private tap connections. In contrast, Whittington et al. (Reference Whittington, Lauria, Wright, Choe, Hughes and Swarna1993) did not find that giving respondents time to think reduced demand for sanitation services in Ghana. On the other hand, Svedsater (Reference Svedsater2007) found that giving respondents time to think about hypothetical donations to an environmental program in London reduced the respondents' uncertainty and WTP. In a multi-country study of household demand for cholera and typhoid vaccines, Cook et al. (Reference Cook, Jeuland, Maskery and Whittington2012) found that giving respondents time to think reduced the probability that a respondent said he or she would buy the hypothetical vaccines. As a result, average WTP fell by approximately 40 per cent. Respondents who were given time to think were also more certain of their answers. No studies thus far have examined the potential effect of time to think on the likelihood of respondents rejecting the scenario or giving ‘protest’ answers. The occurrence of protest responses may fail to determine the correct economic value of the good or policy being valued (Meyerhoff and Liebe, Reference Meyerhoff and Liebe2008) and may bias welfare estimates if included in or excluded from the analysis.
A number of test-retest studies have measured whether responses are stable when the elicitation approach is repeated at a later time. Kealy et al. (Reference Kealy, Montgomery and Dovidio1990), Loomis (Reference Loomis1989) and McConnell et al. (Reference McConnell, Strand and Valdes1998) found that respondents' preferences do not change over time. However, Brouwer and Bateman (Reference Brouwer and Bateman2005) in a test-retest study about WTP for flood control and wetland conservation found that WTP estimates significantly changed over time. Recently, Bedate et al. (Reference Bedate, Herrero and Sanz2010) found a mixed result in their test-retest study of values for cultural goods (a new museum of contemporary art) in Spain: preferences were stable for visitors to the museum but not for residents of the city.
Carson et al. (Reference Carson, Hanemann, Kopp, Krosnick, Mitchell, Presser, Ruud and Smith1994) examined interviewer effects in a US damage assessment study and found no statistical difference in responses between in-person surveys administered with and without a ballot box. Leggett et al. (Reference Leggett, Kleckner, Boyle, Dufield and Mitchell2003) had one group of respondents fill out the CV questionnaire alone and another group complete the CV questionnaire with the help of an interviewer but place their stated WTP in a ballot box. They found that WTP (for a visit to a national monument in the US) was approximately 23 per cent higher when surveys were conducted through in-person interviews with a ballot box rather than being self-administered. Subade (Reference Subade2005) tested a variation of the self-administered survey approach in the Philippines termed the ‘drop-off’ protocol. Interviewers in this approach spend time with respondents explaining the purpose of the survey and the basics of the valuation scenario before leaving the survey instrument with the respondents to complete. Interviewers return later that day or within a few days, pick up the questionnaire, and answer any questions that the respondents may have had while filling in their answers. Subade (Reference Subade2005) found that the WTP estimates of the respondents who received the drop-off protocol were approximately 1.5–57 per cent lower than estimates from respondents who completed conventional in-person, single-session surveys.
3. Sampling procedure, experimental design and empirical model
3.1. Sampling
Data for the study come from a face-to-face survey conducted in April 2011.Footnote 3 The survey took on average three weeks to complete and due to budget constraints we did not compensate households in any way or give them any gifts for participating in the survey. We used a three-stage cluster sampling procedure to select respondents. At the first stage, we chose three subdivisions (Douala III, Douala IV and Douala V) by weighting the probability of choosing a subdivision by its population. At the second stage, we randomly chose 18 blocks,Footnote 4 proportionate to the total number of blocks per subdivision. In the absence of a household-level census or voter registration roll, we used a systematic sampling approach to select households at the third stage: enumerators were told to walk in a given direction from a central point in the block and attempt to interview the head of household in every eighth household they encountered. If the household head was not at home, the enumerators revisited at a different time on a different day. In total, 496 heads of household completed the survey with a refusal rate of 2 per cent.
3.2. Scenario
We split the sample of respondents into three experimental treatments, discussed in more detail below. The management scenario in all the three experimental designs was the same. The payment vehicle used was a one-time surcharge on a household's electricity bill. During the focus group discussions and pre-test, we devoted a considerable amount of time to the choice of an appropriate payment vehicle. Since vehicular traffic is believed to be a major contributor to air pollution in Douala, we investigated the possibility of using an increase in fares for taxis and minibuses (the most common form of transportation in Douala) as a payment vehicle. We found that an increase in the monthly electricity bill was the most credible vehicle for participants, and almost all households in Douala have electricity connections. It also avoided the problem of asking private car owners about fare increases for services they do not use and the problem of potential quantity changes in minibus trips that would complicate our welfare calculations. Based on results from the focus group discussions and the pre-test, we chose the following four bid levels: 200, 350, 500 and 1,000 CFA francs.Footnote 5 These bids represent an increase of 4, 6, 9 and 18 per cent of the population's average monthly electricity bill (5,658 CFA francs). Each bid was randomly assigned to the respondent.
The management scenario involved a number of activities to improve air quality in the city, including tree planting, buying old polluting vehicles at market value to remove them from the vehicle fleet, providing subsidies for the purchase of new fuel-efficient, low-emission minibuses, and reducing traffic congestion (the full text is provided in the online appendix, available at http://journals.cambridge.org/EDE). The program also included funding for new air quality monitoring stations. A new committee elected by residents would administer the money collected from the one-time surcharge on electricity bills. If implemented, respondents were told that with the program ‘the number of people who get sick because of breathing problems will be decreased by 25 per cent’. We chose this metric because we know of no current data on ambient air quality in the city (the most recent report was conducted by the World Bank 2004) and because focus group participants had an easier time understanding and believing a morbidity-based metric than a pollutant-concentration metric. The questionnaire also asked about household demographics, health status and attitudes towards air pollution. Guidelines provided by Arrow et al. (Reference Arrow, Solow, Leamer, Radner and Shuman1993) and Whittington (Reference Whittington1998, Reference Whittington2002) were followed, and a ‘consequentialism’ script was integrated in the CV scenario (Bulte et al., Reference Bulte, Gerking, List and de Zeeuw2005).Footnote 6 The full bilingual text of the survey instrument is available at the second author's faculty website.
3.3. Experimental treatments
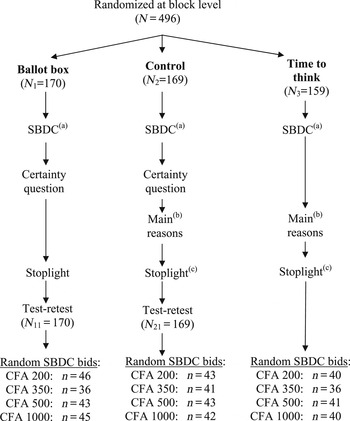
The first subsample of respondents, whom we refer to as the ‘control’, answered a single-bounded dichotomous choice (SBDC) question about the air quality management program (figure 1). This was followed by a follow-up certainty question with two categories: ‘probably sure’ and ‘definitely sure’. They described the main reason for their votes, which we use to identify ‘protest’ votes. They also completed a payment card exercise that used the colors of traffic lights to communicate uncertainty (Whittington et al., Reference Whittington, Sur and Cook2008; Cook et al., Reference Cook, Jeuland, Maskery and Whittington2012; also see the online appendix to this paper for more details on stoplight), although we will not discuss the results from this exercise in the paper.Footnote 7
Research design
Notes: (a) and (b) refer to the single bounded-dichotomous choice and the main reasons to pay and not to pay, respectively. (c) Only respondents who answered ‘yes’ to the SBDC question were asked to complete the stoplight exercise for the control and TTT subgroups (unintentionally).

A second subsample of respondents received the same management program but were given overnight to think about their votes. These ‘time to think’ (TTT) respondents were also given a specific referendum price and encouraged to discuss it with their spouse, friends and neighbors (the full text of the ‘time to think’ text is given in the online appendix). Enumerators recorded households' decisions during the second interview the next day as well as the main reason behind their votes. Because of an oversight in the survey implementation, TTT respondents were not asked how certain they were of their responses. We describe the effects of this decision on our analysis below.
Respondents in the ‘ballot box’ subsample were given the same scenario but asked to mark their responses to the dichotomous choice question on a card that was put in a sealed envelope to avoid pro-social interviewer bias. The enumerators informed subjects that their responses would be kept private. Respondents in this subsample also marked their responses to the certainty question. Because enumerators could not observe the votes and not all respondents could read, these respondents were not asked for the main reason why they voted the way they did and we therefore cannot identify ‘protest’ votes for this subsample. This ‘ballot box’ subsample also did the stoplight exercise and provided their responses in a sealed envelope. More specifically, the enumerators explained to respondents how the air quality in Douala could be improved, the ballot box exercise which contains the two formats (SBDC and stoplight) and they gave them two printed cardsFootnote 8 with the prices: one printed card for the SBDC format and the other printed card for the stoplight. They were then asked to mark it themselves and put their answers in the sealed envelope.
To explore the stability of WTP over time, enumerators returned to interview the ‘control’ and ‘ballot box’ respondents the next day. They were asked the same dichotomous choice question with the same referendum price. In total, 169, 157 and 170 heads of household received the control, TTT and ballot box treatments. These three experimental designs were randomized at the block level rather than the household level for administrative simplicity; all households within a given block completed the same experimental treatment. Because each subsample was split by four referendum surcharges, the sample size in each cell varied from 36 to 46 (see figure 1).
3.4. Empirical model
We analyze responses to the dichotomous choice question following Cameron and James (Reference Cameron and James1987) and Haab and McConnell (Reference Haab and McConnell2002). We elect to use a linear rather than a lognormal specification to allow for zero or negative WTP arising from protest respondents. We also address the issue of negative WTP by restricting mean WTP to lie between zero and the highest bid presented to respondents. Thus, we report the truncated mean WTP in the text (table 4) and the untruncated mean WTP in the online appendix. The untruncated mean is generally less than or equal to the truncated mean (Haab and McConnell, Reference Haab and McConnell1997; Johansson et al., Reference Johansson, Kristrom and Maler1989). We also recode ‘don't know’ responses as a ‘no’ (Carson et al., Reference Carson, Hanemann and Kopp1998; Groothuis and Whitehead, Reference Groothuis and Whitehead2002). The standard errors of mean WTP were calculated using the delta method.
Drawing upon Cameron (Reference Cameron1988) and Cameron and Huppert (Reference Cameron and Huppert1989), we estimate mean WTP from the stoplight/payment card exercise using a parametric interval regression model. We also estimate lower bound and midpoint non-parametric WTP measures following Turnbull (Reference Turnbull1976) and Kristrom (Reference Kristrom1990), and calculate standard errors of non-parametric WTP using the method of Vaughan and Rodriguez (Reference Vaughan and Rodriguez2001).
The presence of protest responses in the data warrants special attention. As mentioned above, inclusion of protest responses in the analysis may bias average welfare estimates downwards if respondents are answering ‘no’ because of problems with the scenario rather than because they are not willing to pay for the specified change. If the protest responses are non-random, their exclusion may also yield biased estimates. Exclusion of protest responses is only appropriate when the protest respondents are not significantly different from the rest of the sample (Strazzera et al., Reference Strazzera, Genius, Scarpa and Hutchinson2003). We carry out a sensitivity analysis to explore the change in welfare estimates when protesters are included in or dropped from the analysis. We report the results from estimation with the protest respondents in the text, but relegate results from the estimation without the protest respondents to the online appendix (see tables A8, A9, A11, A12, A14 and A15).
4. Results
4.1. Raw data
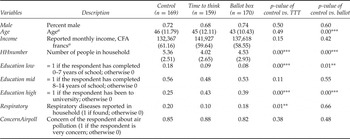
Table 1 provides the background characteristics of the respondents in the three experimental groups. A representative respondent in our sample is a 45-year-old male in a household with five members with a mean household income of approximately 140,000 CFA francs (US$262) per month. He is ‘very concerned’ about air pollution in the city but is unlikely to have a household member with respiratory problems. By random chance we have some statistically significant differences between subsamples in age, education, household size and the presence of respiratory problems. We expect these characteristics to be significant predictors of WTP for air quality improvements. Although we control for these differences in the multivariate regression analysis, they do complicate comparisons of responses and non-parametric WTP estimates.
Background characteristics
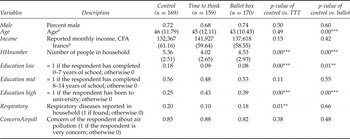
Notes: Standard deviations are in parentheses. *p < 0.10; **p < 0.05; ***p < 0.01.
a At the pre-test stage, many respondents were hostile in declaring their age and income, so we used ranges. We report the midpoint here. The total sample size is N=496.
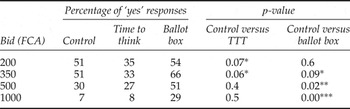
We begin by comparing the percentage of respondents who voted ‘yes’ to the SBDC question across the three subgroups. We start without adjusting for respondent uncertainty (the TTT group was not asked the uncertainty questions) or protest responses (the ballot-box group could not complete the question on the main reason for the vote). Table 2 shows that the percentage of respondents voting yes declines monotonically with price for both the control and TTT groups, and is generally higher among those in the ‘control’ group than those given time to think. The differences are not, however, statistically significant at each price. Among ballot box respondents, the percent yes declines with higher bids except for the second bid level (350 CFA francs). Contrary to our prior expectations, it is higher than the control group for three of the four bid levels, and substantially different at the highest bid (29 vs. 7 per cent yes in the control).
Percentage of ‘yes’ responses, by bid and experimental treatment
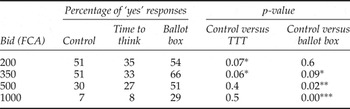
Notes: *p < 0.10; **p < 0.05; ***p < 0.01. Respondents answering ‘don't know’ recoded as ‘no’. Responses are not adjusted for certainty (e.g. probably sure, definitely sure, not sure at all).
We refine these comparisons by adjusting for protest responses in the control and TTT subsamples. (Because illiterate ballot box respondents were unable to report the ‘main reason’ for their vote we cannot identify protest responses in that subsample.) We consider protest responses as those where the respondent answered ‘no’ to the offered bid and gave a reason that we believe indicated scenario rejection. The pre-coded options for respondents answering ‘no’ were: ‘(1) I don't trust the people that will manage the fund; (2) The environment is clean enough; (3) I am afraid of the repercussions of the program (it will increase my expenditures); (4) I don't want such policy; (5) The government must search for another policy; (6) I would vote if the fixed surcharge is lower; (7) I really want to vote but I don't think that my vote will count; (8) I don't know; and (9) Other reasons (please specify).’ We consider responses (1), (4), (5) and (7) to be potential protest responses, although no one answered (7) in the field. Assuming responses (1) and (4) are protests, 24 per cent of responses in the control treatment were protests compared to 11 per cent in the TTT subsample, a statistically significant difference.Footnote 9 After dropping those protest responses, the percent ‘yes’ remains monotonically declining with increasing bids for the TTT sample and lower at every price than the control group (details are provided in online appendix table A1). The difference in the percent ‘yes’ between the control and TTT groups is statistically significant at the two middle bid levels. If we expand the definition of protest to include ‘the government must search for another policy’, the percentage of protest votes rises to 33 and 30 per cent in the control and TTT groups, respectively. Pairwise differences are again significant at the two middle bid levels (table A2).
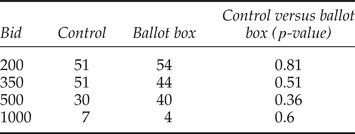
Finally, we account for respondent uncertainty in the control and ballot-box subsamples by recoding all ‘yes’ answers where the respondent was ‘probably sure’ to ‘no’ answers. (Again, because of an implementation oversight we did not collect certainty information on TTT respondents.) Table 3 reports these adjusted ‘percent yes’ numbers. Both remain monotonically declining with the bids, but the difference between the ballot box and control groups is now much smaller, especially at the highest price. Because no-one in the ‘control’ group reported being ‘probably sure’ about their vote, this correction affects only the ballot box group.
Percentage of ‘yes’ responses in the control and ballot box treatments after recoding ‘probably sure’ yes votes to ‘no’ votes

4.2. Multivariate analysis
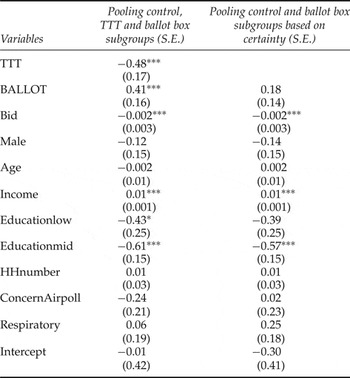
We estimate multivariate probit models to analyze the decision to vote for the program. Because we do not observe protest responses in the ballot box treatment, for consistency we do not drop protesters/scenario rejecters in these models but treat them all as simple ‘no’ responses, possibly underestimating population WTP. The coefficients for the bid (the electricity surcharge) and income are both highly statistically significant and of the expected sign. Consistent with previous studies, the coefficient on time to think is negative and statistically significant (table 4). Respondents who completed 8–14 years of schooling are less likely to vote for the air quality program than those with a university degree. When we drop protest responses in the control and TTT subsamples, the coefficients on time to think, bid, and income all remain statistically significant and have similar magnitudes (table A7).Footnote 10 After controlling for socio-economic characteristics, ballot box respondents are more likely to vote yes in the SBDC exercise than control respondents, although their responses are no different after adjusting for uncertainty.
4.3. Willingness-to-pay estimates
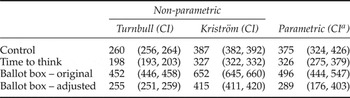
The non-parametric Turnbull ‘lower bound’ mean WTP from the SBDC exercise are reported in CFA francs in table 5; for international comparison these are US$0.48, US$0.37 and US$0.85 per household for the control, TTT and ballot box groups, respectively. Kristrom mid-point mean WTP is US$0.72, US$0.61, and US$1.22 for the control, TTT and ballot box groups, respectively. Time to think reduced the lower bound WTP by 24 per cent compared to the control group, and reduced the Kristrom ‘mid-point’ mean by 16 per cent. A t-test of differences in mean WTP is significant at the 1 per cent level, and 95 per cent confidence intervals calculated following Vaughan and Rodriguez (Reference Vaughan and Rodriguez2001) do not overlap. The ballot box treatment increased Turnbull WTP by 74 per cent, although the difference is much smaller after correcting for uncertainty (by recoding ‘probably sure’ votes as ‘no’ votes). These WTP figures are underestimated since we treat all ‘no’ responses the same, even though some of the respondents answering ‘no’ might have in fact been willing to pay something to reduce air pollution with a different program. Excluding protest responses, the Turnbull mean WTP is US$0.75 and US$0.48 for the control and TTT groups (table A9).
Probit model of SBDC response
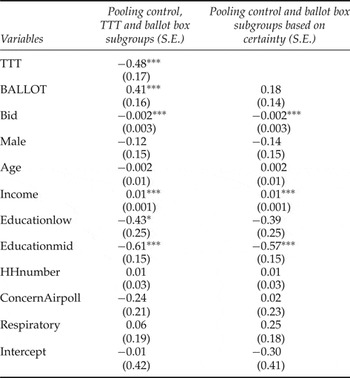
Notes: *p<0.10; **p<0.05; ***p<0.01. TTT takes 1 and 0 for the control. Ballot box takes 1 and 0 for the control.
We calculate the parametric mean WTP of the SBDC following Cameron and James (Reference Cameron and James1987). Mean WTP is US$0.70, US$0.61 and US$0.93 per household for the control, TTT and ballot box subgroups, respectively (table 5). Correcting for uncertainty, the mean WTP drops to US$0.54 for the ballot box group. We also compare the mean WTP across the three treatments using a bootstrap technique (Efron and Tibshirani, Reference Efron and Tibshirani1993). We simulate mean WTP using 1,000 replications, saving the results of each simulation. We then load and merge the two data sets and calculate the differences in mean WTP. Once a difference in mean WTP is calculated, the p-value is also calculated to test the corresponding null hypothesis of equality of the mean WTP of control and TTT. The lower the p-value relative to conventional significance levels, the more likely the mean WTP in the control group is higher than the mean WTP in the TTT group. Compared to the control group, mean WTP of the TTT group is significantly lower (p-value = 0.07), and mean WTP among the ballot box group is significantly higher (p-value = 0.00). After we adjust for uncertainty in the control and ballot box samples, however, there is no statistically significant difference (p-value = 0.49) in mean WTP between the two groups.
Mean WTP (CFA francs) for SBDC, by experimental group
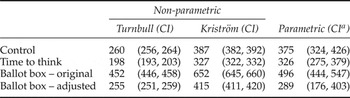
Notes: CI means 95% confidence intervals. US$1 = 534 CFA francs.
a The 95% confidence interval of the mean WTP, obtained by bootstrap on 1,000 draws.
4.4. Debriefing questions on the control and time to think study
The most common reason respondents gave for agreeing to the plan was ‘good health’. Seventy-three per cent of respondents in the TTT subsample said they used the opportunity to discuss their answers with their spouses, family members, friends or neighbors. The average time respondents reported that they spent thinking about the task is 30 minutes (see online appendix figure A3 for the distribution). We used these debriefing questions to investigate how the elements of time to think might influence WTP responses. A continuous variable of minutes spent thinking (zero for the control group) was not statistically significant (p-value = 0.6), nor was a dummy variable for whether the respondent discussed the decision (p-value = 0.24).
4.5. Retests among control and ballot box subgroups
When given the opportunity to revise their answers after a day of reflection, only three of 169 respondents in the control group and four in the ballot box group changed their answers to the SBDC question. All seven changed their responses from ‘no’ to ‘yes’. Not surprisingly, the multivariate results do not change (table A10). This remarkable degree of preference stability contrasts with results in Cook et al. (Reference Cook, Whittington, Canh, Johnson and Nyamete2007), where a sizeable number of control respondents revised their answers downwards and mean WTP with and without time to think became indistinguishable. Not surprisingly, WTP estimates are also very similar (see tables A16 and A17).
5. Discussions
We begin with a discussion of the methodological results before turning to how our results might be used for policy in Douala. Consistent with previous studies, we find that time to think reduces average WTP estimates compared to a control group who do the valuation exercise in the ‘conventional’ way. Mean parametric WTP from the SBDC responses is 13 per cent lower with time to think; non-parametric measures are 24 per cent lower (Turnbull) and 16 per cent lower (Kristrom). This result remains after controlling for other important determinants of WTP and after adjusting for possible protest responses, although we are unable to test whether adjusting the respondents' certainty in their answers would affect this result. Consistent with a number of test-retest studies but inconsistent with Cook et al., (Reference Cook, Whittington, Canh, Johnson and Nyamete2007), however, we find that responses and mean WTP are stable when control (and ballot box) respondents are given a chance to reconsider their responses. This result is somewhat puzzling, since these respondents would have had the same opportunity as TTT respondents to reflect on their budget constraints and discuss the decision with their spouses. They also had one day to reflect, and the enumerator primed them to reconsider their answers.Footnote 11
Why did they not revise their answers, and in particular why did they not revise them downwards? One obvious explanation is that control and ballot box respondents anchored on their initial decisions. Unlike Cook et al. (Reference Cook, Whittington, Canh, Johnson and Nyamete2007), our respondents did a stoplight exercise in the first interview that asked them to think carefully about the range of prices they would pay, which may have further anchored responses. Even though they were given the opportunity to reflect, they may not have used it because they felt they had already completed the task; the cognitive costs were not worth the benefit. Unfortunately, we did not ask control or ballot box respondents if they discussed the decision or how long they spent thinking about the task. Unlike both Leggett et al. (Reference Leggett, Kleckner, Boyle, Dufield and Mitchell2003) and Subade (Reference Subade2005), we find higher WTP with a ballot box approach, although the difference disappears if we correct for uncertainty by recoding ‘probably sure’ yes votes to no votes.
What is our best estimate of household WTP for policy purposes? We believe that time to think provides respondents with an opportunity to carefully consider their votes and their budget constraints, similar to that which would occur in a real citywide referendum on the program. While not all residents would take advantage of the opportunity to think about their votes, many would. We therefore feel most confident in these time to think estimates.
With regard to estimation technique, the non-parametric approach yields a lower bound and a midpoint WTP estimate of 225 CFA francs (US$0.42) and 360 CFA francs (US$0.67), while the WTP estimate from the parametric approach is 353 CFA francs (US$0.66). These results exclude protest responses (see tables A8 and A11) but also do not adjust for certainty. In the benefit-cost calculations below, we use the more conservative, less bias-prone estimate of 225 CFA francs (US$0.42), representing 0.2 per cent of average household annual income in our sample. Using this estimate, the total annual citywide benefit for a 25 per cent reduction in the health effects of air quality is 400 million CFA francs (US$749,064).Footnote 12
We do not have the ability to identify exactly what policies would lead to a 25 per cent reduction in air quality related morbidity in Douala. Nevertheless, a rough comparison with some of the costs of the program described in the scenario may be illustrative. Using figures from the Douala Urban Council, we estimate a program to plant 1,000 seedlings might cost 7.6 million CFA francs (US$14,217).Footnote 13 The Cameroon transportation bureau estimated that there were approximately 2,300 minibuses on Douala roads in 2000 (the most recent estimate available) that were 15 years old or older. We assume there are now 3,000 minibuses of that vintage. The current market price for an older minibus is between 3 million and 4 million CFA francs (between US$5,618 and US$7,491). The cost to remove all 3,000 minibuses from the road would thus be 9–12 billion CFA francs (US$16.9 million–US$22.5 million). This investment in trees and minibus buybacks would have effects for more than just one year, however. To make them more commensurate with our annual estimate of benefits, we convert the costs to annual values by assuming that the tree planting and buybacks will have effects over 10 years and that the social discount rate is 10 per cent. The annualized cost of the tree planting program is thus approximately 1.24 million CFA francs, and the minibus buyback is 1.46–1.95 billion CFA francs (US$2.7 million–US$3.7 million). Our conservative estimate of citywide WTP for the air quality program (400 million CFA francs or US$749,064) is clearly insufficient to fund a complete buyback program. It would be sufficient to purchase approximately one-quarter of old minibuses at a price of 3 million CFA francs per bus,Footnote 14 although again we do not know whether this program would be sufficient to cause a 25 per cent drop in air pollution morbidity. Using our least conservative WTP estimate of 652 CFA francs (US$1.22) per household (from the Kristrom midpoint estimate in the ballot box sample, before correcting for uncertainty) still does not yield sufficient benefits to cover the entire cost of the program, though at US$2.17 million it is much closer.Footnote 15
Supplementary materials and methods
The supplementary material referred to in this paper can be found online at journals.cambridge.org/EDE/.