INTRODUCTION
Feeding is one of the main activities influencing the fitness of fish species, since growth, maturation and mortality depend, directly or indirectly, on food supply (Wootton, Reference Wootton1990). Therefore, data derived from dietary studies can be used in fisheries research through integrating the data with appropriate fisheries models, such as multispecies virtual population analysis, and can be scaled up to the total biomass of predators and prey, information which provides estimates of the total biomass consumed by predators (Jennings et al., Reference Jennings, Kaiser and Reynolds2001).
Moreover, studies on the feeding habits of fish are essential for understanding ecological issues such as resource-partitioning and within- and between-species competition, prey selection, predator–prey size relationships, ontogenetic dietary shifts, habitat selection and invasions (e.g. Harmelin-Vivien et al., Reference Harmelin-Vivien, Kaim-Malka, Ledoyer and Jacob-Abraham1989; Golani & Galil, Reference Golani and Galil1991; Stergiou & Fourtouni, Reference Stergiou and Fourtouni1991; Hughes, Reference Hughes and Godin1997; Labropoulou et al., Reference Labropoulou, Machias, Tsimenides and Eleftheriou1997, Reference Labropoulou, Machias and Tsimenides1999; Labropoulou & Machias, Reference Labropoulou and Machias1998; Pauly, Reference Pauly, Froese and Pauly2000; Scharf et al., Reference Scharf, Juanes and Rountree2000).
Finally, if we consider that traditional assessment models and management strategies in fisheries have failed (e.g. Beverton, Reference Beverton1998; De La Mare, Reference De La Mare1998; Smith, Reference Smith1998; Stokes et al., Reference Stokes, Butterworth, Stephenson and Payne1999; Stergiou, Reference Stergiou2002), feeding-habit studies are necessary for the ecosystem-based management of aquatic resources, through the estimation of trophic levels (Pauly & Christensen, Reference Pauly, Christensen, Froese and Pauly2000; Pauly & Sala, Reference Pauly, Sala, Froese and Pauly2000). Such failures are generally the result of the highly diversified and complex effects of overfishing on the life histories of individual species and on the ecosystems in which these species are embedded (e.g. Jennings & Kaiser, Reference Jennings and Kaiser1998; Jennings et al., Reference Jennings, Kaiser and Reynolds2001; Stergiou, Reference Stergiou2002). Therefore, the compilation of stomach content data seems to be one of the most important steps for the development of ecosystem models through the use of various modelling tools.
The aim of the present work was to study the feeding habits of Cyclopsetta querna (Jordan & Bollman, 1890), a widely distributed flatfish species of the tropical and subtropical Eastern Pacific (southern Baja and the Gulf of California to Peru) (Robertson & Allen, Reference Robertson and Allen2006). This species inhabits sandy bottoms in the continental shelf at depths of less than 50 m, but it can be found to depths of up to 100 m (Amezcua-Linares, Reference Amezcua-Linares2009). It is also commercially exploited. In the studied area, the species is caught by trawl and gill net artisanal fisheries all year round (Fischer et al., Reference Fischer, Krupp, Schneider, Sommer, Carpenter and Niem1995; Amezcua-Linares, Reference Amezcua-Linares2009) because of its high abundance and biomass, which also makes it an important component of the bycatch from the shrimp trawl fishery operating in the studied area (Madrid-Vera et al., Reference Madrid-Vera, Amezcua and Morales-Bojorquez2007); according to these authors, C. querna accounts for 2.8% in biomass and 2.2% in abundance of demersal fish species in the area. During 2007, landings of C. querna were close to 1200 metric tons in the Mexican Pacific; in the area of our study, landings were close to 200 metric tons according to CONAPESCA (National Commission of Aquaculture and Fisheries, Mexico, http://www.conapesca.sagarpa.gob.mx).
However, biological information on C. querna is scarce. In general, biological data on tropical and subtropical flatfish are very limited (Reichert et al., Reference Reichert, Dean, Feller and Grego2000). Few studies undertaken on this species have focused on aspects of its distribution (e.g. Coronado-Molina & Amezcua-Linares, Reference Coronado-Molina and Amezcua-Linares1988; Tapia-Garcia et al., Reference Tapia-Garcia, Garcia-Abad, Gonzalez-Medina, Macuitl, De Guevara and De Guevara1994). Studies on other biological characteristics of this species, such as age and growth (Amezcua et al., Reference Amezcua, Martínez-Tovar, Green-Ruiz and Amezcua-Linares2006), and feeding habits (Perez-España et al., Reference Perez-España, Saucedo-Lozano and Raymundo-Huizar2005), are scarce, with the last one focused primarily on the trophic interactions of C. querna with another nine demersal species, rather than a detailed examination of the diet of C. querna. A thorough study into the diet of C. querna has yet to be undertaken.
The objective of the present study was to present detailed information on the diet composition, the niche breadth and the trophic level of C. querna. Considering the abundance and commercial importance of this species in the south-east Gulf of California, this work, moreover, provides basic data for the development of multispecies assessment models of this area, with the ultimate goal of developing an ecosystem-based management project within the demersal fish community of the south-east Gulf of California.
MATERIALS AND METHODS
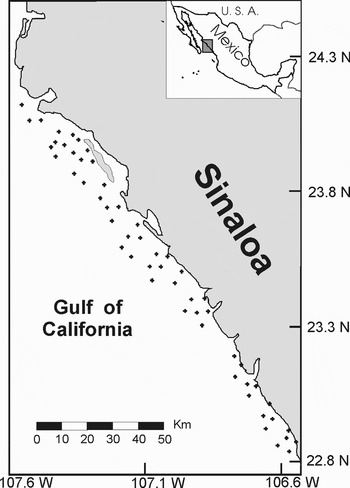
Demersal fishing surveys were carried out by the National Fisheries Institute of Mexico (INAPESCA) during the shrimp closed season, from May to August, on the coasts of Sinaloa (south-east Gulf of California) at monthly intervals. The samples came from surveys undertaken during the closed seasons of 2004 and 2005. A total of 59 stations were surveyed over a period of two weeks on board commercial vessels (Figure 1). At each station, two commercial trawls fitted with a 30 mm liner in the cod end and average door spreads of 34.9 m were towed at 2.3 knots over one hour. A stratified survey design (depth and area) with fixed positions was applied. After each tow collection, individuals of C. querna were frozen on board. Additional samples were obtained from the local shrimp fleet during the shrimp open season from September 2005 to March 2006 and from December 2007 to January 2008 at monthly intervals. The fishing gear of the local shrimp fleet was the same as described above. In the laboratory, total length (TL, cm) and wet weight (g) were recorded for each specimen; each individual was dissected, sexed, and the stomachs were removed. Stomach contents were observed under a stereoscopic microscope. The prey items, identified to the lowest possible taxonomic level on the basis of their digestion state, were counted and weighed to the nearest milligram after removal of surface water by blotting paper.
Map of the studied area showing the sampling locations.

The vacuity index (VI), used to calculate the rate of feeding activity, gives the proportion of empty stomachs via the formula:

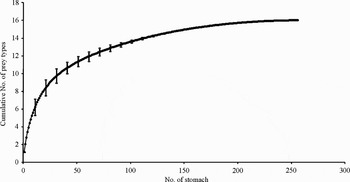
To assess whether the number of samples analysed was sufficient to describe the diet of this species, a randomized cumulative curve was obtained by plotting the new prey types against the number of non-empty stomachs (Ferry & Caillet, Reference Ferry, Caillet, MacKinlay and Shearer1996). The PRIMER statistical package, version 5.2.2, was used to estimate a prey species accumulation plot by randomizing the order of the stomachs. On average, 9999 randomizations were performed. To statistically assess whether the curve reached an asymptote, logarithmic and linear regressions were calculated, and their goodness-of-fit coefficients R 2 were compared: the sample size was considered sufficient if the R 2 for the logarithmic curve was higher than that for the linear relationship. The standard deviation was calculated and represented on the graph for every 10th stomach.
To quantitatively express the importance of different prey in the diet of C. querna, the frequency of occurrence (%O = (number of stomachs containing prey i/total number of stomachs containing prey) × 100), percentage abundance (%N = (number of prey i/total number of prey) × 100) and percentage weight (%W = (weight of prey i/total weight of all prey) × 100) were calculated (Hyslop, Reference Hyslop1980). To assess prey dominance, the index of preponderance (Ip) was used (Marshall & Elliot, Reference Marshall and Elliot1997). This index ranks prey in order of numerical dominance within the diet and is calculated using the formula:

where Wi and Oi are percentage weight and occurrence, respectively. For this analysis, and all those given below, only stomachs that contained food were used; empty stomachs were not used.
To evaluate the niche breadth, Simpson's diversity index (D) was used. This index gives the probability that any two individuals drawn at random from an infinitely large community belong to the same species. The form of the index appropriate for a finite community is
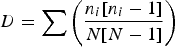
where n i is the number of individuals in the ith species, and N is the total number of individuals. As D increases, diversity decreases; this index is therefore expressed as 1/D, so that the larger its value, the greater the diversity. This index also captures the variance in the species abundance distribution (Magurran, Reference Magurran2004). Confidence intervals for Simpson's index were generated using a bootstrap procedure, which is a technique that allows the estimation of sample variability by resampling from the empirical probability distribution defined by a single sample. A bias-corrected 95% confidence interval was obtained from 1000 bootstrap samples of the species (Efron & Tibshirani, Reference Efron and Tibshirani1993; Haddon, Reference Haddon2001). The calculation of Simpson's index and the bootstrap method were performed using the software Species Diversity and Richness IV (Pisces Conservation Ltd, 2006).
To examine dietary similarities between fish length, sampled months and sex (factors), non-metric multidimensional scaling (MDS) analyses were applied to Bray–Curtis similarity indices between pairs of samples. The data were arranged into a matrix comprising the weight (g) of each prey item, and each stomach was labelled with the sex, month and length group; length groups of 2 cm were formed. The data were fourth-root transformed to reduce the effect of very abundant prey on the analysis while retaining the quantitative nature of the data. All data were standardized to the percentage of total biomass accounted for by each species, to eliminate the effect of differing sample size. Rare prey items (<4% in any sample) were removed (Clarke & Warwick, Reference Clarke and Warwick1994). A total of three dimensions were used. To check for statistical evidence that the diets differed among sex and season, an analysis of similarity (ANOSIM, PRIMER) was employed using R-statistic values for pair-wise comparisons to determine the degree of dissimilarity between groups. R-values lie in the range of 0 to 1; values close to 1 show that the composition of the groups are different, whereas values close to 0 demonstrate that the null hypothesis is true and that there is little difference in composition between those groups. A statistical test in which the P value was less than 0.05 was deemed as being different (Clarke & Warwick, Reference Clarke and Warwick1994). A multivariate multiple permutations test, SIMPER (Similarity Percentages, PRIMER), was used in order to determine which prey categories, within each group, accounted for most of the dissimilarities between the compositions of the different sexes and the different months when they were significantly different (Clarke & Warwick, Reference Clarke and Warwick1994). All the analyses were performed using PRIMER 5 (Clarke & Warwick, Reference Clarke and Warwick1994; Plymouth Marine Laboratory, 1996).
Finally, diet composition data were also used for the estimation of the trophic level of the toothed flounder, using the TrophLab software (June 2000 version; Pauly et al., Reference Pauly, Froese, Sala, Palomares, Christensen and Rius2000). With this software, a trophic level or TROPH value is obtained that expresses the position of organisms within the food webs that largely define aquatic ecosystems. To estimate the TROPH of fish, we must consider both their diet composition and the TROPH values of their food item(s). The TROPH of fish species i is then estimated from

where DC ij is the fraction of prey j in the diet of consumer i, TROPH j is the trophic level of prey j, and G is the number of groups in the diet of i. The standard error (SE) of the TROPH was estimated using the weight or volume contribution and the trophic level of each prey species to the diet. If such trophic levels are missing, TrophLab uses default TROPH values for various prey (based on data in FishBase, Froese & Pauly, Reference Froese and Pauly2009).
RESULTS
A total of 404 stomachs of C. querna individuals were examined; from these, 84 were males, and 90 were females. The other 230 were small fish below 16 cm in TL, which were assumed to be juveniles, since it was not possible to determine their sex. The length-range of the examined specimens was 6.1 to 33.2 cm.
Of the 404 specimens collected, 148 had completely empty stomachs (vacuity index 36.6%). The same index was performed separately for every sex, with the males showing a vacuity index of 35.7%, the females a vacuity index of 33.3% and the juveniles a vacuity index of 38.3%.
The cumulative prey items curve (Figure 2) for the entire data set fitted better with a logistic curve (R 2 = 0.997; F (2,254) = 510388, P < 0.0001) than with a linear relation (R 2 = 0.877, F (2,254) = 11306.99, P < 0.0001); the sample size was therefore considered sufficient to describe the diet of the toothed flounder.
Prey species accumulation plot as an average of 9999 curves based on different random orders of the stomachs extracted (number of stomachs = 148). Vertical bars represent standard deviation.

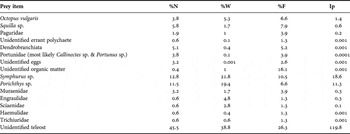
In total, 294 prey items, belonging to 14 taxa, were identified, plus unidentified eggs and unidentified organic matter. Fish were the most frequent (%F = 52.5), abundant (%N = 75.4), had the highest biomass (%W = 90.3) and the highest values of the Ip. Of the identified fish, the most important prey were the tonguefish (Symphurus sp.), which also predominated in terms of percentage by weight, frequency of occurrence and abundance, followed by the midshipman (Porichthys sp.) and moray eels (Muraenidae). Other fish prey of the families Engraulidae, Sciaenidae, Trichiuridae and Haemulidae were occasionally recorded. Of the invertebrates, the most important prey according to the all indices and the Ip, was the common octopus (Octopus vulgaris), although its importance was much lower that that of the fish. The mantis shrimp (Squilla sp.) was also a quite important prey item; its importance was higher that that of some fish. The remaining invertebrates (hermit crabs, shrimps, polychaetes and swimming crabs) showed very low values of all indices and the Ip and were recorded only occasionally (Table 1). The toothed flounder's diet breadth was 4.13 (confidence limits = 2.8–5.7) according to the reciprocal of Simpson's diversity index.
Diet composition of the toothed flounder. Per cent abundance (%N), percentage by weight (%W), per cent frequency of occurrence (%O) and index of preponderance (Ip).

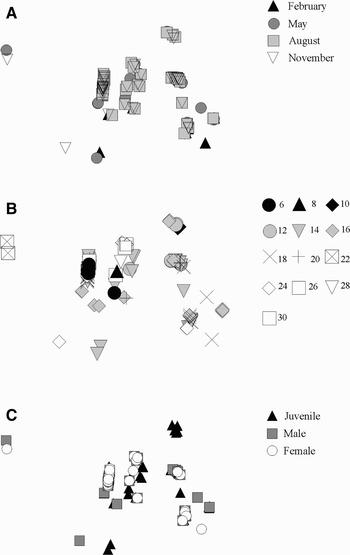
Clear-cut groups between the ordination factors (sex, size and season) were not observed in the MDS plot (stress = 0.01) (Figure 3). On the contrary, all the individuals were mixed together in the groups that were formed, with the exception of one small group comprised only of juveniles (of lengths from 10 cm to 16 cm, although individuals of 14 cm were absent from this group) (Figure 3B, top right).
Two dimensional representation of the non-metric multidimensional scaling analysis based on percentage by weight values (%W) of the 2 cm size-classes. (A) Ordination according to sampling month; (B) ordination according to size-class; (C) ordination according to sex. The stress value was 0.01.

The ANOSIM confirmed that the diet between sex (juveniles versus males: R = −0.006, P > 0.1; juveniles versus females: R = 0.004, P > 0.1; males versus females: R = −0.013, P > 0.1), size groups (global R = 0.049, P > 0.05) and seasons of catch (February versus May: R = −0.012, P > 0.1; February versus August: R = −0.002, P > 0.1; February versus November: R = −0.002, P > 0.1; May versus August: R = −0.009, P > 0.1; May versus November: R = −0.004, P > 0.1; August versus November: R = −0.017, P > 0.1) did not differ significantly. Because differences in the diet were not found according to the analysed factors, SIMPER analysis was not performed.
The estimated TROPH value for the toothed flounder was 4.47 (SE = 0.779).
DISCUSSION
Previous studies on the feeding habits of Paralichthyidae species from the Pacific coast of Mexico are scarce, and for the Gulf of California non-existent. To our knowledge, this is the first study that describes in detail the feeding habits of the toothed flounder, C. querna, and is certainly the first study on samples of this species caught in the Gulf of California.
The fringed flounder (Cyclopsetta querna) has a diet dominated by demersal fish, which is its most important food source based on both number and biomass, for all individuals, from juveniles to adults, males and females, regardless of the season, and most likely of the area, since the only other work on the diet of this species indicates that demersal fish are also the principal prey of the toothed flounder of the central Pacific coast of Mexico (Perez-España et al., Reference Perez-España, Saucedo-Lozano and Raymundo-Huizar2005). Other prey such as benthic invertebrates were recorded occasionally. Of these, the most important were the common octopus, followed by the mantis shrimp, which was also important in the study of Perez-España et al. (Reference Perez-España, Saucedo-Lozano and Raymundo-Huizar2005), although in that study, the octopus was not identified as an item eaten by the toothed flounder.
Among fish prey, the most important according to all feeding indices were the tonguefish, the toadfish and moray eels—all demersal species with a water column position exclusively at the bottom (Robertson & Allen, Reference Robertson and Allen2006). After these prey items, in order of importance, were the common octopus and the mantis shrimp. These five items account for almost 40% of importance with all feeding indices and have the highest values of the index of preponderance, if the unidentified fish is not taken into account, because in this category is the most important prey item. However, it can be assumed that all the unidentified fish prey are in the same proportion of the fish that we were able to identify.
From these results it can be concluded that the toothed flounder is an active predator that preys almost exclusively on the bottom, but that has the capability to prey on other fish species that exclusively inhabit the water column, such as fish species of the family Engraulidae and family Sciaenidae, possibly when these species approach the bottom, probably to search for prey themselves.
Ambushing a continuing supply of fish and invertebrate prey seems to be the preying strategy of the toothed flounder, since the most important prey items are active species, such as swimmers (fish and octopus) or errant organisms (mantis shrimp). Feeding on other prey items such as polychaetes or crabs might require the fish to move around in search of this type of prey, possibly increasing the risk of predation. On the other hand, ambushing is energetically more beneficial and may reduce predation risk (Reichert, Reference Reichert2003).
Our results are in accordance with those reported by Perez-España et al. (Reference Perez-España, Saucedo-Lozano and Raymundo-Huizar2005) for the same species on the Central Pacific coast of Mexico, where they found that the family Congridae and the flatfish Syacium ovale accounted for 88.5% of the diet. These prey species also exclusively inhabit the bottom.
To quantitatively measure the niche breadth of the toothed flounder, we used the inverse of Simpson's index (1/D), which is sensitive to the level of dominance in a community and is considered one of the most meaningful and robust diversity measures available (Magurran, Reference Magurran2004). Unfortunately, this index has not been widely used to describe the diversity and evenness of the prey assemblage, so comparison with other works could not be made. However, the reciprocal of Simpson's index can reach values of more than 9 (Magurran, Reference Magurran2004), so the observed value for this index (4.13) might indicate that the diet of this species focus only on a few items of those available in the system that the population inhabits. This may be why it ambushes only certain prey types, probably as a way of resource partitioning with other sympatric species.
The multivariate analyses allowed us to determine that the diet of the toothed flounder does not vary significantly according to the season, sex or length. The main prey items for this species are mainly tonguefish, toadfish and moray eels, leaving the invertebrates and other fish species as marginal prey. Therefore, the MDS and ANOSIM could not detect statistical differences in the diet, because although differences may exist, these are minimal.
Although information on the trophic levels of other demersal fish species from the studied area is scarce, our results indicate that the toothed flounder is a top predator in the system. Usually in marine ecosystems, consumers have TROPH values that range between 2.0, for herbivorous/detrivorous organisms, and 5.0, for piscivorous/carnivorous organisms (Cortés, Reference Cortés1999). Demersal and benthopelagic inhabitants in the studied area from which TROPH values have been estimated have values that range from 2.5 for species such as the flathead mullet (Mugil cephalus) to 4.5 for species such as the Pacific sierra (Scomberomorus sierra) and the Mexican barracuda (Sphyraena ensis) (Froese & Pauly, Reference Froese and Pauly2009). Even the Pacific sharpnose shark (Rhizoprionodon longurio) and the scalloped hammerhead (Sphyrna lewini), both inhabitants of the studied area, have smaller TROPH values (4.2 and 4.1 respectively) (Froese & Pauly, Reference Froese and Pauly2009).
In our study, the TROPH value of 4.47 found for the toothed flounder is practically the same as those of the Pacific sierra and the Mexican barracuda, the top predators of the studied area, according to the available information. Hence, the toothed flounder can be considered one of the top predators in the demersal and benthopelagic ecosystem of the Gulf of California according to the TROPH results.
The detailed information presented in this study will be useful in ecological modelling as we move toward multispecies assessments and a better understanding of the interactions among top predators and their prey, which would eventually result in a better representation of the trophic flows associated with demersal fish in the Gulf of California. Nevertheless, to achieve this it will be necessary to continue with these types of studies for other species inhabiting the area, as well as monitoring activity regarding fishery landings, fishing efforts and variations in biotic and abiotic factors in the area over a long period, so as to fulfil the requirements of an ecosystem approach to fisheries.
ACKNOWLEDGEMENTS
The National Institute of Fisheries (INAPESCA), through the Regional Centre of Fisheries Research in Mazatlan (CRIP-Mazatlan) donated to us samples for this study. This work was funded by the research project PAPIIT-IN217408-3.