I. INTRODUCTION
Generally, metal oxide semiconductor materials (such as SnO2, CdO, and ZnO) have been considered in recent years due to their superior electrical and optical properties. Amongst these materials, zinc oxide (ZnO) plays a key role in the synthesis of transparent conducting oxide (TCO) materials. Because of it has high optical transparency in the visible and IR range and good electrical conductivity, also it is a hopeful metal oxide material which is used in optoelectronic devices.Reference Kamalianfar, Halim and Zak1,Reference Li, Chung, Han and Lin2 Zn and O belong to group II and group VI semiconductors, respectively; with wide band gap (3.36 eV) also it has bulky binding energy i.e., 60 meV.Reference Bahadur, Srivastava, Sharma and Chandra3 Various metal ion-doped ZnO thin films are found to have technological importance because of their potential applications such as transparent conducting electrodes (TCOs), solar cells, light-emitting diodes, optoelectronics,Reference Han, Han and Tao4–Reference Ansari, Ansari, Foaud and Cho6 etc. Therefore, properties of the ZnO film are easy to modify through various doping elements like aluminum, magnesium, gallium, cadmium, and indium.Reference Stadler7 In particular, aluminum-doped ZnO (Al:ZnO) thin films have good opto-electrical properties with lesser material cost compared to commercial ITO and FTO films. Furthermore, these properties of the ZnO thin film make it attractive for large-scale coating devices.
Previously, aluminum-doped zinc oxide (AZO) thin films were prepared by different methods such as RF magnetron sputtering,Reference Addonizio, Antonaia, Cantele and Privato8 PLD,Reference Gâlcă, Secu, Vlad and Pedarnig9 CVD,Reference Kim, Maeng, Kim and Kim10 SILAR method,Reference Edison, Nirmala, Kumar, Valanarasu, Ganesh, Shkir and AlFaify11 sol–gel dip,Reference Kumar, Ganesh, Shkir, AlFaify and Valanarasu12 conventional spray pyrolysis,Reference Mahmood and Park13 sol–gel spin,Reference Kumar, Valanarasu, Kathalingam, Ganesh, Shkir and AlFaify14 and electrodeposition.Reference Schmerber, Dinia, Baka, Azizi and Velumani15–Reference Chen, Chen, Chen, Zhou, Li, Ren and Hu17 Amongst them, electrodeposition is the simple and well-established method for the production of metal oxide thin films with different morphological shapes.Reference Khelladi, Mentar, Beniaiche, Makhloufi and Azizi18 In addition, the electrodeposition method has several advantages such as low cost, low temperature, easy production, and large area deposition.Reference Thomas and Cui19,Reference Li, Bu, Zheng, Su and Tong20 Furthermore, the preparation of AZO thin films by electrodeposition is also environmentally safe, and nontoxic chemicals were used in the electrolytic bath.
In the present work, transparent conducting AZO thin films are deposited onto the prepared FTO substrates via the electrochemical deposition method using Zn (NO3)2 as a zinc precursor and (AlCl2·6H2O) as an Al3+ source. The optimized condition of electrochemically deposited AZO films at various potential voltages ranging from −1.7 to −2.3 V in steps of 0.2 V is varied. After the deposition of AZO thin films, various structural, optical, morphological, and electrical properties are characterized and discussed.
II. MATERIALS AND METHODS
A. Precursor solution preparation
Zinc nitrate hexahydrate [Zn (NO3)2·6H2O, 98% purity] and aluminum chloride hexahydrate [AlCl3·6H2O, 99.9%] purchased from Sigma-Aldrich (St. Louis, Missouri) and Alfa Aesar (Ward Hill, Massachusetts), respectively, were used as the host and doping precursors. Distilled water and ammonium hydroxide (NH4OH) were used to prepare the precursor solution.
The precursor solution preparation steps are as follows:
(i) 0.1 M of zinc nitrate hexahydrate (host precursor) was dissolved in 25 mL of distilled water.
(ii) In addition, 4% of aluminum chloride hexahydrate (doping precursor) was dissolved in the above zinc solution, and further, the mixed zinc aluminum solution was continuously stirred at room temperature for 10 min using a magnetic stirrer.
(iii) Ammonium hydroxide (NH4OH) was added dropwise into the above solution, until getting a clear solution, the pH value of which was 9.
(iv) The resultant solution was stirred for 15 min at room temperature to form the zinc ammonia complex ([Zn (NH3)4]2+) solution.
(v) Finally, the ([Zn (NH3)4]2+) solution was ready to prepare the AZO thin film using electrochemical deposition.
B. AZO thin film preparation
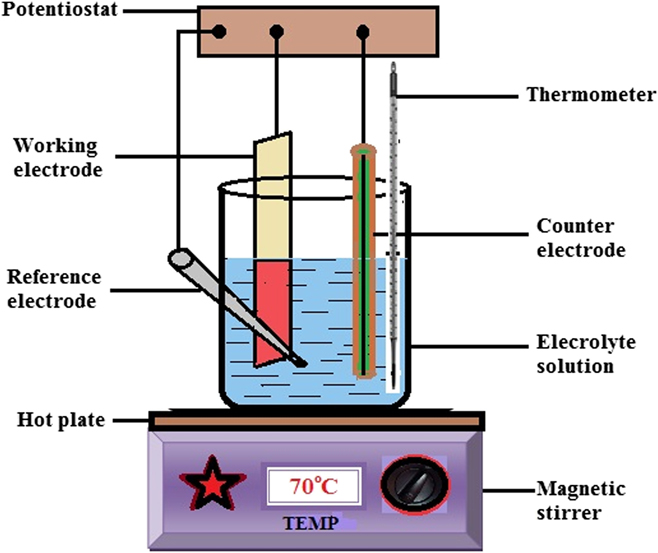
An FTO transparent glass plate was used as the working electrode to prepare AZO thin films. Highly transparent FTO thin films (resistivity, 5 Ω/cm2) have already been reported.Reference Kumar, Valanarasu, Jeyadheepan, Kim and Vikraman21 Before the electrodeposition process, the FTO electrode was ultrasonically cleaned in water, ethanol, and acetone to remove the impurities. For the electrodeposition method, the container containing the prepared zinc ammonia complex solution was kept on the hot plate maintained at a constant temperature of 70°C (±2 °C). The schematic diagram of the electrochemical deposition process is shown in Fig. 1. The deposition process mainly depends on the three-electrode system. The working electrode (FTO) and the counter electrode (platinum wire) were vertically immersed into the zinc ammonia complex solution and held using a sample holder. The reference electrode (Ag/AgCl/3 M KCl) was fixed at one side of the electrochemical solution with 45° inclination. Because the reference and working electrodes should be as close as possible for film preparation, the distance between the reference and working electrodes and between the reference and counter electrodes were set to be 1 cm and 2.5 cm, respectively.Reference Chevva, Palla and Sankaranarayanan22 For the preparation of uniform AZO thin films on the entire working electrode area, all three electrodes were placed in the same position. During the deposition process, the applied potential was varied from −1.7 to −2.3 V for preparing different AZO films, which are named as A (1.7 V), B (1.9 V), C (2.1), and D (2.3).
Schematic diagram of the electrochemical deposition process.

C. Film characterization
The deposited AZO thin film structure was analyzed by X-ray diffraction (XRD) using (Cu Kα) radiation at 45 kV (Cu Kα 1, λ = 0.154056 nm). The electrodeposited AZO film surface morphology was carried out using a scanning electron microscope (SEM) with the same magnification. Optical properties such as transmittance were characterized using a Shimadzu 2401PC (Kyoto, Japan) spectrophotometer in the UV-IR regions. Thicknesses were analyzed using a stylus-profilometer (model: Nano Map 500ES). The photoluminescence (PL) spectrum was recorded using a PerkinElmer LS55 (Waltham, Massachusetts) fluorescence spectrophotometer with a 325 nm excitation wave length. The electrical characteristics were studied on the Hall effect measurement with an ECOPIA system.
III. RESULTS AND DISCUSSION
A. Growth mechanism of Al:ZnO nanostructures
In general, the electrodeposition of ZnO nanostructures depends on the creation of hydroxide ions (OH−) by cathode reduction of the oxygen precursor in Zn (NO3)2 solutions. The hydroxide ions are chemically reacted with zinc metal ions in the solution to get zinc metal hydroxide on the cathode.Reference Therese and Kamath23,Reference Chaim, Zhitomirsky, Gal-Or and Bestgen24 The Zn2+ and OH– ions react resulting in the growth of the ZnO nanostructure on the electrode surface from the cathode, and the reactions are as follows:Reference Izaki and Omi25
 $${\rm{Zn}}{\left( {{\rm{N}}{{\rm{O}}_3}} \right)_2} \to {\rm{Z}}{{\rm{n}}^{2 + }} + 2{\rm{N}}{{\rm{O}}_3}^ - \quad ,$$
 $${\rm{N}}{{\rm{O}}_3}^ - + {{\rm{H}}_2}{\rm{O}} + 2{{\rm{e}}^ - } \to {\rm{N}}{{\rm{O}}_2}^ - + 2{\rm{O}}{{\rm{H}}^ - }\quad ,$$
 $${\rm{Z}}{{\rm{n}}^{2 + }} + 2{\rm{O}}{{\rm{H}}^ - } \to {\rm{Zn}}{\left( {{\rm{OH}}} \right)_2}\quad ,$$
 $${\rm{Z}}{{\rm{n}}^{2 + }} + 2{\rm{O}}{{\rm{H}}^ - } \to {\rm{Zn}}{\left( {{\rm{OH}}} \right)_2} \to {\rm{ZnO}} + {{\rm{H}}_2}{\rm{O}}\quad {\rm{.}}$$
Initially, reduction of the zinc nitrate ions helps the production of hydroxide and nitrate ions onto cathodes. Consequently, the interaction between the Zn and hydroxide ions, thus, helps to form zinc hydroxide ions. After the lack of moisture of hydroxides ions, the expected ZnO is formed. In addition, the doping element Al3+ ions in the zinc solution react with OH− ions to form Al2O3; consequently Al ions were incorporated into the ZnO structure.
B. XRD
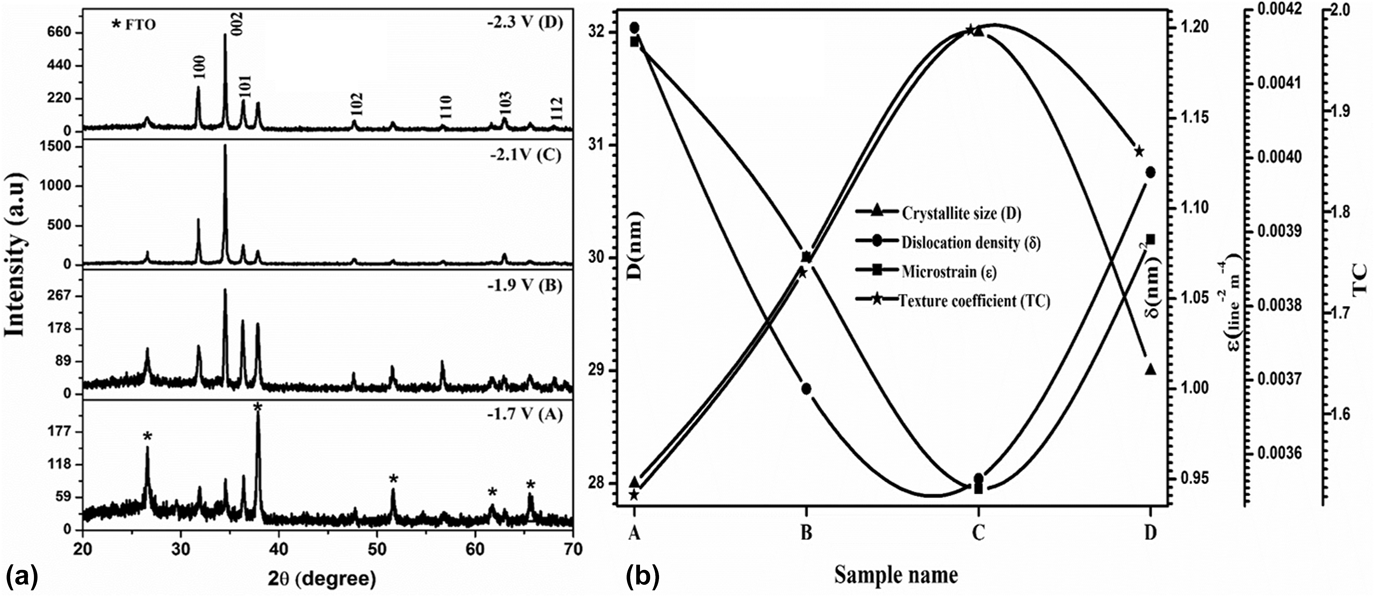
Generally, the XRD study gives detailed information about the crystal structure of the prepared metal oxide films. Figure 2(a) depicts the XRD pattern of all films. From the figure, three predominant peaks (100), (002), and (101) can be observed for 2θ values of 31.75°, 34.62°, and 36.34°, respectively. In addition, several minor peaks such as (102), (110), (103), and (112) can also be observed in the XRD spectrum. All deposited AZO films were polycrystalline in nature and have a hexagonal wurtzite structure of the ZnO lattice. All the observed diffraction peaks of the AZO films correspond to the usual ZnO crystal (JCPDS Card No. 79-0205). Other impurity peaks such as aluminum or aluminum oxides are not detected in the XRD spectrum because the doped aluminum ions are successfully dispersed or incorporated into the Zn sites of the ZnO lattice. However, several additional peaks were identified at 2θ values of 26.58°, 37.8°, 51.68°, 61.7°, and 65.67°. These expected peaks come from the FTO substrate like SnO2 phase corresponds to JCPDS Card No. 88-0287. From the XRD spectrum, it can be clearly found that the intensity of FTO peaks decreased with an increase in potential voltages due to increasing ZnO phase crystallinity. The FTO peak observed in this work agrees with that of a previous report of an FTO thin film obtained using the spray method.Reference Kumar, Valanarasu, Jeyadheepan, Kim and Vikraman21 The XRD patterns of the AZO thin films clearly indicate the improved intensity corresponding to the (002) plane, representing preferential orientation along the c-axis. The (002) peak intensity increases with an increase of potential voltages, which is attributed to the increase in film crystallinity. The highest intensity was observed using −2.1 V (sample C) potential voltages. However, the peak was decreased for a further increase in potential voltage (−2.3 V), which may be due to the deterioration in the film properties. This result may be due to an increase in the strain level of films on increasing the d-spacing of the respective planes. The crystallite size was obtained from the FWHM of the (002) diffraction peak using the Scherrer equationReference Misra, Shukla, Srivastava and Srivastava26–Reference Shkir, Ganesh, AlFaify, Yahia and Zahran28:
 $$D = {{0.9\lambda } \over {\beta \cos \theta }}\quad ,$$
where λ, θ, and β bear the usual meaning. The β value of the predominant peak (002) was reduced on increasing the potential voltages, and it signifies the increase in the size of crystallite of the AZO films. In fact of improvement in crystallite size may be exposed by the increase in thickness and roughness.Reference Kumar, Valanarasu, Kathalingam, Ganesh, Shkir and AlFaify14 However, the crystallite size was suddenly decreased with higher overpotential (−2.3 V), which may be due to the change in c-axis orientation of the particular plane. From this, it is clear that the sample C (−2.1 V) exhibits high crystallinity compared to others.
(a) XRD patterns and (b) structural parameters of AZO thin films with different potential voltages.

The amount of crystalline defect is determined using the calculation of microstrain and dislocation density by using the following equationsReference Kasar, Deshpande, Gudage, Vyas and Sharma29–Reference Shkir, Kilany and Yahia32:
 $$\varepsilon = {{\beta \cos \theta } \over 4}\quad ,$$
 $$\delta = {1 \over {{D^2}}}\quad ,$$
where D is the crystallite size. The ε and δ of TCO films may also be associated with the lattice misfit.Reference Misra, Shukla, Srivastava and Srivastava26 The variations of ε and δ are shown in Fig. 2(b) and the values are listed in Table I. The calculated ε and δ values are low for a potential voltage of −2.1 V, indicating that lattice defects are reduced. However, these values are slightly increased with the higher overpotential due to the reduction of film crystalline nature. The values of ε and δ for sample C are 3.55 × 10⁻³ and 0.95 × 10¹⁵ lines/m2, respectively.
Structural and lattice parameters of AZO thin films with different potential voltages.

Quantitative analyses of the preferential oriented (002) plane were carried out using the texture coefficient (TC) obtained by the following relationReference Mahalingam, Dhanasekaran, Ravi, Lee, Chu and Lim33:
 $${\rm{TC}}\left( {hkl} \right) = {{{{I\left( {hkl} \right)} / {{I_0}\left( {hkl} \right)}}} \over {N_{\rm{r}}^{ - 1}\sum {{{I\left( {hkl} \right)} / {{I_0}\left( {hkl} \right)}}} }}\quad ,$$
where I(hkl), I 0(hkl), and N represent the observed intensities, standard intensities, and total number of peaks. The variation in the TC values corresponds to the (002) orientation with different potential voltages for AZO thin films as shown in Table I. Typically, the calculated TC value must be at least 1 for any metal oxide thin films. In this work, the observed TC value is >1 (i.e. TC(hkl) > 1). It is exposed that the lack of grains in particular (002) reflection.Reference Kumar, Valanarasu, Kathalingam, Ganesh, Shkir and AlFaify14 The TC values matched well with the previously reported values for AZO films by the sol–gel method.Reference Kumar, Valanarasu, Kathalingam, Ganesh, Shkir and AlFaify14
Lattice parameters ‘a’ and ‘c’ for hexagonal AZO films were calculated by using the following relationReference El-Kadry, Ashour and Mahmoud34 using Miller indices (hkl):
 $${1 \over {{d^2}}} = {4 \over 3}\left\{ {{{{h^2} + hk + {k^2}} \over {{a^2}}}} \right\} + \left\{ {{{{l^2}} \over {{c^2}}}} \right\}\quad .$$
The calculated values of the lattice constants ‘a’ and ‘c’ were found to be 3.226 Å and 5.182 Å, respectively. These observed ‘a’ and ‘c’ values are nearly identical to the common value of JCPDS Card. 79-0205. Calculated lattice constant values are systematically increased from sample A to D, which indicates that the samples have different strain levels for different potential voltages. The lattice parameters and other structural values are presented in Table I.
C. Morphological and elemental analyses
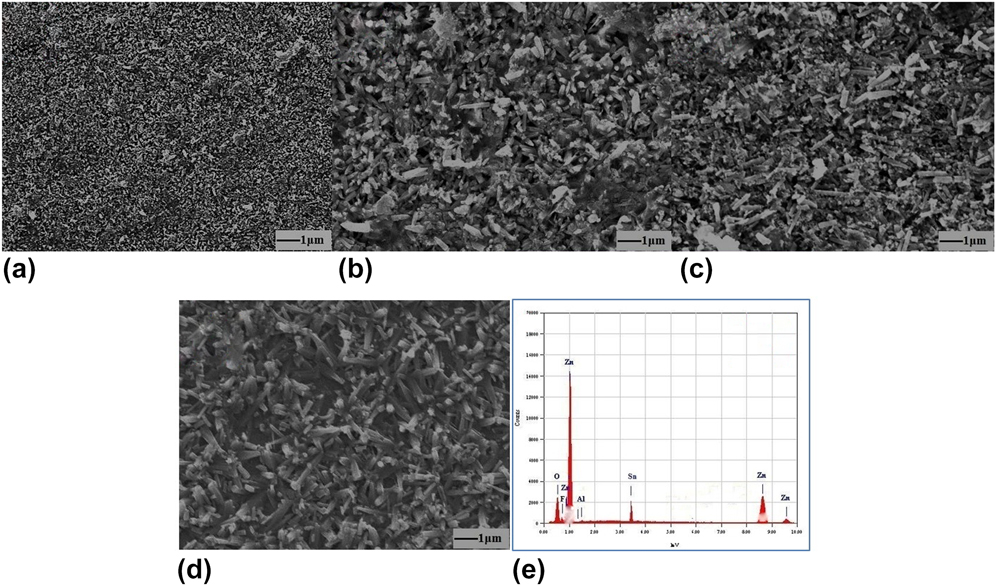
Morphological analysis was carried out to envision the grain growth on the prepared AZO thin film surface. Figures 3(a)–3(d) illustrate the SEM images of electrochemically deposited AZO films with different potential voltages (samples A, B, C, and D, respectively). From Fig. 3, it can be clearly found that the grains of spherical form are homogeneously arranged on the film surface. The particle size from the SEM analysis was observed to be continuously increasing with the increase in potential voltage due to the increase of film thickness. Figure 3(a) shows small spherical-shaped grains with sizes in the range of 45–50 nm for low potential voltages (sample A). Fig. 3(b) clearly shows that the grain structure changed from spherical to nanorod with the grain sizes in the range of 50–60 nm as the potential voltage increased (sample B). Figure 3(c) reveals the structure of nanorod-shaped grains uniformly distributed on top of the film surface without any major pin holes (sample C). Also the grain size was observed to be about 65–70 nm. In general, the uniformly arranged grains help to improve the electrical conductivity caused by increased carrier concentration. Moreover, the AZO grains almost cover the film surface, which expects minimum scattering light owing to the reduction in grain boundaries.Reference Bougrine, Addou, Kachouane, Bérnède and Morsli35 However, the AZO film deposited with a higher overpotential (sample D) showed that the grains are clustered and interconnected with some porous nature all over the film surface, as shown in Fig. 3(d). This may be due to film crystallinity reduction, which agrees with the XRD result. This kind of SEM image can easily affect the film transparency by increasing film thickness (as evident from the UV graph). The SEM micrographs showed that the value of the observed grain size is larger than that of the crystallite size since each grain consists of several crystallites.Reference Goktas, Aslan and Mutlu36,Reference Sabitha, Kumar, Valanarasu, Saranya and Joe37
SEM images of AZO thin films with different potential voltages. (a) −1.7 V, (b) −1.9 V, (c) −2.1 V, and (d) −2.3 V and (e) EDS spectrum of −2.1 V used for the AZO thin film.

The elemental analysis of the electrodeposited AZO thin film (sample C) was studied by EDS spectra as depicted in Fig. 3(e). From the EDS spectrum of the AZO thin film, elements such as Zn, O, Al, Sn, and F were present without any other impurities. Tin (Sn)- and fluorine (F)-related elements present are for the FTO substrate; it is proved with our XRD spectrum. Furthermore, the indicated elements are homogeneously distributed all over the film surface. In the EDS result, small quantities of dopant aluminum elements are successfully dispersed into the ZnO crystal structure. Therefore, this aluminum dispersion factor was helpful in improving the electrical properties.
D. Optical transmittance
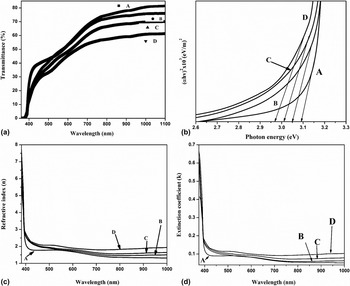
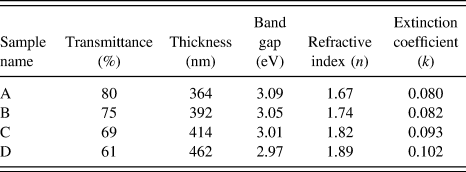
Transmittance is one of the key parameters to analyze the optical properties of any metal oxide film. Optical characteristics of the electrodeposited AZO films are most important for the performance of the optoelectronic device. The optical transmittance spectra of all the films are depicted in Fig. 4(a). From the transmittance spectrum, it is clear that the prepared films have low transparency in the UV spectral range and high transparency throughout the visible and near infrared regions. It indicates that the deposited AZO films have good optical eminence with low scattering. This kind of result is very important because the target is to prepare highly transparent and well-conducting AZO thin films, which can work as electrodes for optoelectronic applications. As the observed transmittance values of AZO films were systematically reduced with a sharp fundamental absorption edge located at 370–380 nm for increasing potential voltage. The observed sharp absorption edge in the lower wave length of the transmission spectra may be due to the electronic transition among the conduction and valence bands.Reference Kumar, Valanarasu, Jeyadheepan, Kim and Vikraman21 Particularly, this area is used to determine the optical energy gap. In addition, the absorption edges shift toward the higher wave length range on increasing the potential voltage. Consequently, the optical band gaps of AZO films were decreased with respect to potential voltage. The observed visible transmittance of the AZO films was decreased with increasing potential voltage due to the increase of films thickness. The observed film thickness values are presented in Table II. In addition, the growth level of the particles is improved by increasing the potential voltage so the light transmission of the prepared film is abridged.
(a) Optical transmittance, (b) plots of (αhν)2 versus hν, (c) refractive index, and (d) extinction coefficient of AZO thin films with different potential voltages.

Optical and dielectric parameters of AZO thin films with different potential voltages.

The direct energy gap (E g) of the deposited films was evaluated from directly allowed transition given by the Tauc’s plotReference Shkir and AlFaify27,Reference Tauc, Grigorovici and Vancu38 :
 $$\alpha h\nu = B{\left( {h\nu - {E_{\rm{g}}}} \right)^n}\quad ,$$
where α, h, ν, and B represent the absorption coefficient, Planck’s constant, photon frequency, and constant measurement, respectively. Figure 4(b) demonstrates the variation of direct gap (αhν)2 versus energy (hν) for all films. In general, the band gap variation mainly depends on the film morphologies by the variation of the film thickness. The calculated optical band gap values decrease in the range of 3.09, 3.05, 3.01, and 2.97 eV with the increase in the potential voltage (samples A, B, C, and D, respectively). This reduced energy gap may be due to the presence of unstructured defects, which could increase the localized states of density in the band gap.Reference El-Zahed, El-Korashy and Rahem39 These values are in good agreement with previous ones.Reference Kumar, Ganesh, Shkir, AlFaify and Valanarasu12 However, the band gap value is low (2.97 eV) for higher overpotential (sample D), which may be due to the reduction of ZnO crystalline nature.Reference Dakhel40,Reference Ravikumar, Chandramohan, Kumar, Valanarasu, Kathalingam, Ganesh, Shkir and AlFaify41 This is proved from the XRD results.
Refractive index plays an important role in any TCO material.Reference Caglar, Ilican and Caglar42 The refractive index (n) of the electrochemically deposited AZO films was determined from the reflectance spectrum using the following equationReference Moss43:
 $$n = {{\left( {1 + R} \right)} \over {\left( {1 - R} \right)}} + \sqrt {{{4R} \over {{{\left( {1 - R} \right)}^2}}} - {k^2}} \quad ,$$
where n, k, and R represent the refractive index, extinction coefficient, and reflectance, respectively. The spectral variation of the refractive index with respect to increasing wavelength is shown in Fig. 4(c). The observed spectral range of n systematically decreases with increasing wave length, due to the increase of transmittance for the same wave length range. At a particular wave length (visible region 650 nm), the observed n values vary from 1.67 to 1.89 for the electrodeposited AZO films (samples A–D). From Fig. 4, it can be found that the n values were increasing for an increase of potential voltage; it may be due to the increase of scattering of light. The obtained n values are in good agreement with those reported earlier.Reference Kumar, Valanarasu, Kathalingam, Ganesh, Shkir and AlFaify14
The extinction coefficient was calculated using the following equationReference Saipriya, Sultan and Singh44:
 $$k = {{\alpha \lambda } \over {4\pi }}\quad ,$$
where, λ, α, and k represent the light wavelength, absorption coefficient, and extinction coefficient. The variation of extinction coefficient with wave length is shown in Fig. 4(d) and these values are listed in Table II. From Fig. 4(d), it is clear that k is very low throughout the wave length; it indicates that the deposited films possess decent transparency and smooth surface roughness.Reference Usha, Sivakumar and Sanjeeviraja45 Moreover, the k value significantly increased, which is similar to n value with respect to the change in different potential voltages.
E. PL study
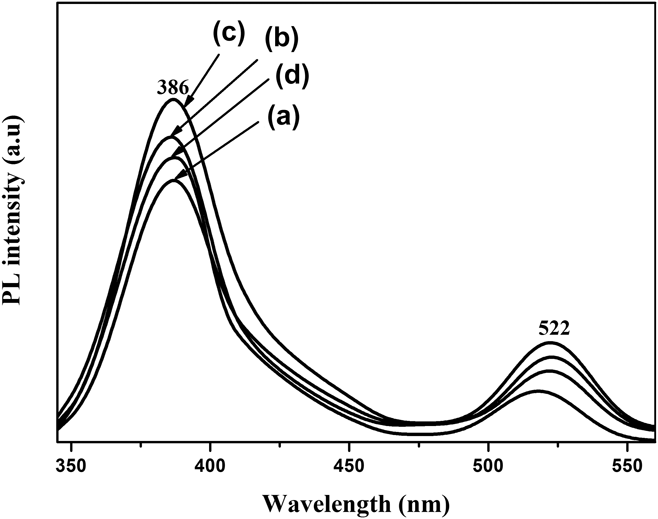
PL is a nondestructive technique that helps in probing electronic purity, energy state trajectory of an electron, and color center propensity of any material.Reference Ramteke, Anis, Baig and Muley46–Reference Shkir, Ganesh, AlFaify, Black, Dieguez and Maurya49 The PL study is mainly carried out to characterize film excellence, and also it is mainly dependent on the morphology shape and environment of the prepared solution. Usually, the ZnO PL spectrum exhibits one strong and several broad emission peaks corresponding to the UV and visible region, respectively.Reference Sagar, Shishodia, Mehra, Okada, Wakahara and Yoshida50 Figure 5 depicts the room-temperature PL spectrum of all films at λexc = 325 nm. From the figure, it is clear that the PL emission starts approximately at 345 nm. The PL spectra contain two peaks at 386 and 522 nm, which correspond to the UV and green emissions peaks. The PL emission peak intensities mainly depend on the potential voltages. The healthy UV emission was observed at 386 nm, which is related to the NBE emission of the bulk ZnO material;Reference Ma, Ma, Chen, Ai and Huang51 also this UV emission peak exposes the films’ crystalline quality. The NBE PL peak for sample C has the largest UV emission compared to the other samples A, B, and D. Therefore, the UV emission peak of sample C indicates a better crystalline nature than that of others, and it agrees with our XRD spectrum. In addition, the intensities of observed PL peaks initially increased and then reduced with increasing potential voltages due to an increase in film crystallinity. The observed UV peak corresponds to the recombination of the free electron–exciton collision procedure.Reference Long, English and Mooney52,Reference Lyu, Zhang, Ruh, Lee, Shim, Suh and Lee53 The broad green emission was detected at 522 nm (2.38 eV), which might be attributed to the transition of electrons from single ionized oxygen vacancies to the valence band.Reference Kumar, Valanarasu, Kathalingam, Ganesh, Shkir and AlFaify14,Reference Mariappan, Ragavendar and Ponnuswamy54 In this study, the observed UV emission peak (386 nm) well agrees with that of a previous report for AZO.Reference Mahroug, Boudjadar, Hamrit and Guerbous55 When compared with other AZO films, sample D exhibited a lower green emission at 522 nm because of the Zn interstitial defects.
PL spectra of AZO thin films at potential voltages of (a) −1.7 V, (b) −1.9 V, (c) −2.1 V, and (d) −2.3 V.

F. Electrical studies
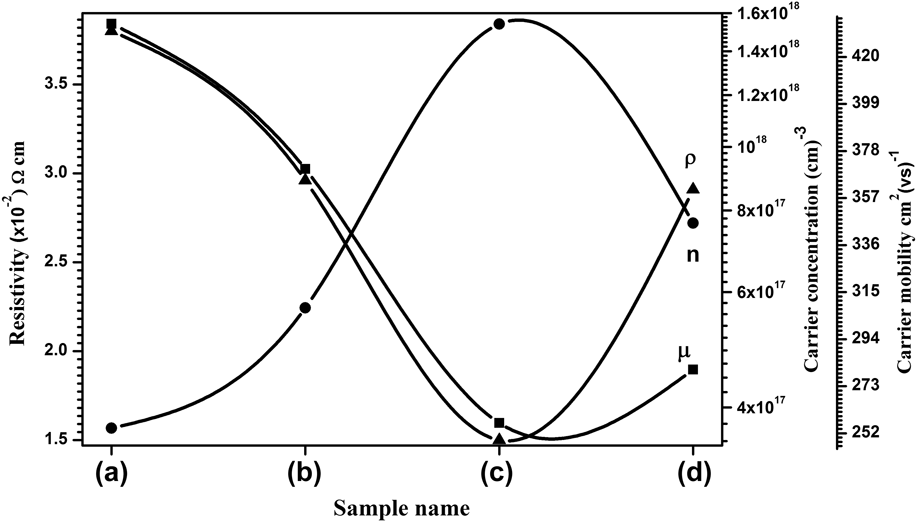
Studying the electrical properties is most important for any TCO material. Herein, electrical properties such as resistivity, electron mobility, and carrier concentration of electrodeposited films were studied using the room temperature ECOPIA Hall effect measurement system. Typically, the aluminum-doped ZnO thin film has higher electrical conductivity, while the Al3+ elements included into the Zn2+ sites so more active electrons were created into the ZnO crystal lattice.Reference Kumar, Valanarasu, Ganesh, Shkir, Kathalingam and AlFaify56 Moreover, the used FTO electrode substrate already has a good conducting nature. So, it can help to improve the conductivity of the electrodeposited AZO thin film. The variations of resistivity (ρ), electron mobility (μ), and carrier concentration (n) of AZO thin films are depicted in Fig. 6 and observed values are tabulated in Table III. Figure 6 and Table III show the decrease in electrical resistivity values with the increase in potential voltage up to −2.1 V. This is attributed to the increasing carrier concentration caused by the reduction of grain boundary scattering and crystal deficiencies.Reference Kumar, Ganesh, Shkir, AlFaify and Valanarasu12,Reference Kumar, Valanarasu, Jeyadheepan, Kim and Vikraman21 In fact, for TCO thin films, the carrier concentration increases with increasing film thickness by plasma resonance,Reference Bedia, Bedia, Maloufi, Aillerie, Genty and Benyoucef57 which agreed well with the UV results. However, the electrical resistivity value was increased for higher overpotential (−2.3 V) due to the reduction of carrier concentration. In addition, the observed Hall mobility values initially decreased and then increased with increasing potential voltages, which is attributed to the ionized impurity scattering mechanism as reported previously.Reference Kumar, Ganesh, Shkir, AlFaify and Valanarasu12,Reference Shen, Zhang, Lu, Jiang and Chao58 The obtained lower resistivity and higher carrier concentration values are 1.58 × 10⁻² (Ω cm) and 1.54 × 1018 cm−3, respectively, for sample C (−2.1 V). We conclude from the Hall effect study, sample C has high crystallinity and electrical conductivity; it is recommended that the potential −2.1 V is the best for electrodepositing AZO thin films.
Variations of electrical resistivity, carrier concentration, and mobility of AZO thin films at potential voltages of (a) −1.7 V, (b) −1.9 V, (c) −2.1 V, and (d) −2.3 V.

Electrical parameters of AZO thin films with different potential voltages.

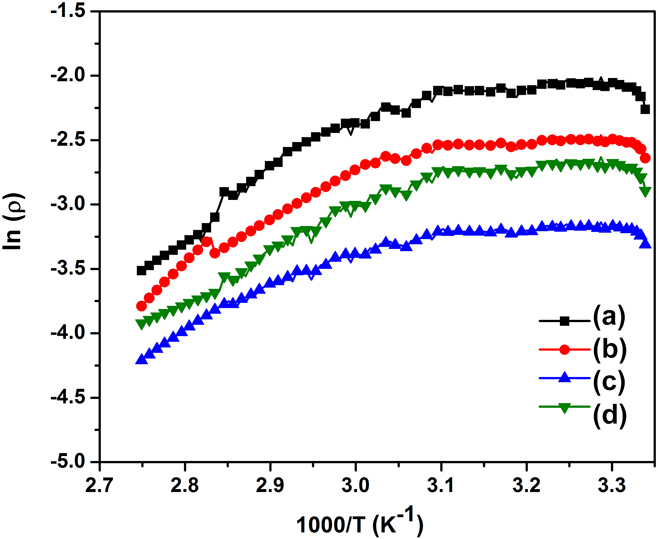
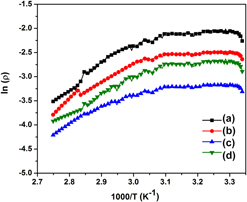
The variation of resistivity ln(ρ) with various temperatures K−1 for electrodeposited AZO films is shown in Fig. 7. From the figure, it can be observed that the resistivity variation shows a nonlinear behavior, which confirmed the semiconducting nature of the metal oxide. The ln(ρ) value decreases with increasing temperature, which is due to the activation energy. The observed resistivity value of ln(ρ) is similar to the room temperature Hall effect resistivity value for sample C (Fig. 7). Activation energy (E a) values were calculated from the ln(ρ) V s/K plot by using the following equationReference Anand, Sakthivelu, Kumar, Valanarasu, Kathalingam, Ganesh, Shkir, AlFaify and Yahia59:
 $$\rho = {\rho _0}\exp \left( {{{{E_{\rm{a}}}} \over {KT}}} \right)\quad ,$$
where k, ρ0, and T represent the Boltzmann constant, exponential parameter, and Kelvin temperature. The calculated activation energy values are 0.16, 0.11, 0.06, and 0.12 eV corresponding to samples A, B, C, and D, respectively. Activation energy initially decreases and then increases with the increasing potential voltages due to the change in oxygen deficiency.Reference Yakuphanoglu60
Plot of ln(ρ) versus 1000/T for AZO thin films at potential voltages of (a) −1.7 V, (b) −1.9 V, (c) −2.1 V, and (d) −2.3 V.

G. Figure of merit study
Optoelectrical superiority of the electrodeposited AZO films can be estimated using the figure of merit (ϕ) relation. This was determined from electrical sheet resistance and optical transmittance by the Haacke formulaReference Haacke61:
 $$\left( \phi \right){\rm{\ }} = {{{T^{10}}} \over {{R_{{\rm{sh}}}}}}\quad ,$$
where R sh and T represent the sheet resistance and transmittance at 650 nm, respectively. Typically, any transparent conducting zinc oxide thin film should have high optical transmittance and electrical conductivity for optoelectronic devices. The calculated ϕ values are presented in Table III. The obtained best value of ϕ is 1.80 × 10⁻³ (Ω/sq)−1 for the applied potential voltage at −2.1 V (sample C). In this work, the observed transmittance and conductivity values are high. Therefore, the prepared AZO thin film can be used for optoelectronic applications.
In this work, we observed a minimum resistivity and good transparency for AZO thin films using the electrochemical deposition (ED) method. The observed optical and electrical results are better in comparison with other reported values for AZO thin filmsReference Chen, Chen, Chen, Zhou, Li, Ren and Hu17,Reference Aragonès, Palacios-Padrós, Caballero-Briones and Sanz62–Reference Wellings, Samantilleke, Warren, Heavens and Dharmadasa64 via the electrochemical method. Therefore, this low-cost ED is a useful method for preparing device-quality AZO films.
IV. CONCLUSIONS
In the present work, the electrodeposited AZO thin films’ structural, morphological, and electro-optic properties were characterized at different potential voltages. The main conclusions for the present study are as follows:
(1) As from the structure study, the doped aluminum elements might be successfully dispersed into the ZnO crystal structure since there is no detected aluminum-related peak in the XRD spectrum.
(2) SEM images showed that the particles are uniformly distributed without any pinholes for the AZO film surface.
(3) From optoelectronic studies of the films, we observed a maximum transmittance of ∼80% and a minimum resistivity of ∼1.58 × 10⁻² Ω cm.
(4) The obtained best figure of merit (ϕ) value is 1.80 × 10⁻³ (Ω/sq)−1 for the potential voltage −2.1 V used for the AZO thin film.
(5) The above electro-optic properties of the electrodeposited AZO films indicate their suitability as electrode metal oxide for the fabrication of optoelectronic devices.
ACKNOWLEDGMENTS
The authors wish to express their sincere thanks to the Department of Science and Technology, New Delhi, India, for their financial assistance for the work by the project number SB/FTP/PS-131/2013. Mohd. Shkir, V. Ganesh, and S. AlFaify extend their appreciation to the Deanship of Scientific Research at King Khalid University for funding this work through Research Groups Program under Grant No. R.G.P. 2/10/39.