





Introduction
The Adélie penguin (Pygoscelis adeliae) is one of the most abundant penguin species, with ~3.8 million pairs breeding at ~250 colonies spread around the Antarctic continent and some offshore islands (Woehler 1993, Lynch & LaRue Reference Lynch and LaRue2014, Ainley & Wilson Reference Ainley and Wilson2023: ch 1). The key to the species’ extensive distribution and large global population size may be its relative ecological plasticity, which is needed to take advantage of environmental variability within its range. The respective ecological strategies of the Adélie penguin and the emperor penguin (Aptenodytes forsteri) are greatly affected by the presence of sea ice, a habitat association that might suggest little in the way of ecological flexibility. However, Antarctic sea ice is dynamic, with varying conditions across multiple temporal and spatial scales (cf. Stammerjohn et al. Reference Stammerjohn, Massom, Rind and Martinson2012, Arrigo et al. Reference Arrigo, Van Dijken and Strong2015, Parkinson Reference Parkinson2019), therefore requiring an ecologically plastic response. The Adélie penguin is much more plastic in its relationship to sea ice than is the emperor penguin (Ainley & Wilson Reference Ainley and Wilson2023, Ainley et al. Reference Ainley, Morandini, Ballard, Fraser, Convey, Anderson and Ross2026). Otherwise, in waters mostly overlying the Antarctic continental shelf and slope, the Adélie penguin exploits pack-ice habitat horizontally, frequenting surface waters, while the emperor penguin does so vertically, with typical diving depths being 40–60 vs 200–300 m, respectively (summarized in Ainley & Wilson Reference Ainley and Wilson2023: table A3). Abundant in this habitat is the energy-dense Antarctic silverfish (Pleuragramma antarcticum), a key prey for upper-trophic-level predators, from fish to seabirds (including penguins) to marine mammals (DeWhitt Reference DeWitt and Holdgate1970, Eastman Reference Eastman1985, La Mesa & Eastman Reference La Mesa and Eastman2012, Pinkerton Reference Pinkerton, Vacchi, Pisano and Ghigliotti2017). Euphausiids are also heavily consumed by Adélie penguins, as are other fish such as myctophids (Ainley & Wilson Reference Ainley and Wilson2023: table A2.6).
General summary of the Adélie penguin diet
The Adélie penguin is probably the most researched seabird on the planet, with hundreds of studies conducted over decades spanning the species’ entire range (Ainley Reference Ainley2002, Ainley & Wilson Reference Ainley and Wilson2023). Its foraging behaviour and diet are particularly well studied, mainly during the chick-raising period, with more than 40 studies at more than 20 breeding locations, as well as three studies in oceanic wintering habitat. Stable isotope analysis (SIA), evaluation of stomach contents or both have been employed to understand the species’ diet composition (summarized in Ainley & Wilson Reference Ainley and Wilson2023: ch. 4, table A2; also, more recently: Gallagher et al. Reference Gallagher, Dinniman and Lynch2023, Silvestro & Casaux Reference Silvestro and Casaux2023, Panasiuk et al. Reference Panasiuk, Gic-Grusza and Korczak-Abshire2024). Prehistoric diets also have been explored using SIA and DNA analysis, especially in the Ross Sea and western Antarctic Peninsula (WAP; summarized in Ainley & Wilson Reference Ainley and Wilson2023: ch 13; also Reaves et al. Reference Reaves, Powers and Emslie2025, Wood et al. Reference Wood, Zhou, Cole, Coleman, Anderson and Lyver2025).
The research effort on this species has led to regional studies of diet at multiple colonies (e.g. Gorman et al. Reference Gorman, Ruck, Williams and Fraser2021, Hong et al. Reference Hong, Gal, Lee, Son, Jung and La2021), with the addition of a decadal time series of annual diet variation among penguins breeding in the Ross Sea (Ainley et al. Reference Ainley, Ballard, Barton, Karl, Rau and Ribic2003, Reference Ainley, Dugger, La Mesa, Ballard, Barton and Jennings2018; more results given later) and also in the central portion of the WAP (Saba et al. Reference Saba, Fraser, Saba, Iannuzzi, Coleman and Doney2014, Gorman et al. Reference Gorman, Ruck, Williams and Fraser2021). In general, the species’ diet is composed of various species of krill, fish and squid depending on foraging habitat characteristics (e.g. ocean depth and gradient, sea-ice cover (SIC)), but also important are intra- and interspecific competition, within and between colonies and with other penguins, marine mammals and fisheries (Ainley & Wilson Reference Ainley and Wilson2023: chs 5, 13). Annual changes in the proportions of prey species in the diets of breeding birds have been associated with measures of prey availability in the WAP (Fraser & Hofmann Reference Fraser and Hofmann2003, Gorman et al. Reference Gorman, Ruck, Williams and Fraser2021, Lohmann et al. Reference Lohmann, Morton, Schofield and Nowacek2023).
Variation in diet has also been associated with regional population trends (e.g. Gorman Reference Gorman2015, Wood et al. Reference Wood, Zhou, Cole, Coleman, Anderson and Lyver2025). In response to increasing wind and reliability of coastal polynyas that affect foraging effort, Adélie penguin populations throughout most of the Antarctic have been increasing since the early 2000s, although increases have slowed in most recent years (Jenouvrier et al. Reference Jenouvrier, Barbraud and Weimerskirch2005, Lyver et al. Reference Lyver, Barron, Barton, Ainley, Pollard and Gordon2014, Southwell & Emmerson Reference Southwell and Emmerson2019, Ainley et al. Reference Ainley, Morandini, Salas, Nur, Rotella and Barton2024). The exception is the central and north-western coast of the WAP (Scotia Sea coast), where the regional population has been decreasing sharply in contrast to the southern portion of the WAP (Bellingshausen Sea coast; Lynch et al. Reference Lynch, Naveen, Trathan and Fagan2012, Gorman et al. Reference Gorman, Ruck, Williams and Fraser2021; reviewed in Ainley & Wilson Reference Ainley and Wilson2023: ch 13). The results of food web research in WAP waters suggest that this population decline is related to annual SIC changes as well as increased precipitation (M. Cimino, Palmer Station LTER, personal communication 2026). However, the trend is not due to an overall reduction in the availability of krill (Antarctic krill ( Euphausia superba ), crystal krill ( Euphausia crystallorophias )), at least in summer (Sailley et al. Reference Sailley, Ducklow, Moeller, Fraser, Schofield and Steinberg2013, Steinberg et al. Reference Steinberg, Ruck, Gleiber, Garzio, Cope and Bernard2015). Rather, in response to varying SIC, the frequency of strong krill year classes (adult krill) has decreased, leading to lower abundances of smaller krill (Cimino et al. Reference Cimino, Fraser, Patterson-Fraser, Saba and Oliver2014, Reference Cimino, Conroy, Connors, Bowman, Corso and Ducklow2023, Lohmann et al. Reference Lohmann, Morton, Schofield and Nowacek2023) and the near disappearance of energy-dense silverfish (La Mesa et al. Reference La Mesa, Riginella, Mazzoldi and Ashford2015, Corso et al. Reference Corso, Steinberg, Stammerjohn and Hilton2022). The diet of Adélie penguins in the northern WAP, where populations are decreasing, contains very little fish (e.g. Silvestro & Casaux Reference Silvestro and Casaux2023), in contrast to where penguin numbers have been stable or are increasing (Pickett et al. Reference Pickett, Fraser, Patterson-Fraser, Cimino, Torres and Friedlaender2018, Gorman et al. Reference Gorman, Ruck, Williams and Fraser2021). In the Bellingshausen Sea segment of the WAP, sea ice and silverfish (also myctophids) remain abundant (La Mesa et al. Reference La Mesa, Riginella, Mazzoldi and Ashford2015). Without enough fish in the chick diet to compensate for fewer years of smaller (younger) krill, chick fledge weights are lower, leading to lower survival (Salihoglu et al. Reference Salihoglu, Fraser and Hofmann2001, Chapman et al. 2011). Small Antarctic krill can sustain the breeding effort in those years when their abundance is higher than the larger-sized adult age class (Cimino et al. Reference Cimino, Fraser, Patterson-Fraser, Saba and Oliver2014). As pointed out in these studies, the shorter trips involved when small krill (but not fish) are available can compensate for reduced adult krill numbers by increasing chick feeding frequency.
Diet of Ross Island breeders
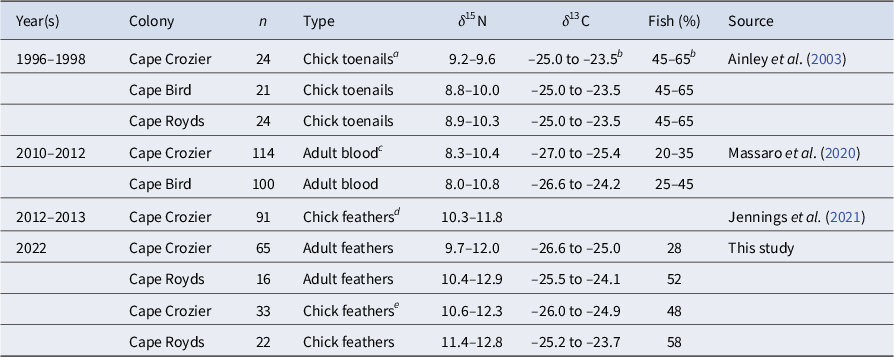
On Ross Island (and nearby Beaufort Island) in the Ross Sea, the diets of Adélie penguins have been well-investigated (Table I; Emison Reference Emison and Austin1968, Ainley et al. Reference Ainley, Ballard, Barton, Karl, Rau and Ribic2003, Reference Ainley, Ballard and Dugger2006, Reference Ainley, Ballard, Jones, Jongsomjit, Pierce and Smith2015, Reference Ainley, Dugger, La Mesa, Ballard, Barton and Jennings2018). In all four colonies of this cluster, breeding penguins switch from feeding primarily on crystal krill in the early chick growth period (~100%) to a diet containing more Antarctic silverfish later in the season (40–80% fish; Ainley et al. Reference Ainley, Jacobs, Ribic and Gaffney1998, Reference Ainley, Ballard, Barton, Karl, Rau and Ribic2003, 2006; see also Jennings et al. Reference Jennings, Dugger, Ballard and Ainley2021, Reference Jennings, Dugger, Ballard and Ainley2023). The switch to more silverfish is closely related to the arrival of competing whales (Ainley et al. Reference Ainley, Ballard and Dugger2006), especially Antarctic minke whales ( Balaenoptera bonaerensis ), which also feed heavily on crystal krill (predator diets compared in Ballard et al. Reference Ballard, Jongsomjit, Veloz and Ainley2012). The seasonal departure of competing, fish-eating Weddell seals ( Leptonychotes weddellii ) and emperor penguins (Saenz et al. Reference Saenz, Ainley, Daly, Ballard, Conlisk and Elrod2020; see later) is also a factor associated with the switch to fish by penguins. It might also be a strategy of parents, in that feeding their chicks fish increases their growth rate, which leads to the increased probability of successful fledging (Jennings et al. Reference Jennings, Varsani, Dugger, Ballard and Ainley2016, Reference Jennings, Dugger, Ballard and Ainley2021, Reference Jennings, Dugger, Ballard and Ainley2023).
A comparison of the stable isotope analyses of nitrogen and carbon conducted using penguin tissues at the three Ross Island Adélie penguin colonies during the past 3 decades to determine the diets of both adults (feeding chicks) and chicks.

Table I. Long description
The table contains 8 columns: Year(s), Colony, n (sample size), Type (tissue), delta 15 N, delta 13 C, Fish (percentage), and Source.
* 1996 to 1998: Data for Cape Crozier (n=24), Cape Bird (n=21), and Cape Royds (n=24) using chick toenails. delta 15 N ranges from 8.8 to 10.3. delta 13 C is -25.0 to -23.5 and Fish percentage is 45 to 65 for all three colonies. Source: Ainley et al. (2003).
* 2010 to 2012: Cape Crozier (n=114) and Cape Bird (n=100) using adult blood. delta 15 N ranges from 8.0 to 10.8. delta 13 C ranges from -27.0 to -24.2. Fish percentage is 20 to 35 for Crozier and 25 to 45 for Bird. Source: Massaro et al. (2020).
* 2012 to 2013: Cape Crozier (n=91) using chick feathers. delta 15 N is 10.3 to 11.8. Source: Jennings et al. (2021).
* 2022: Data from ‘This study’ for Cape Crozier and Cape Royds.
- Adult feathers: Crozier (n=65, delta 15 N 9.7 to 12.0, delta 13 C -26.6 to -25.0, 28 percent fish); Royds (n=16, delta 15 N 10.4 to 12.9, delta 13 C -25.5 to -24.1, 52 percent fish).
- Chick feathers: Crozier (n=33, delta 15 N 10.6 to 12.3, delta 13 C -26.0 to -24.9, 48 percent fish); Royds (n=22, delta 15 N 11.4 to 12.8, delta 13 C -25.2 to -23.7, 58 percent fish).
aThese are the outer two-thirds of nails, thus representing diet during the early to middle chick growth period. bAverage for the three colonies combined, based on stomach flushing. cAdults feeding chicks through the entire chick growth period. dChicks in at least their second set of feathers (not down). eFeathers in the late-stage chick period (i.e. juvenal plumage).
Fish occur in a higher proportion of the diets of chicks late in the rearing season at Cape Royds (smallest colony of the cluster) than at Cape Crozier (largest colony of the cluster; Table I; Ainley et al. Reference Ainley, Ballard, Barton, Karl, Rau and Ribic2003, Reference Ainley, Dugger, La Mesa, Ballard, Barton and Jennings2018). At Cape Crozier, the intensive central-place foraging decreases prey availability increasingly far from the colony as the breeding season progresses (e.g. Ainley et al. Reference Ainley, Ballard, Jones, Jongsomjit, Pierce and Smith2015, Ford et al. Reference Ford, Ainley, Lescroël, Lyver, Toniolo and Ballard2015). At Cape Royds (the much smaller colony), any prey depletion in the smaller foraging area is related to inter- instead of intraspecific competition (see earlier). Prey is abundant enough there that a large number of post-breeding adults forage locally and stay to moult (Taylor Reference Taylor1962; and unpublished data from a remotely operated camera in place since 2009). In contrast, after foraging to raise chicks, adults from Cape Crozier, having depleted prey near the colony, become energetically compromised (Ballance et al. Reference Ballance, Ainley, Ballard and Barton2009, Ballard et al. Reference Ballard, Toniolo, Ainley, Parkinson, Arrigo and Trathan2010b; see also Chappell et al. Reference Chappell, Janes, Shoemaker, Bucher and Maloney1993, Machado-Gaye et al. Reference Machado-Gaye, Chimienti, Kato, Ropert-Coudert, Barbosa and Bustamante2025 for mass loss during breeding). Therefore, they disperse after breeding to fatten and moult in the highly productive continental slope of the north-eastern Ross Sea or western Amundsen Sea, a few hundred-kilometre journey north-eastwards from Cape Crozier (Fig. 1; Ainley et al. Reference Ainley, O’Connor and Boekelheide1984, Reference Ainley, Jacobs, Ribic and Gaffney1998, Reference Ainley, Ballard and Weller2010, Ballard et al. Reference Ballard, Dugger, Nur and Ainley2010a, Schmidt et al. Reference Schmidt, Lescroël, Lisovski, Elrod, Jongsomjit and Dugger2023). There, perennial pack ice exists in a belt extending eastwards across the Amundsen and southern Bellingshausen seas to the southern WAP (see Gloersen et al. Reference Gloersen, Campbell, Cavalieri, Comiso, Parkinson and Zwally1992, Stammerjohn et al. Reference Stammerjohn, Massom, Rind and Martinson2012). The marginal ice zone of this area adds to the productivity of the Shelf Break Front (Ainley & Jacobs Reference Ainley and Jacobs1981, Ackley et al. Reference Ackley, Bengtson, Boveng, Castellini, Daly and Jacobs2003, Ribic et al. Reference Ribic, Ainley, Ford, Fraser, Tynan and Woehler2011). Among those Cape Royds birds that do not moult at Cape Royds, 41% moult along northern Victoria Land (Schmidt et al. Reference Schmidt, Lescroël, Lisovski, Elrod, Jongsomjit and Dugger2023).
Use of the Ross Sea region by Adélie penguins. Shown is the location of the Cape Crozier colony (large red star), as well as other Adélie penguin colonies in the Ross Sea (red circles; Cape Royds is indicated by the small, southernmost red star on the west side of Ross Island), as well as the area of persistent pack ice in the eastern Ross Sea/Amundsen Sea where a large number of Adélie (and emperor) penguins moult (as labelled); they also moult at locations along the Victoria Land coast. The figure is derived from a MaxEnt (maximum entropy) model based on systematic surveys from research vessels during 1976–1994 (tracks shown as black lines; Adélie penguin sightings indicated by orange circles); the intensity of blue shading indicates relative penguin abundance. The model was built using a number of biophysical properties recorded along the tracks (the shelf break is shown as a light-yellow wavering line; the lower extent of the slope is shown by a white wavering line), with the figure reconstructed from Ainley et al. (Reference Ainley, Ballard and Weller2010) and Ballard et al. (Reference Ballard, Jongsomjit, Veloz and Ainley2012). The intense blue of the western Ross Sea indicates high concentrations of penguins during summer, a result of combining their respective colony foraging areas.

Figure 1 Long description
A geographical map of the Ross Sea region with a coordinate grid ranging from 170 degrees East to 150 degrees West and 70 degrees South to 75 degrees South.
* Landmasses: The Victoria Land coast is on the West (left), and Ross Island is at the South-Southwest (bottom-left).
* Colony Markers: Red circles indicate penguin colonies along the Victoria Land coast. A large red star marks Cape Crozier on the eastern tip of Ross Island, and a small red star marks Cape Royds on the western side of Ross Island.
* Abundance Data: A color gradient indicates relative abundance from Low 0.0 (yellow-green) to High 0.94 (dark blue). The highest concentrations are in the western Ross Sea near the colonies and in the Eastern Moult Area.
* Survey Tracks: Black lines crisscross the sea representing research vessel paths from 1976 to 1994. Orange circles along these lines indicate specific Adélie penguin sightings.
* Bathymetry: A light-yellow wavering line marks the shelf break, and a white wavering line indicates the lower extent of the slope.
* Labels: Coastal Moult Area is labeled along the western coast. Eastern Moult Area is labeled in the central-east region.
* Scale: A scale bar at the bottom center indicates distances up to 200 Kilometres.
The return rate of chicks to Ross Island colonies up through age 5 years (Ainley et al. Reference Ainley, Dugger, La Mesa, Ballard, Barton and Jennings2018) and on the northern WAP (Chapman et al. 2011) was positively related to their mass at fledging. Interestingly, as the large Cape Crozier colony (~9% of global population; Lynch & LaRue Reference Lynch and LaRue2014) doubled in size over the past few decades (Ainley et al. Reference Ainley, Morandini, Salas, Nur, Rotella and Barton2024), chick fledging mass declined (Dugger et al. Reference Dugger, Ballard, Ainley, Lyver and Schine2014). Low fledging mass at Cape Crozier was also associated with increasingly long parental foraging trips during late chick growth: a maximum of ~170 km in 2005 increasing to ~240 km by 2012 (cf. Ford et al. Reference Ford, Ainley, Lescroël, Lyver, Toniolo and Ballard2015, Ballard et al. Reference Ballard, Schmidt, Toniolo, Veloz, Jongsomjit and Arrigo2019). One result of longer trips was lower feeding frequency of chicks, which does affect chick growth rate (Chapman et al. 2011). These patterns are consistent with intraspecific competition for food and prey depletion within the large colony’s foraging area (e.g. Ainley et al. Reference Ainley, Ribic, Ballard, Heath, Gaffney and Karl2004). During most years between the years 2000 and 2016, Cape Crozier chicks fledged at low enough mass that survival should have been compromised (Ainley et al. Reference Ainley, Dugger, La Mesa, Ballard, Barton and Jennings2018).
Despite mass-compromised fledglings, the Cape Crozier colony continued to grow (Lyver et al. Reference Lyver, Barron, Barton, Ainley, Pollard and Gordon2014, Ainley et al. Reference Ainley, Morandini, Salas, Nur, Rotella and Barton2024). To explain this contradiction, we hypothesized that, once free of the colony foraging area, there must be sufficient high-quality prey to compensate for low body mass and condition. A high-quality diet would include a notable level of fish - a level consistent with the diet in ice-covered waters of the southern WAP, where populations are stable or increasing (see Gorman et al. Reference Gorman, Ruck, Williams and Fraser2021). Also available along the Ross/Ammundsen seas shelf break would be Antarctic krill, which are energetically equivalent to crystal krill (Ainley & Wilson Reference Ainley and Wilson2023: table A3) but occur in larger, denser swarms, making them a superior foraging target. Besides prey available for fledglings, which must learn by themselves to forage, energetically compromised parents also must find high-quality food once free of depleted central-place foraging. They need to recover condition and prepare for moult (Lescroël et al. Reference Lescroël, Schmidt, Ainley, Dugger, Elrod and Jongsomjit2023), a time-constrained activity given the shortening days at these high latitudes.
Study objective and hypotheses
Our goal was direct confirmation that post-breeding adults take advantage of fish available outside the breeding season foraging area. This we proposed to accomplish in the context of having in the past used ocean gliders and remotely operated vehicles to quantify preyscapes (i.e. assessment of the relative abundance of fish and krill) within the respective Cape Crozier and Cape Royds colony foraging areas; Ainley et al. Reference Ainley, Ballard, Jones, Jongsomjit, Pierce and Smith2015, Saenz et al. Reference Saenz, Ainley, Daly, Ballard, Conlisk and Elrod2020). Moreover, in the vicinity of the Shelf Break Front (overlying the continental slope; Fig. 1), previous trawl and acoustic surveys have indicated that prey, especially fish, should be ample for penguin needs (numerous trawls by DeWhitt 1970, trawls and acoustics by O’Driscoll et al. Reference O’Driscoll, Macauley, Gauthier, Pinkerton and Hanchet2011), including in the eastern moult area (more trawls; Ackley et al. Reference Ackley, Bengtson, Boveng, Castellini, Daly and Jacobs2003, Donnelly et al. Reference Donnelly, Torres, Sutton and Simoniello2004).
Previously, to document diet, particularly the importance of fish during the beginning of the non-breeding season, we used SIA of the contour feathers and toenails of adults; also previously, we analysed chick feathers that were grown to replace natal and then post-natal down, representing diet provided by parents from within colony foraging areas (Table I; Ainley et al. Reference Ainley, Ballard, Barton, Karl, Rau and Ribic2003, Reference Ainley, Ballard, Jones, Jongsomjit, Pierce and Smith2015, Reference Ainley, Dugger, La Mesa, Ballard, Barton and Jennings2018, Massaro et al. Reference Massaro, Ainley, Santora, Quillfeldt, Lescroël and Whitehead2020, Saenz et al. Reference Saenz, Ainley, Daly, Ballard, Conlisk and Elrod2020, Jennings et al. Reference Jennings, Dugger, Ballard and Ainley2021, Reference Jennings, Dugger, Ballard and Ainley2023). The adult feathers should represent the diet outside the colony foraging area just before the moult (Cherel et al. Reference Cherel, Hobson and Hassani2005, Silva et al. Reference Silva, Saporit, Vales, Tavares, Gandini and Crespo2014, Zaldúa et al. Reference Zaldúa, Zajková, Machado-Gaye, Franco-Trecu, Cosse and Ropert-Coudert2024). Previous results showed that the diets of adults during chick-rearing were composed of 20–45% fish depending on the colony (Massaro et al. Reference Massaro, Ainley, Santora, Quillfeldt, Lescroël and Whitehead2020), so we predicted similar proportions in the tissues of chicks from this study. In the present study, we predicted that fish would constitute at least ~20% of pre-moult adult diets, consistent with or greater than the levels of fish eaten by stable or increasing populations in the pack ice of the southern WAP (Table I; Gorman et al. Reference Gorman, Ruck, Williams and Fraser2021).
Methods
This study was conducted at Cape Crozier (77°27′S, 169°12′E) and Cape Royds (77°33′S, 166°10′E), Ross Island, Antarctica (Fig. 1), with feathers collected during the 2022–2023 summer (hereafter: 2022 breeding season). While handling birds for the attachment of data loggers, we obtained body contour feathers from adults and near-fledged chicks (not downy fluff) > 5 weeks in age. Chick feathers were grown late in the chick growth period (late January 2023), whereas adult feathers were grown post-breeding during February–March 2022 (after previous 2021–2022 breeding season). The adult feathers would have grown while foraging outside the colony foraging area.
Diet composition
During the first 4 years of what proved to be a long-term study (i.e. 1997–2022), we quantified the composition of meals fed to chicks by stomach flushing of parents at both study colonies (Ainley et al. Reference Ainley, Ballard, Barton, Karl, Rau and Ribic2003). Thereafter, we estimated diet composition by observing food regurgitated by parents into chicks’ mouths (Ainley et al. Reference Ainley, Dugger, La Mesa, Ballard, Barton and Jennings2018), having confirmed these findings by observation compared to flushing, and in some years with SIA results (Table I; Ainley et al. Reference Ainley, Ballard, Barton, Karl, Rau and Ribic2003, Massaro et al. Reference Massaro, Ainley, Santora, Quillfeldt, Lescroël and Whitehead2020).
Stable isotope analysis
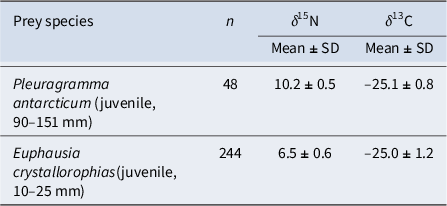
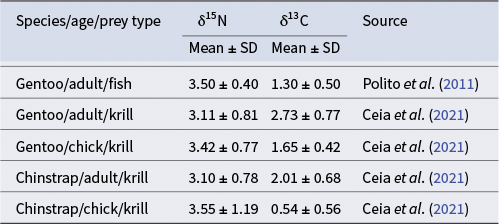
Feathers collected from adults and near-fledged chicks during the 2022 breeding season were processed by the Michael Polito Lab at Louisiana State University according to the methods described in Polito et al. (Reference Polito, Abel, Tobias and Emslie2011, Reference Polito, Trivelpiece, Patterson, Karnovsky, Reiss and Emslie2025). We used values of 13C and 15N from individual penguins and Bayesian mixing models in the program R (MixSIAR package, vs3.1.12, Stock et al. Reference Stock, Jackson, Ward, Parnell, Phillips and Semmens2018; R version 4.4.2, R Development Core Team 2024) to estimate mean proportions of fish and krill. Included were post-breeding adults (n = 84 at Cape Crozier, n = 19 at Cape Royds) and pre-fledged chicks (n = 48 at Cape Crozier, n = 24 at Cape Royds). The Bayesian mixing model formulation estimates source contributions (i.e. prey) while accounting for variability in both the source and the mixture stable isotope data (Moore & Semmens Reference Moore and Semmens2008). The MixSIAR package in R also allows for different error formulations as well as the direct investigation of both fixed and random effects. We used isotopic values of the two major prey species - juvenile Antarctic silverfish and adult crystal krill - from Pinkerton et al. (Reference Pinkerton, Forman, Bury, Brown, Horn and O’Driscoll2013) as our ‘source’ values in the mixing model (Table II). Isotopic discrimination rates for Adélie penguin feathers were not available, so we used published values from gentoo penguins ( Pygoscelis papua ; Polito et al. Reference Polito, Abel, Tobias and Emslie2011) and chinstrap penguins ( Pygoscelis antarctica ; Ceia et al. Reference Ceia, Cherel, Seco, Barbosa, Chipev and Xavier2021). Chinstrap penguins, being one of the most specialized foragers based on diet (Ainley & Wilson Reference Ainley and Wilson2023: ch 4, table A2), were believed to eat primarily krill. Therefore, we believed that the discrimination factor estimated for krill relative to a wild chinstrap penguin diet would be more accurate than a discrimination factor for krill relative to gentoo penguin diets that include more fish. In addition, differences in discrimination rates for prey items for Adélie penguin adults vs chicks have not been estimated but were found to be quite different for krill in both gentoo and chinstrap penguins (Table III; Ceia et al. Reference Ceia, Cherel, Seco, Barbosa, Chipev and Xavier2021). Thus, we estimated diet composition for chicks separately from adults and used estimates of discrimination values for krill from chinstrap penguin adults and chicks, respectively. Separate estimates of discrimination values for fish in adults vs chicks do not exist, so we used the same value for both age classes for fish from adult gentoo penguins (Polito et al. Reference Polito, Abel, Tobias and Emslie2011).
Source data: stable isotope means for prey species from Pinkerton et al. (Reference Pinkerton, Forman, Bury, Brown, Horn and O’Driscoll2013; penguin prey sizes confirmed in Emison Reference Emison and Austin1968, Ainley & Emison Reference Ainley and Emison1972, La Mesa & Eastman Reference La Mesa and Eastman2012).
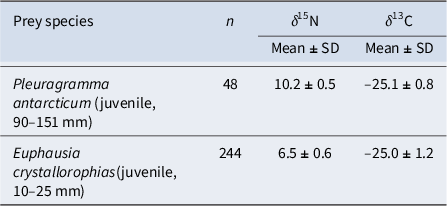
Table II. Long description
The table contains four columns: Prey species, n, delta super 15 N Mean plus or minus S D, and delta super 13 C Mean plus or minus S D.
Row 1: Pleuragramma antarcticum (juvenile, 90 to 151 mm). n is 48. delta super 15 N is 10.2 plus or minus 0.5. delta super 13 C is minus 25.1 plus or minus 0.8.
Row 2: Euphausia crystallorophias (juvenile, 10 to 25 mm). n is 244. delta super 15 N is 6.5 plus or minus 0.6. delta super 13 C is minus 25.0 plus or minus 1.2.
S D stands for standard deviation.
SD = standard deviation.
Source data: isotopic discrimination value for feathers.

Table III. Long description
The table contains four columns: Species/age/prey type, delta 15 N (Mean plus or minus S D), delta 13 C (Mean plus or minus S D), and Source.
* Gentoo/adult/fish: delta 15 N is 3.50 plus or minus 0.40; delta 13 C is 1.30 plus or minus 0.50; Source: Polito et al. 2013.
* Gentoo/adult/krill: delta 15 N is 3.11 plus or minus 0.81; delta 13 C is 2.73 plus or minus 0.77; Source: Ceia et al. 2021.
* Gentoo/chick/krill: delta 15 N is 3.42 plus or minus 0.77; delta 13 C is 1.65 plus or minus 0.42; Source: Ceia et al. 2021.
* Chinstrap/adult/krill: delta 15 N is 3.10 plus or minus 0.78; delta 13 C is 2.01 plus or minus 0.68; Source: Ceia et al. 2021.
* Chinstrap/chick/krill: delta 15 N is 3.55 plus or minus 1.19; delta 13 C is 0.54 plus or minus 0.56; Source: Ceia et al. 2021.
S D stands for standard deviation.
SD = standard deviation.
We evaluated three parameterizations of the Bayesian mixing model for both adults and chicks, including a model with 1) no colony effects (diet not different), 2) colony as a fixed effect and 3) colony as a random effect. We incorporated both process and residual error in variance estimates for all models following Stock & Semmens (2016a,b). We confirmed model convergence with the Gelman-Rubin and Geweke diagnostics and used the deviance information criterion (DIC), a generalization of the Akaike information criterion (AIC) for Bayesian model selection (Stock & Semmens Reference Stock and Semmens2016a,Reference Ainley, Ballard, Barton, Karl, Rau and Ribicb), to evaluate support for colony differences and identify the best estimates of diet composition.
Results
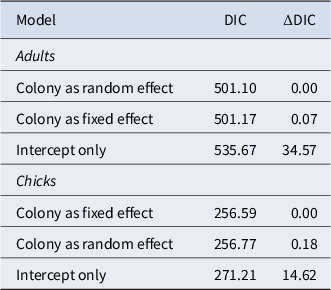
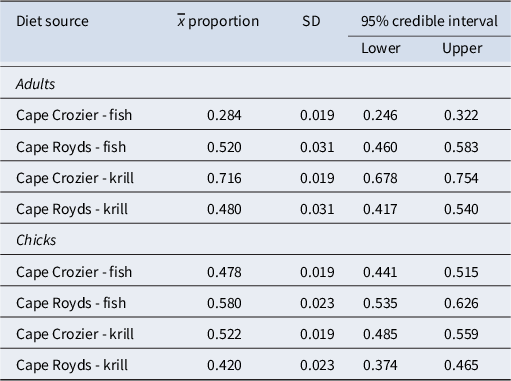
The stable isotope mixing models with ‘Colony’ either as a fixed or random effect were supported by DIC model selection over the no colony, intercept-only model for both chicks and adults (Table IV). These results indicated that diet composition varied between colonies, consistent with direct observations. Thus, we present estimates of proportions of fish and krill for both adults and chicks from models with ‘Colony’ as a fixed effect (cf. Table V; Ainley et al. Reference Ainley, Ballard, Barton, Karl, Rau and Ribic2003, Reference Ainley, Dugger, La Mesa, Ballard, Barton and Jennings2018).
Model selection results from the Bayesian mixing models used to estimate the diet composition for post-breeding Adélie penguin adults and pre-fledging chicks at Cape Crozier and Cape Royds on Ross Island, Antarctica, from feathers collected just prior to chick fledging during the 2022–2023 breeding season. The results include deviance information criteria (DIC) and the difference between model DIC and DIC from the highest-ranking model (ΔDIC).

Table IV. Long description
The table consists of three columns: Model, D I C, and Delta D I C. It is divided into two main sections.
Section 1: Adults
* Colony as random effect: D I C 501.10, Delta D I C 0.00.
* Colony as fixed effect: D I C 501.17, Delta D I C 0.07.
* Intercept only: D I C 535.67, Delta D I C 34.57.
Section 2: Chicks
* Colony as fixed effect: D I C 256.59, Delta D I C 0.00.
* Colony as random effect: D I C 256.77, Delta D I C 0.18.
* Intercept only: D I C 271.21, Delta D I C 14.62.
Diet composition (fish vs krill) for Adélie penguin adults and chicks at Cape Crozier and Cape Royds. Proportions of prey in the diet estimated from a Bayesian mixing model using stable isotope values estimated from adult feathers and chick feathers collected just prior to chick fledging during the 2022–2023 breeding season.

Table V. Long description
The table consists of five columns: Diet source, x-bar proportion, S D, and a 95% credible interval subdivided into Lower and Upper bounds.
Adults section:
* Cape Crozier - fish: 0.284 proportion, 0.019 S D, 0.246 to 0.322 interval.
* Cape Royds - fish: 0.520 proportion, 0.031 S D, 0.460 to 0.583 interval.
* Cape Crozier - krill: 0.716 proportion, 0.019 S D, 0.678 to 0.754 interval.
* Cape Royds - krill: 0.480 proportion, 0.031 S D, 0.417 to 0.540 interval.
Chicks section:
* Cape Crozier - fish: 0.478 proportion, 0.019 S D, 0.441 to 0.515 interval.
* Cape Royds - fish: 0.580 proportion, 0.023 S D, 0.535 to 0.626 interval.
* Cape Crozier - krill: 0.522 proportion, 0.019 S D, 0.485 to 0.559 interval.
* Cape Royds - krill: 0.420 proportion, 0.023 S D, 0.374 to 0.465 interval.
Footnote: S D equals standard deviation.
SD = standard deviation.
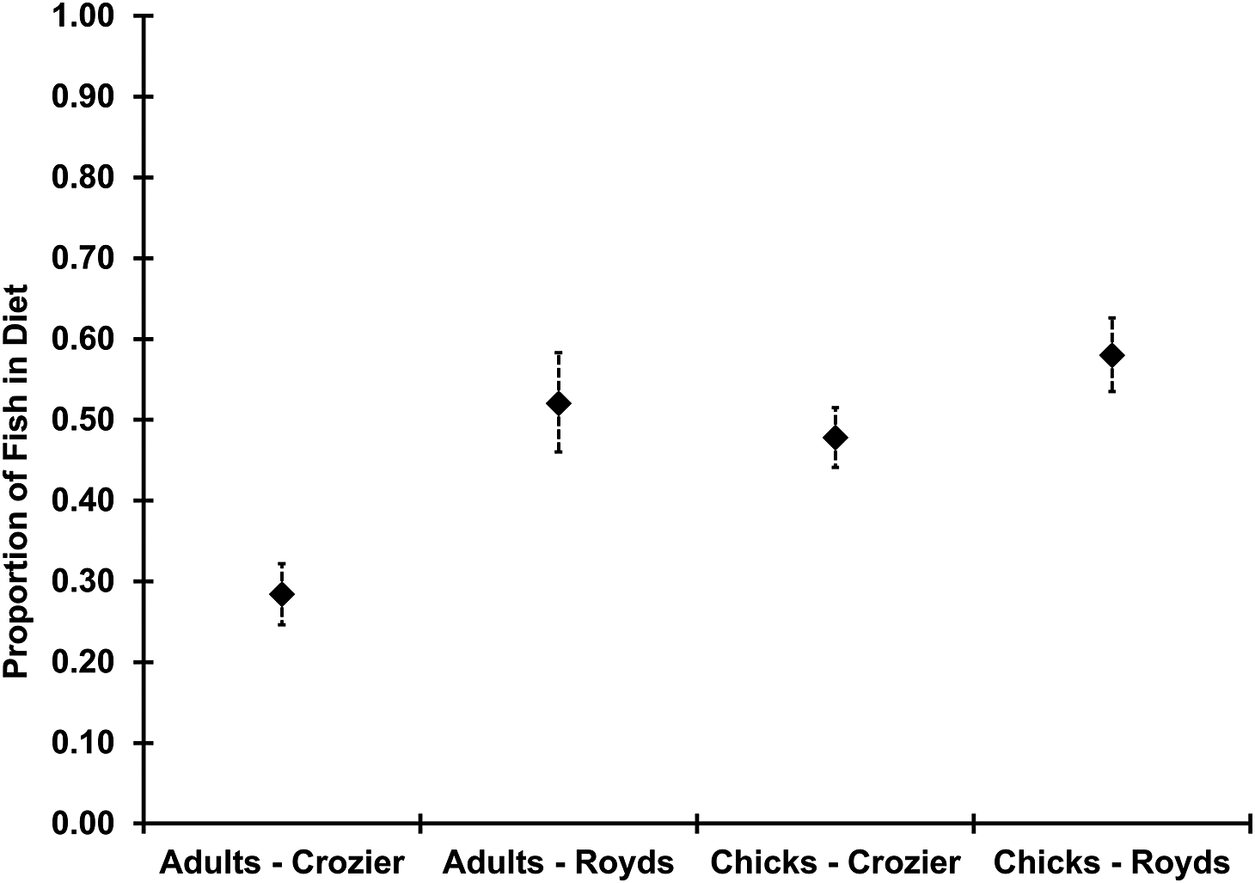
Towards the end of their growth period in the 2022 breeding season (late January 2023), chick diet composition included 48–58% fish at Cape Crozier and Cape Royds, respectively. Those levels were consistent with results from previous years, based on chick toenail/feather sampling as well as adult blood (Figs 2 & 3 & Tables I & V). Annual estimates from feeding observations showed that chick diets at Cape Crozier are always lower in the contribution of fish, although in some years not significantly (Ainley et al. Reference Ainley, Ballard, Barton, Karl, Rau and Ribic2003, Reference Ainley, Dugger, La Mesa, Ballard, Barton and Jennings2018); the same is true for the SIA (Table I).
Proportion (± 95% credible intervals) of fish in the diets of pre-fledging Adélie penguin chicks and pre-moulting adults based a Bayesian mixing model with colony fixed effects conducted using stable isotope data for each age class (see Fig. 3).

Figure 2 Long description
The Y-axis is labeled Proportion of Fish in Diet and ranges from 0.00 to 1.00 in increments of 0.10. The X-axis lists four categories from left to right.
* Adults minus Crozier has a diamond data point at approximately 0.28 with vertical error bars extending from 0.25 to 0.32.
* Adults minus Royds has a diamond data point at approximately 0.52 with vertical error bars extending from 0.46 to 0.58.
* Chicks minus Crozier has a diamond data point at approximately 0.48 with vertical error bars extending from 0.44 to 0.52.
* Chicks minus Royds has a diamond data point at approximately 0.58 with vertical error bars extending from 0.54 to 0.63.
All data points are represented by black diamonds with dashed vertical lines indicating credible intervals.
Isospace plots from the contour feathers of near-fledged Adélie penguin chicks and adults collected in late January 2023 at Cape Crozier and Cape Royds.

Figure 3 Long description
A two-panel scatter plot. The x-axis represents delta super 13 C in parts per thousand ranging from -26 to -21. The y-axis represents delta super 15 N in parts per thousand ranging from 9 to 15.
Left Panel: Penguin Chicks.
* Data points for Crozier (orange) and Royds (blue) are clustered between -26 and -24 on the x-axis and 10.5 to 12.5 on the y-axis.
* A reference point for Fish is located at approximately (-23.8, 13.7) with solid error bars.
* A reference point for Krill is located at approximately (-22.9, 9.6) with dashed error bars.
Right Panel: Penguin Adults.
* Crozier data points (orange) are concentrated between -26 and -24.5 on the x-axis and 9.5 to 12 on the y-axis.
* Royds data points (blue) are more dispersed, with a distinct group higher on the y-axis between 12 and 13.
* The Fish and Krill reference points remain in the same positions as the left panel.
In both panels, the penguin data points generally sit between the isotopic signatures of Krill and Fish, indicating a mixed diet.
The year 2022–2023 was the only one in which we also analysed adult feathers (grown after the 2021–2022 breeding season). The results indicated that post-breeding adults consumed krill but also a notable percentage of fish (28% for Cape Crozier birds; 52% for Cape Royds birds; Tables I & V). Similarly to late-season chicks, Cape Royds adults consumed more fish than Cape Crozier adults, confirming that pre-moult foraging area differed by colony (Ballard et al. Reference Ballard, Toniolo, Ainley, Parkinson, Arrigo and Trathan2010b, Schmidt et al. Reference Schmidt, Lescroël, Lisovski, Elrod, Jongsomjit and Dugger2023, Jongsomjit et al. Reference Jongsomjit, Lescroel, Schmidt, Lisovski, Ainley and Hines2024). This was also supported to some degree by differences in δ13C (see later).
Discussion
In addition to feeding high-energy-density fish to chicks late in the rearing season, our SIA results also indicate that Cape Crozier adults are obtaining fish outside the colony foraging area after departing the colony for the year. Such a diet aids them in their recovery of condition lost during breeding, as well as in preparing for moult (Chappell et al. Reference Chappell, Janes, Shoemaker, Bucher and Maloney1993, Machado-Gaye et al. Reference Machado-Gaye, Chimienti, Kato, Ropert-Coudert, Barbosa and Bustamante2025). Fish facilitate this recovery owing to their high energy density (e.g. myctophid fish: 7.9–9.0 kJ g−1 wet mass (WM) and juvenile silverfish: 5.0–5.2 kJ g−1 WM, in contrast to crystal krill: 4.6–5.1 kJ g−1 WM and Antarctic krill: 3.8–4.8 kJ g−1 WM; Ainley & Wilson Reference Ainley and Wilson2023: table A4). Obtaining fish, especially myctophids as well as Antarctic krill, with frequent, relatively shallow diving (Lescroël et al. Reference Lescroël, Schmidt, Ainley, Dugger, Elrod and Jongsomjit2023) is consistent with foraging in the shade of sea ice. At a latitude in late February–early March when it would be dark for part of the 24 h daily cycle, micronekton would also be at or near the surface (Ainley et al. Reference Ainley, Smith, Sullivan, Torres and Hopkins1986, Reference Ainley, Fraser, Daly and Sahrhage1988, Reference Ainley, Ribic and Fraser1992). Moreover, in the penguin moult area of the north-eastern Ross/Amundsen seas (Fig. 1), fish are abundant, as judged from being found in every mid-water trawl conducted there (oblique, 0–500 m; Ackley et al. Reference Ackley, Bengtson, Boveng, Castellini, Daly and Jacobs2003, Donnelly et al. Reference Donnelly, Torres, Sutton and Simoniello2004). Crystral krill abound over the shelf and Antarctic krill over the slope in the eastern moult area (Ackley et al. Reference Ackley, Bengtson, Boveng, Castellini, Daly and Jacobs2003). That pattern is consistent with sampling in the western Ross Sea slope as well, although earlier in the spring–summer (November–January; Davis et al. Reference Davis, Hofmann, Klinck, Piñones and Dinniman2017).
Eating energy-dense fish and the larger krill species through shallow diving should enhance Adélie penguin foraging efficiency (energy gained relative to energy expended). Doing so would contribute to the quick accumulation of fat necessary to recover body condition and sustain the moult fast (Chappell et al. Reference Chappell, Janes, Shoemaker, Bucher and Maloney1993, Machado-Gaye et al. Reference Machado-Gaye, Chimienti, Kato, Ropert-Coudert, Barbosa and Bustamante2025). Moreover, the fish species eaten in the Shelf Break Front would be slow-moving notothenioids and especially myctophids that require little effort for a predator to approach and grasp (e.g. Fuiman et al. Reference Fuiman, Davis and Williams2002; see also Eastman Reference Eastman2024). Myctophids are the prey of choice of surface-foraging seabirds in the continental slope waters of the Ross Sea (Ainley et al. Reference Ainley, O’Connor and Boekelheide1984), as well as in the marginal ice zone, away from the shelf, as investigated in the Weddell Sea (Ainley et al. Reference Ainley, Smith, Sullivan, Torres and Hopkins1986, 1992). The slope of the north-eastern Ross Sea is a trophic ‘hotspot’ supporting immense numbers of petrels, penguins and whales (Ainley et al. Reference Ainley, O’Connor and Boekelheide1984, Reference Ainley, Jacobs, Ribic and Gaffney1998, Reference Ainley, Ballard and Weller2010, Ribic et al. Reference Ribic, Ainley, Ford, Fraser, Tynan and Woehler2011). This region, with its multi-year pack ice, is also the pre-moult foraging and moult area for 25% of the world’s emperor penguins (Kooyman et al. Reference Kooyman, Siniff, Stirling and Bengtson2004; to be discussed in more detail later).
Additionally, the proportion of individual fish in the diet is probably higher than what we have observed with SIA because the fish are also eating krill. It is important to note that SIA (as well as DNA analysis of faeces; e.g. Jarman et al. Reference Jarman, McInnes, Faux, Polanowski, Marthick and Deagle2013) also reveals the prey of a species’ prey (i.e. in the stomachs of the prey). This is important to consider, especially for the southern Ross Sea, which is essentially a two-prey system for the Adélie penguin (mostly silverfish and crystal krill). With the take of silverfish also containing much crystal krill, the contribution of zooplankton (as secondary prey; La Mesa & Eastman Reference La Mesa and Eastman2012, Pinkerton et al. Reference Pinkerton, Forman, Bury, Brown, Horn and O’Driscoll2013) would be amplified in the mixing model. In other words, once fish begin to digest, krill are freed from the fish stomach, adding directly to penguin stomach contents, and both are incorporated into penguin tissues. If the fish had been feeding on other fish, then the δ15N signature would be higher than if the fish are feeding at a lower trophic level (i.e. krill).
While we cannot control for interannual variation in prey availability in this single-year study, we assumed that it is not likely that the preyscape in the adult pre-moult foraging area, in the north-east Ross Sea (during the 2021–2022 summer), differed substantially from previous or subsequent years. We base this assumption on the general constancy of abundant penguin presence as observed during several cruises in the 1970s–1990s (Ainley et al. Reference Ainley, O’Connor and Boekelheide1984, Reference Ainley, Jacobs, Ribic and Gaffney1998) and again most recently in February 2023 (G. Macdonald, Moss Landing Marine Lab, personal communication 2025; Fig. 1). These waters are consistently covered by sea ice year-round (Gloersen et al. Reference Gloersen, Campbell, Cavalieri, Comiso, Parkinson and Zwally1992, Stammerjohn et al. Reference Stammerjohn, Massom, Rind and Martinson2012, Maksym & Stammerjohn Reference Maksym, Stammerjohn and Thomas2025). We also assumed that a notable portion of post-fledged juveniles were foraging in the same location as the adults, given that many Adélie penguins take a north-eastwards route when free of nesting constraints (Ainley & Wilson Reference Ainley and Wilson2023: ch. 14). Indeed, a notable proportion of Adélie penguins encountered in moult areas are in juvenal plumage (Ainley et al. Reference Ainley, O’Connor and Boekelheide1984). Juvenal-plumaged individuals are spread east-west in the pack ice overlying the Ross/Amundsen seas continental slope, and probably not all are from Ross Island (25% of the world’s population nests near the shelf break of the western Ross Sea; Lynch & LaRue Reference Lynch and LaRue2014).
The persistent pack ice extends east from the north-eastern Ross Sea/Amundsen Sea along the coast to the southern Bellingshausen Sea. There, Adélie penguins also forage in the pack ice and exhibit a δ15N signature (9–10‰) in accord with the Cape Crozier results (both chicks and pre-moult adults). Similarly, Cape Crozier δ15N values are similar to those of adults foraging pre-moult in the pack ice of the north-western Weddell Sea (east coast of Antarctic Peninsula; Zaldua et al. Reference Zaldúa, Zajková, Machado-Gaye, Franco-Trecu, Cosse and Ropert-Coudert2024). Those results are significantly higher than the δ15N signature of penguins foraging in the central WAP (7–8‰), a level indicating a diet mostly of krill and where Adélie penguin populations are decreasing (cf. La Mesa et al. Reference La Mesa, Riginella, Mazzoldi and Ashford2015, Gorman et al. Reference Gorman, Ruck, Williams and Fraser2021). Early in chick-rearing (chick day 5), the more southern-breeding WAP Adélie penguins feed their chicks a diet containing up to 6% fish (Gorman et al. Reference Gorman, Ruck, Williams and Fraser2021). That is probably an underestimate of the importance of fish given the greater prevalence of fish in diets of older (week 5) chicks, which is the pattern seen at Ross Island (e.g. Ainley et al. Reference Ainley, Ballard, Barton, Karl, Rau and Ribic2003) and other Ross Sea locations (Lyver et al. Reference Lyver, Macleod, Ballard, Karl, Barton and Adams2011). In the southern WAP, older chicks have higher δ15N values than younger chicks (Gorman et al. Reference Gorman, Ruck, Williams and Fraser2021), indicating an increasing proportion of fish in the diet throughout chick-rearing.
While the proportion of fish in the diet in the Ross Sea moult area for post-breeding birds from Cape Crozier is appreciable, it is less than that within the breeding colony foraging area during chick-rearing (25% vs 40%; Massaro et al. Reference Massaro, Ainley, Santora, Quillfeldt, Lescroël and Whitehead2020). One possibility may be that competition for silverfish is increased in areas to which the birds from Cape Crozier have travelled post-breeding (north-eastern Ross Sea; Fig. 1) and thus silverfish are depleted. A few lines of evidence support this possibility. First, the geographical structure of Adélie penguin, emperor penguin and Weddell seal populations indicates that for the Ross Sea, as well as Antarctic-wide, a negative correlation exists among colony sizes: where one species is abundant, the others have small populations or are not present (LaRue et al. Reference LaRue, Salas, Nur, Ainley, Stammerjohn and Barrington2019, Reference LaRue, Salas, Nur, Ainley, Stammerjohn and Pennycook2021). This pattern suggests that trophic competition is occurring between these three species. Weddell seals and both penguins all forage in the same habitat with overlapping foraging depths, although seals and emperor penguins dive deeper on average than Adélie penguins. Foraging depth overlaps occur principally over the continental shelf and slope, with of all these species preying heavily on silverfish (Ballard et al. Reference Ballard, Jongsomjit, Veloz and Ainley2012). On a smaller spatial scale in McMurdo Sound during November–December, all three species forage along the edge of the fast ice that covers the southern half of McMurdo Sound, with that edge usually at Cape Royds (Kim et al. Reference Kim, Saenz, Scanniello, Daley and Ainley2018). When killer whales (Orcinus orca) arrive for the season (predator of seals and emperor penguins), the emperor penguins and Weddell seals flee. That leaves only the Adélie penguins to forage in that habitat (Saenz et al. Reference Saenz, Ainley, Daly, Ballard, Conlisk and Elrod2020). In the absence of the other two competitors, the proportion of silverfish in the Adélie penguin diet increases significantly (Saenz et al. Reference Saenz, Ainley, Daly, Ballard, Conlisk and Elrod2020).
Thus, it may be that silverfish availability to Adélie penguins in the north-east Ross Sea/Amundsen Sea moult area (Fig. 1) is negatively affected by ~25% of the world’s emperor penguins (i.e. ~200 000 individuals, including non-breeders) arriving and then residing in that area 1–2 months earlier (also for moult; Ainley et al. Reference Ainley, O’Connor and Boekelheide1984, Reference Ainley, Jacobs, Ribic and Gaffney1998, 2010, Kooyman et al. Reference Kooyman, Siniff, Stirling and Bengtson2004). The abundance of silverfish in trawls conducted in this area was less than what had been found in similar trawls in waters of the western Weddell Sea (i.e. off the east coast of the Antarctic Peninsula; Donnelly et al. Reference Donnelly, Torres, Sutton and Simoniello2004). This may not be surprising given that the emperor penguin population size in those waters is two orders of magnitude less than what occurs in the north-eastern Ross Sea (Santora et al. Reference Santora, LaRue and Ainley2020). Moreover, Weddell seals are also not common in the western Weddell Sea (LaRue et al. Reference LaRue, Salas, Nur, Ainley, Stammerjohn and Pennycook2021). The paucity of emperor penguins and seals in that area is probably due to the lack of fast ice for breeding because that coast is characterized by unstable ice shelves (Fraser et al. Reference Fraser, Wongpan, Langhorne, Klekociuk, Kusahara and Lannuzel2023). The absence of significant numbers of these species may explain or contribute to the increased availability of silverfish in the pack ice of the western Weddell Sea.
Alternatively, the decreased proportion of fish in the diet between chick-rearing and pre-moult at Cape Crozier, although still substantial, could be replaced to some degree by the significant availability of shallow krill swarms (both crystal and Antarctic krill) outside of the colony foraging area. Less energy-sapping shallow dives for abundant krill would allow fledged chicks and post-breeding adults to compensate with the less-energy-dense diet. Super-abundant, shallow krill can compensate for the lack of fish in the diet of Adélie penguins during breeding in the central WAP (Cimino et al. Reference Cimino, Fraser, Patterson-Fraser, Saba and Oliver2014).
Foraging habitat
In addition to the sea-ice element, aspects of the water column probably contribute to the Adélie penguin foraging habitat. This would be reflected in part by the δ13C signature. Higher values are generally reflective of continental shelf waters compared to oceanic waters. The similarity in the range of values between the chick and adult feather samples indicates a strong influence of Ross Sea surface water and, thus, foraging in the same ‘niche space’ (Cherel et al. Reference Cherel, Hobson, Guinet and Vanpe2007). At the Shelf Break Front, or at least in waters overlying the upper slope (i.e. location of the moult area), it appears that the influence of the upwelling of Circumpolar Deep Water, as well as the marginal ice zone, may help to maintain the high productivity of waters over the Ross Sea continental slope (Ainley & Jacobs Reference Ainley and Jacobs1981). The variable presence of the highly productive Ross Sea polynya marginal ice zone was correlated with spatial and temporal variation in δ13C from breeding penguins (Massaro et al. Reference Massaro, Ainley, Santora, Quillfeldt, Lescroël and Whitehead2020).
Alternatively, the decreased proportion of fish in the diet between chick-rearing and pre-moult at Cape Crozier, although still substantial, could be replaced to some degree by the significant availability of shallow krill swarms (both crystal and Antarctic krill) outside of the colony foraging area. Less energy-sapping shallow dives for abundant krill would allow fledged chicks and post-breeding adults to compensate for this lower-energy-density diet. Super-abundant, shallow krill can compensate for the lack of fish in the diet of Adélie penguins during breeding in the central WAP (Cimino et al. Reference Cimino, Fraser, Patterson-Fraser, Saba and Oliver2014). The elevated diving rate of Adélie penguins in the pre-moult foraging area (Lescroël et al. Reference Lescroël, Schmidt, Ainley, Dugger, Elrod and Jongsomjit2023), however, does not necessarily indicate an uncontested abundance of krill. Also foraging and competing in that area during late summer are huge numbers of crabeater seals (Lobodon carcinophagus), 40% of the world’s Antarctic petrels (Thalassoica antarctica) and other predators (Ainley Reference Ainley, Siegfried, Condy and Laws1985, Ballard et al. Reference Ballard, Jongsomjit, Veloz and Ainley2012, Smith et al. Reference Smith, Ainley, Arrigo and Dinniman2014). Myctophid fish, which rise to surface waters during darkness and are important prey to seabirds (Ainley et al. Reference Ainley, O’Connor and Boekelheide1984, Reference Ainley, Ribic and Fraser1992), are also prevalent in that area (Donnelly et al. Reference Donnelly, Torres, Sutton and Simoniello2004).
Conclusions
We investigated the diet across multiple parts of the Adélie penguin annual cycle (see also Zaldua et al. Reference Zaldúa, Zajková, Machado-Gaye, Franco-Trecu, Cosse and Ropert-Coudert2024). Overall, our results support those of others that bring into ‘question the long-standing paradigm that … krill are the only food web component critical to penguin reproductive survival in … the Southern Ocean’ (Gorman et al. Reference Gorman, Ruck, Williams and Fraser2021: p. 2). Foraging primarily in Antarctic shelf waters where the energy-dense Antarctic silverfish is abundant and dominates the fish fauna (plus higher-energy-density myctophid fish over the slope) is probably an important component to current as well as historical (e.g. Reaves et al. Reference Reaves, Powers and Emslie2025, Wood et al. Reference Wood, Zhou, Cole, Coleman, Anderson and Lyver2025) Adélie penguin ecological success (Ainley & Wilson Reference Ainley, Wilson, Goldstein, Elias and Costello2024). Where fish are not prevalent enough, the Adélie penguin does not flourish (e.g. the northern WAP; Chapman et al. 2011, Gorman et al. Reference Gorman, Ruck, Williams and Fraser2021). Thus, although Adélie penguins can manage on a diet principally of krill, as long as krill are readily available (Chapman et al. 2011, Cimino et al. Reference Cimino, Fraser, Patterson-Fraser, Saba and Oliver2014, Lohmann et al. Reference Lohmann, Morton, Schofield and Nowacek2023), our study shows that their foraging is somewhat more plastic and more efficient if energy-dense fish are also readily available.
Disclaimer
Any use of trade, firm or product names is for descriptive purposes only and does not imply endorsement by the US Government.
Acknowledgements
Michael Polito and co-workers conducted the stable isotope analysis and got us started on the interpretation. All penguin survey, capture and handling methods used for data collection were performed following all relevant guidelines and regulations under the approval and oversight of the Institutional Animal Care and Use Committees of Moss Landing Marine Lab, Oregon State University or Point Blue Conservation Science. Additionally, all work was approved and conducted under Antarctic Conservation Act permits issued by the US National Science Foundation and the US Antarctic Program. Numerous interns, volunteers and students were indispensable, providing their help in the field. We thank G. Ballard, M. Cimino and A. Schmidt, as well as the reviewers, for helpful comments on the manuscript.
Author contributions
All authors conducted the fieldwork that resulted in the penguin samples analysed in the paper. Most of the writing was drafted by DGA, but all authors contributed ideas to the paper’s development as well as edits to the manuscript. Data analysis was conducted by KMD.
Financial support
The work was conducted under a series of continuing NSF grants: OPP 9526865, 9814882, 0125608, 0440463, 0944411, 1543541, 1543498 and 1935870, with the current work specifically prepared under 2040199.
Completing interests
The authors declare none.



 Open access

